Monthly Archives: September 2022

September 1, 2022

By David Snowball

Dear friends,

Welcome to the end of summer. Traditionally, in the markets and on college campuses, it’s a quiet time of year. Trading volumes drop, traders and sensible people alike flock to beaches, and facilities crews at colleges like Augustana work 12-hour days trying to address all the issues that can’t be dealt with in a college jammed with people.

But come this first weekend of September, a new chapter begins … with a new president (Andrea Talentino is the ninth president in our 162-year history, and only the sixth president since 1901), a stunningly generous alumni gift to fund a new scholarship program (Augustana Possible) for high-achieving students from families without a lot of money, and 630 new first-year students. That tally includes something like 120 new students who have traveled 7500 miles from home and who might not see family again until after their sophomore year. At a time when domestic students are hesitant to consider schools more than two hours from mom and dad, that strikes me as an act of faith and bravery that’s profoundly humbling for those of us who are charged with making it all seem possible.

Is the sun rising or setting over Old Main, my academic home? At this moment, with these kids, I know it to be dawn.

The price of keeping your fingers jammed in your ears

On Friday, August 26 at 10:00 a.m. EDT, Fed chair Jay Powell said exactly (a) what he’d been saying for months and (b) what investors knew he was going to say. One of the mavens at Wells Fargo confidently predicted:

(Source: CNBC, of course)

That day’s relief rally looked sort of like this:

If market mavens were capable of blushing …

Historically, September and October have been the year’s two most volatile months. In many ways, this year’s market is likely to be shaped by an unlikely figure: Vladimir Putin. The Federal Reserve is trying to make aggressive but data-driven moves to control inflation. As the head of a major energy exporting nation, should Mr. Putin do something precipitous, a panicky spike in the price of food and energy would follow.

A sensible strategy might be to follow the data rather than follow the talking heads. Mr. Powell has announced his expectation that they will inflict pain on you in order to change your habits; that change in habits will be reflected in data about year-over-year price changes and consumer and industrial activity. If all of those remain elevated, the Fed will crack down harder.

At the moment, investor confidence – reflected in the VIX – remains inexplicably high, and spending is brisk. Professionals are confident that the Fed will bump rates by 75 bps in September and then ease up. Professionals are frequently wrong, though rarely uncertain. If they were wrong in either of these two latest guesses, exceptional unhappiness will ensue.

For me, and most of my colleagues here, our long-term plans were designed with the reality of major drawdowns and grinding markets in mind. Since the market has generously provided both, we’re doing little more than making marginal adjustments. We try to learn from the past, but we can’t outthink the future, and we aren’t trying.

To the extent you can, distance yourself from the noise. Lock your cell phones away in a drawer. Harvest tomatoes. Marvel at the Detroit Lions’ decision to cut all of their backup quarterbacks. And think long-term: is your asset allocation appropriate to your stage in life? Are you comfortable with the funds that enact the plan? Are there ways of adjusting your lifestyle to generate fewer demands and more delights, however quiet?

Painful unwinding of FPA International Value / Phaeacian Accent International Value

Will Schmitt for CityWire (8/25/2022) chronicles the ugly and painful public unwinding of the partnership between FPA and Polar Capital and the liquidation of the two FPA funds adopted by Polar.

We had already shared our conversation with Pierre Py, lead manager for the FPA/Phaeacian funds, about his anguish over the funds’ demise and his determination to one day return to the field (“Off to the Dustbin of History,” May 2022).

Mr. Schmitt’s reporting reveals a series of lawsuits between Polar and Phaeacian and Polar and FPA. He reports,

Polar Capital has accused First Pacific Advisors (FPA) of ‘fraud’ in connection with Polar’s ill-fated acquisition of a team of PMs and their funds from FPA. 

Polar made the accusation earlier this month as part of an ongoing legal battle over the future of Phaeacian Partners, a joint venture between Polar and two former FPA portfolio managers, Pierre Py and Greg Herr. 

After this article was published, FPA issued a statement ‘categorically’ denying Polar’s allegations which it said are ‘completely unsubstantiated with no factual support.’

It’s sad, not least because it sullies the work of two fine managers and keeps their services from the investors they’d like to serve.

This month in the Observer …

Devesh Shah has been puzzling through the past and future of emerging markets investing. Too often, it feels like the theme song for EM investing has been “Tomorrow” from the musical Annie.

The sun’ll come out tomorrow
So you got to hang on ’til tomorrow
Come what may

Tomorrow, tomorrow, I love ya tomorrow
You’re always a day away

There have been stretches when EM returns have been spectacular and longer stretches when we’ve mostly talked about how they should be spectacular … perhaps tomorrow? Devesh engaged in conversations with six distinguished EM managers about the asset class, its challenges, and its future. He shares his results in “Emerging Markets Investing in the Next Decade: The Game.”

We complement Devesh’s piece with quick bios of the Select Six and their funds in “Emerging Markets Investing in the Next Decade: The Players.”

Lynn Bolin provides more depth to the case for caution in “Here be dragons: Data-driven caution for the market ahead,” then complements that with an in-depth analysis of Fidelity New Millennium ETF (FMIL), the newest addition to his portfolio. And yes, he does talk about why an aggressive fund and a cautious approach can complement one another.

The Shadow brings us up to date on industry news and foolishness in “Briefly Noted.”

Finally, I share profiles of two remarkable funds. We first profiled Harbor International Small Cap Fund (HAISX) in September 2021, around the second anniversary of its new management team, from Cedar Street Asset Management. We told you then that it was going to be good. Turns out it was even better: since Cedar Street joined, HAISX has been the top-performing international small cap fund in existence, sometimes by a mile. Heck, it’s the top performer among both international small value and international small core and is a top five fund even when you add international small growth. Barron’s is on the trail, and you might want to be, too.

Disciplined Growth Investors (DGIFX), headquartered in Minneapolis about a mile from my son’s tiny apartment, is the most distinctive balanced fund in existence and also one of the most successful by a whole string of measures. In a peer group dominated by funds that invest like the S&P 500 Index, DGI pursues a true multi-cap (really, micro-caps in a balanced fund … who’d have imagined?) balanced portfolio whose performance beats even an all-equity benchmark. The team seems talented, focused, and passionate. Learn more.

Thanks, as ever …

To Radley Olson, for his financial support and kind note. There’s a 19th-century adage, “if you want anything done, ask a busy person to do it” (no, not Franklin, not Lucille Ball, or any of the rest … the earliest instance in print is 1856), which seems to rule our lives. As soon as I stepped aside from a quarter century as chair of a large academic department, I was asked to help revive our wobbly Honors program. As soon as Chip moved out of her deanship and into the role of Chief Information Office at her college, her new chancellor poked her head in the door with an innocuous, “do you have just a minute?” (sigh) That said, we’ve planned a couple of weekends away in fall – there’s a fascinating heirloom apple orchard in southeast Wisconsin and lots of reasons to drive up along the Mississippi – and are plotting an escape to the Shetland Islands (her family has roots there) in the year ahead. And so, thanks! We’re good.

Blessings to our indispensable regulars, from the good folks at S&F Investment Advisor in lovely Encino to Wilson, Gregory, William, the other William, Brian, David, and Doug. And to Ira, Andrew, Paul, Sherwin, and James, thank you, thank you, and thank you.

It would be great if you’d join them, either with a tax-deductible contribution to MFO itself or through a $125 membership to MFO Premium. Given the cost and wobble evident in Morningstar’s slimmed-down “Investor” service, serious folks might find it money well invested.

As you’re reading this, I’ll be in Minneapolis helping Will get settled into a tiny apartment near Loring Park and a new life as a graduate student. If you want to get a sense of the passing of the years at MFO (and, I dare say, what “graceful aging” looks like), you might compare this summer’s version of Will and me with the snapshot of us on London’s Millennium Wheel, on the “Support Us” page.

It will be an adventure, as so much of a good life always is.

Take care, and we’ll see you soon,

Harbor International Small Cap (HIISX / HNISX), September 2022

By David Snowball

Objective and strategy

Harbor International Small Cap Fund pursues long-term growth by investing in a diversified portfolio of international small-cap stocks. They have three particular preferences:

  1. demonstrate traditional value metrics primarily on a price to book, price to earnings, net asset value (NAV), and/or dividend yield basis;
  2. well-capitalized and transparent balance sheets and funding sources; and
  3. business models that, through a complete business cycle, generate returns on equity or invested capital in excess of their cost of capital.

Up to 15% of the fund’s total assets may be invested in emerging markets, though direct EM exposure is currently minimal. The portfolio held 61 stocks as of 6/30/2022.

Adviser

Harbor Capital Advisors. Harbor is headquartered in Chicago. In 2013 its corporate parent, Robeco Group NV, was acquired by ORIX Corporation, a Japanese financial services firm with a global presence. Harbor is now a wholly owned subsidiary of ORIX. In May 2021, Harbor liquidated its five Harbor Robeco funds just two years after launch. Collectively, the 20 Harbor funds, almost all of which are externally managed, have $60 billion in assets.

Cedar Street Asset Management serves as the sub-advisor for Harbor International Small Cap Fund. It is an independent value-oriented investment management firm with ten employees and is also headquartered in Chicago. The firm is independent, owned by its employees, and manages approximately $274 million (as of 7/31/2022).

Managers

Jonathan Brodsky and Waldemar Mozes. Mr. Brodsky founded Cedar Street in 2016. Prior to that, he established the non-U.S. investment practice at Advisory Research. Mr. Brodsky began his investment career in 2000. He worked for the U.S. Securities and Exchanges Commission’s Office of International Affairs, focusing on cross-border regulatory, corporate governance, and enforcement matters. Mr. Brodsky holds a B.A. in political science and an M.A. in international relations from Syracuse University and an M.B.A. and J.D. from Northwestern University. He also studied at Fu Jen University in Taipei, Taiwan.

Mr. Mozes is a Partner and the Director of Investments for Cedar Street Asset Management. Prior to joining Cedar Street, Mr. Mozes developed and implemented the international investment strategy at TAMRO Capital Partners LLC and managed ASTON/TAMRO International Small Cap Fund (AROWX). It had a very promising launch, but the advisor pulled the plug after just one year because they had over $2 million AUM. Mr. Mozes is a bright guy with experience at Artisan and Capital Group. He jokingly described himself as “the best fund manager ever to come from Transylvania.”

Strategy capacity and closure

$2 billion. The equivalent non-US small cap value strategy that Mr. Brodsky managed at Advisory Research reached around $1.5 billion and there were considerations at the time to move toward a soft close once they hit the $2 billion plateau.

Management’s stake in the fund

Each of the PMs has between $10-$50K invested directly in the mutual fund, and the senior investment team has over $2 million invested in a limited partnership on which the fund is based. Beyond that, the managers own the sub-advisor and have sort of dedicated their lives, fortunes, and sacred honor to making it work.

Opening date

Nominally, February 01, 2016. As a practical matter, the fund was reborn on May 23, 2019, when Cedar Street Asset Management brought a new team and new discipline to the fund. They succeeded the Barings team that had been in place at inception.

Minimum investment

$2,500 for the Investor class shares, and $50,000 for Institutional shares.

Expense ratio

1.32% for Investor class shares and 0.96% on Institutional class shares, on assets of approximately $368.2 million(July 2023). The fund has seen steady inflows over the past year or so, often from investors who had worked with them on earlier funds.

Comments

Let’s start with the part people care about: Harbor is the best international small cap fund around.

The immediately meaningful metric here is the fund’s three-year record, since the current team – which itself has a solid record for longer than three years – assumed responsibility for the fund.

Both Morningstar and Lipper classify the fund as international small-mid value. We start there. Using the screeners at MFO Premium, which draw on the Lipper Global Data Feed, we examined the records of all international small cap value and core mutual funds and ETFs. In both absolute and risk-adjusted metrics, Harbor is the top-performing fund.

36-month record (through August 2022), international small-to-mid value

  Total return Sharpe Martin Capture ratio Alpha
Harbor 7.9% – #1 0.35 – #1 0.72 – #1 1.2 – #1 4.0 – #1
ISCV peer ave. 3.2 0.12 0.25 1.0 -0.7

Total return is a fund’s average annual return for the period; Harbor had the highest total return. Sharpe and Martin ratios are standard and conservative measures of risk-adjusted performance; Harbor was again first.

The two less-familiar measures. The capture ratio compares the amount of a group’s downside that an investment captures relative to the amount of upside it captures. A capture ratio over 1.0 means that you’re seeing more upside than average. Alpha tries to capture the same phenomenon by looking at how much an investment returns relative to what you would expect in a portfolio like it. Alpha is often used as a measure of manager skill or, at least, manager value-added.  It is a sort of “how much bang for the buck” calculation. Any score above 1.0 means that you’re winning. In both cases, no one has done better.

Even when we extend the comparison to the larger set of international small cap core funds, Harbor remains the top choice with the highest total return, Sharpe ratio, capture ratio, and Alpha.

Extended as far as possible to include all international small-to-midcap funds and ETFs -– value, core, growth – Harbor finishes in the top 5% by all of these measures. Given the market’s growth bias, that’s a remarkable accomplishment.

We can say with confidence that the Cedar Street team has been about the best at what they do. The portfolio reflects three distinct preferences:

  1. it’s a true small cap portfolio. Its Morningstar peers in the international small value group have, on average, 25% of their portfolios in large- and mega-cap names. Harbor has zero. At the other end of the scale, Harbor has 40% invested in small- and micro-cap stocks, about twice the peer average. That works out to a median market cap of $1.45 billion, compared to $3.5 billion for its peers.
  2. it’s a value portfolio. Many of its peers, even in the value category, cheat toward growth.
  3. it’s a quality portfolio. The managers consciously pursue quality companies, and quality is one of the most powerful and consistent predictors of investment performance. In particular, they generally pursue firms with both high-quality management and pristine balance sheets.

The most pressing remaining questions are, (1) should you consider international small caps (2) now?

Why international small caps?

There are four arguments for considering an investment in international small cap (ISC) stocks and one additional argument for considering it now.

  • The ISC universe is huge. Cedar Street estimates that there are 5,000 non-US small caps. In comparison, there are about 3,000 international large cap companies and fewer than 2,000 US small cap stocks.
  • It is the one area demonstrably ripe for active managers to add value. The average ISC stock is covered by fewer than five analysts, and it’s the only area where the data shows the majority of active managers consistently outperforming passive products. Based on 3- and 5-year Sharpe ratios, 80% of the 25 funds and ETFs with the top risk-adjusted returns were actively managed.
  • International small is a more attractive asset class than international large. The managers noted that “most US investors fail to recognize that small caps outperform large caps outside the US. When people think of small caps, they think of extreme volatility, but that doesn’t hold up in the small cap space outside the US. Small caps tend to have comparatively lower volatility, better risk-adjusted returns, and a lower correlation to the US markets.” Since the Global Financial Crisis, international small-mid value has posted better raw and risk-adjusted returns than international large value; international small-mid growth has similarly beaten international large growth.
  • Most investors are underexposed to it. International index funds (e.g., BlackRock International Index MDIIX, Schwab International Index SWISX, Rowe Price International Index PIEQX, or Vanguard Total International Stock Index VGTSX) typically commit somewhere between none of their portfolio (BlackRock, Price, Schwab) to up a tiny slice (Vanguard) to small caps. Of the ten largest actively managed international funds, only one has more than 2% in small caps.

Why now?

Briefly put: mean reversion.

US stocks have outperformed international stocks, the US currency has risen against its EAFE peers, and US corporations have posted record levels of profit. But it’s impossible to maintain record profit levels and record valuation levels indefinitely.

Manager Waldemar Mozes notes,

The strong US dollar has been a significant headwind to performance for most non-US funds. This provides an opportunity for non-US companies that have significant earnings exposure to US markets. In addition, the same way that many Americans are enjoying cheaper shopping in Paris or hotels and dining in Tokyo this summer, so too can they enjoy more buying power in non-US funds.

Growth stocks have outperformed value stocks for the past decade. That dominance was triggered by the (justifiably) panicked reaction of central banks to the global financial crisis, which plausibly threatened the collapse of the global financial system. Their solution was free money, then more free money delivered through conventional and unconventional means. National governments joined the frenzy in 2020 with trillions of stimulus spending to offset the global pandemic. That tidal wave of money encouraged, then underwrote, all sorts of financial tomfoolery, from using high-yield debt to pay for stock buybacks to convincing formerly sober adults that electronic images of bored apes were an asset class. Those days are ending.

Value and growth styles tend to alternate long periods of relative outperformance. The chart below reflects two long periods of dominance by value and, since the global financial crisis, a long period of growth dominance.

If value resurges (hinted at in the 2022 move on this chart), it might dominate growth through the end of the decade.

Messrs Mozes and Brodsky argue that both reversion and financial uncertainty strengthen the argument for international value investing.

We also believe that value-style equities are likely to outperform due to fundamental reasons. The market has been paying less for earnings streams from value-style equities than growth-style equities, both in absolute and relative terms … when many “value” companies reach an operational inflection point (e.g., top-line acceleration, margin expansion, balance sheet rationalization, sale of an unprofitable segment, etc.) markets will react quickly to the improvement in fundamentals and even re-rate the business with higher multiples. In other words, there are two opportunities to boost returns from depressed, value-style equities.

The opposite phenomena of what is currently taking place with “growth” businesses that fail to meet lofty growth expectations. 

Given the high levels of uncertainty in all corners of financial markets combined with a higher price for failure (rising interest rates), we believe it pays to pay less for new investment opportunities.

Bottom Line

Harbor ISC has earned the MFO “Great Owl” designation for posting top quintile risk-adjusted returns, it earned the Lipper Leader recognition for both Total Return and Consistent Returns over the three years since Cedar Street assumed command, it earned a spot on Schwab’s Select List, and it has a five-star rating from Morningstar for the same period. It’s an experienced team and a sensible strategy with a rock-solid track record, both here and at their former Advisory Research and TAMRO funds. Equity investors interested in putting a bit of light between themselves and the high-priced US equity market would be well-advised to put Harbor International Small Cap Fund on their due diligence list.

Fund website

Harbor International Small Cap Fund. The guys’ Quarterly Report, under “Documents,” is clear and sensible, though mostly focused on the here-and-now. Readers interested in the general case for investing in international small cap stocks might find interest in one of several recent white papers. Those might include Artisan Partner’s “The Case for International Small Caps” (2021), Putnam’s “Why Now is the time to consider international small caps” (August 2022), and Steve Lipper’s “Why Allocate to Non-U.S. Small-Caps?” (2021).

Disciplined Growth Investors (DGIFX), September 2022

By David Snowball

Objective and strategy

Disciplined Growth Investors pursue both long-term growth and modest current income at reasonable risk. Approximately 65% of the portfolio is invested in stocks and approximately 35% in bonds and cash. The managers can gradually shift equity exposure down to about 55% or up to about 70% if market conditions warrant.

The managers invest primarily in smaller US stocks, currently defined as those with market capitalizations between $1 billion and $15 billion. They “don’t mindlessly diversify across every market, sector, and asset class.” They focus on well-managed corporations and mid-sized growth stocks. The portfolio is constructed. The core attributes of a good investment are “a sustainable competitive advantage relative to industry peers, long-term superior return on capital coupled with the financial ability to meet reasonable growth objectives.”

The fund invests in investment-grade bonds. The weighted duration is 5-10 years, but with the fixed income sleeve, in particular, the managers allow that their process “has both ‘top-down’ (including duration/ maturity positioning, yield curve risk, and sector/quality risk) and ‘bottom-up’ (including credit research, quantitative analysis, and trading) components.” In consequence, they might find cause to invest in longer- or shorter-dated securities from time to time.

The current portfolio holds 44 stocks. By Morningstar’s calculation, 27% qualify as micro-to-small caps, 25% as mid-caps, and 19% as large caps. They own no mega-cap stocks, which occupy over 30% of their peers’ portfolios.

Adviser

Disciplined Growth Investors, headquartered in Minneapolis, was founded in 1997. It is primarily an institutional investment manager that provides investment management services to pension and profit-sharing plans, corporations and other business and government entities, charitable organizations including foundations and other non-profit entities, and select high-net-worth individuals. The Disciplined Growth Investor Fund is their attempt to provide an institutional-quality portfolio available to regular folks. The firm managed $5.4 billion for over 110 clients as of 12/31/21. They advise two limited partnerships and this one fund.

Managers

Fred Martin, Rob Nicoski, Nick Hansen, and Jason Lima.

Mr. Martin founded Disciplined Growth Investors in 1997 and has managed the fund since its inception in 2011. He’s a Navy veteran who started his investing career at Northwestern National Bank. Mr. Nicoski joined DGI in 2003. Prior to joining DGI, he was a co-manager on a small cap mutual fund at US Bank, an analyst at Piper Jaffray, and a bank examiner for Minneapolis Federal Reserve. Nick Hansen joined DGI in 2006 as an analyst out of the MBA program at St. Thomas (my son’s alma mater, so “go Tommies!”). Prior to that, he had been in the graphic design/advertising world working in 3D animation (he’s a computer science guy) and has also been on the fund since inception. Mr. Lima, a Navy veteran, joined DGI in 2011 and the fund in 2022.  His undergrad degree is from MIT in Electrical Engineering and Computer Science (a combined program), which was followed by an MBA from Booth School of Business in Chicago. All of the managers are CFA Charterholders. Mr. Nicoski has earned his CPA.

Strategy capacity and closure

Mr. Martin intends to close the fund by the time it reaches $1 billion AUM. “We are,” he admirably noted, “slightly crazy about undersizing our mandates. We will do what we need to, to protect the ability of the fund to perform.”

Management’s stake in the fund

Mr. Martin has over $1,000,000 in the fund. Mr. Nicoski is in the $500,000-$1,000,000 bracket, while Mr. Hansen is reported to have an entry-level position of $10,000-50,000. The newest member of the team does not yet appear in the official documents and, as such, has no report on share ownership. That said, Mr. Martin reports that every employee at DGI is invested in the fund.

Opening date

August 12, 2011, but the underlying strategy, available through separately managed accounts, dates to February 28, 1997

Minimum investment

$10,000 for a one-time purchase or $100 for accounts established with an automatic investing plan and the intention of building to $10,000. The fund is not available through third-party vendors such as Schwab.

Expense ratio

0.78% on assets under management of about $340 million. In an interview, Mr. Martin declared that “too high” and hopes to whittle it down as assets grow. July 2023: assets under management is $419.8 million. 

Comments

Disciplined Growth Investors is one of the best-performing balanced funds in existence. It’s also one of the most distinctive. That distinctiveness makes it interesting and valuable, but it also renders treacherous comparisons with its nominal peers.

Let’s start with the “the best” claim. Over the past 10 years, Disciplined Growth Investors finished 5th of 190 growth allocation funds in total returns with an annual return of 9.9%. Its annual return over the average five-year period, its “average annual return over 61 rolling five-year periods,”10.5%, is also 5th of 190.

“Most distinctive” reflects its commitment to smaller stocks. The average market cap for Disciplined Growth is $11 billion, by Morningstar’s calculation. Its average peer sits at $63 billion. DGI invests 27% of its portfolio in micro-to-small cap stocks, its peers place 4% there. By both measures, that’s a seven-to-one difference between DGI and the crowd. Collectively, micro-to-mid cap stocks comprise 52% of the total portfolio where their peers invest under 20%. The average market cap for stocks in the DGI portfolio is nearly the same as the market cap of Lipper’s mid-cap core equity fund group.

Similarly, the fund’s sector weights are completely independent of its peers: of 11 standard sectors (such as tech or financials), DGI has peer-like weights in only two: energy and industrials. They have no current exposure to three sectors (real estate, utilities, and basic materials) and differ in some sectors (e.g., financials) by 10:1 compared to their peers.

That’s a massive distinction with serious implications for the reliability of peer group comparisons. DGI is more volatile than almost all of its Growth Allocation peers but less volatile and — measured by its average five-year performance – more profitable than a pure mid-cap equity portfolio.

10-year risk-return metrics

How do you read that?

In our three risk measures – maximum drawdown, standard deviation (or “day-to-day volatility”), and downside (or “bad”) volatility – DGI is a bit more volatile than its large cap-heavy allocation funds and substantially less volatile than a peer mid-cap equity fund.

In our two return measures – annual returns over the past decade and annual returns measured by the experience of someone willing to hold the fund for five years – have DGI earning equity-like returns of 10% and outperforming both pure equity and allocation funds based on its performance over a series of 60 five-year rolling periods. That’s important because it captures the likely returns of a long-term investor, the group that any responsible manager cares most about.

The risk-return ratios – the Sharpe ratio and the Ulcer Index, which measures the depth and duration of a fund’s drawdowns (named for the observation that investments that drop a lot and stay down a long time give us ulcers) – show DGI superior to an all-equity portfolio and more than competitive with a growth allocation one.

Here’s the simplified snapshot of that same data.

10-YEAR RISK-RETURN PLOT

10-year standard deviation / APR based on a five-year rolling average

That steady outperformance is driven by two factors.

1. the managers are value-conscious, which makes the portfolio risk-conscious.

The core discipline starts with a “very granular” forecast of the seven-year growth prospects of every potential portfolio company. They’ve used, with refinements, the same discipline for 25 years. If a stock doesn’t project returns of at least 12% annually for the next seven years, they’re out of the discussion. That’s called their hurdle rate, and it accounts for the prospects of the company and also the price of the company’s stock.

Mr. Martin notes that:

We lose money if our forecasts are wrong or we overpay. We have one of the finest long-term records anywhere because we are singularly focused on those two things … in the past 18-24 months, the stocks of high-growth companies were selling at prices well in excess of the future value of the underlying companies … [in a bear market] the former high fliers suffer permanent loss of capital while appropriately priced stocks suffer only temporary markdowns.

Historically, DGI’s valuation-sensitive approach has paid off handsomely “after the bubble has popped.” By their calculation, their stocks outperformed the Russell Mid-Cap Growth Index by 4300 basis points over the five years following the Tech Bubble in 2000 and by 4500 bps in the five years following the Global Financial Crisis in 2008. Cumulatively, since its 1997 inception, its stock portfolio has turned $100 into $1,583 (as of June 2022), while the same investment in the all-stock Russell Mic Cap Growth Index would have returned on $811. 

Anticipating liquidity restrictions, the managers “spent last year de-risking the portfolio, which triggered a lot of turnover and high capital gains taxes, but we had to respond to overvaluation.” The subsequent bear market led to “excellent values” among portfolio stocks, with our stocks showing expected returns comfortably above our hurdle rates. Our portfolios are showing the highest expected returns since 2008 …”

An investor’s biggest risk, he argues, “is a long period of low returns,” and he is pretty comfortable that DGI is positioned to avoid that.

2. the managers want to be in your permanent portfolio.

Through its separately managed accounts, DGI offers all-equity portfolios, but Mr. Martin recognizes that pure equity is too volatile to be a comfortable permanent core holding. Adding 30% cash and bonds – corporates, more than Treasuries just now – they’re able to dial back volatility, add a bit of income and not sacrifice long-term returns.

“We would like,” Mr. Martin says, “to be appropriate as 100% of a 70-year-old’s portfolio” as much as being a comfortable core for a 30-year-old’s.

Bottom Line

We might be in the midst of the latest retelling of an old story: investor mania, government missteps, froth, and FOMO, followed by a painful comeuppance and the beginning of a new financial environment. The stock market has slammed into a brick wall 30 times in the past century; it’s rare that one market’s darlings survive to be the next market’s darlings. That suggests that prudent investors might look beyond the FAANGs and their speculative siblings during the turbulence today and the new market emerging in the years ahead.

Mr. Martin and his colleagues have navigated their portfolios through periods of market madness, collapse, and reset in both 2000 and 2008. Patient investors prospered in both cases. Over the decade of the mutual fund’s existence, it’s posted returns nearly the very top of both its Morningstar and Lipper peer groups. That performance seems not to be an aberration. Sticking to their discipline – buying smaller stocks positioned to grow, selling them when prospects dim or prices become unjustifiable – seems to work.

Investors who understand that the higher short-run volatility might be a necessary and bearable price for higher long-term returns ought to add Disciplined Growth Investors to their due diligence list.

Fund website

Disciplined Growth Investors Fund. Please be careful. Disciplined Growth Investors is a balanced fund, and they do refer to themselves as “DGI.” They are not DGI Balanced Fund, which is offered by the Oriental Trust. Searching “DGI” at Morningstar unfailingly takes you to that other fund. DGI Balanced has nothing to do with this fund but might appear higher in the search results.

Quite separately, it is regrettable for a direct-sold fund to have only a few hundred words of content total on its website.  Inexplicably, much of the core content – prospectus, annual report, and account forms – is hidden under the tab labeled “Geeks + Lawyers.”

2023 Disciplined Growth Investors Website

Fidelity Actively Managed New Millennium ETF (FMIL), September 2022

By Charles Lynn Bolin

Since retiring two months ago, I purchased the actively managed Fidelity New Millennium ETF (FMIL) for diversification. It is one of four actively managed equity ETFs offered by Fidelity that has more than $50M in assets. My introduction to FMIL came from an article by Tezcan Gecgil, “3 Fidelity ETFs To Diversify Your Portfolio In August,” at Investing.com, in which she highlighted that FMIL has done relatively well year-to-date. I then read “ETF of the Week: Fidelity New Millennium ETF (FMIL)” by Aaron Neuwirth from VettaFi, formerly known as ETF Database, which summarizes a podcast by ETF Trends CEO Tom Lydon in “ETF of the Week” with Chuck Jaffe on the MoneyLife Show.

  1. The Wrapper: A non-transparent ETF clone of a mutual fund
  2. The Manager and Strategy: Multi-cap growth with value
  3. Rubber hits the road: Fund performance

The Wrapper: A non-transparent ETF clone of a mutual fund

While FMIL is a new (two-year-old) fund, FMILX is the mutual fund counterpart which is nearly thirty years old and has been managed by John Roth since 2006. Mr. Roth joined Fidelity in 1999 and also manages FMIL. The Fidelity website describes FMIL as:

The fund seeks long-term growth of capital. Normally investing primarily in equity securities. Identifying early signs of long-term changes in the marketplace and focusing on those companies that may benefit from opportunities created by these changes by examining technological advances, product innovation, economic plans, demographics, social attitudes, and other factors, which can lead to investments in small and medium-sized companies. (Fidelity New Millennium ETF)

I favor actively managed funds where the manager has flexibility. Actively managed ETFs are relatively new, but the trend is rising because they offer the benefits of ETFs along with an active management approach. Actively managed ETFs are defined in Investopedia as:

An actively managed ETF will have a benchmark index, but managers may change sector allocations, market-time trades, or deviate from the index as they see fit. This produces investment returns that do not perfectly mirror the underlying index. (James Chen and Charlene Rhinehart “Actively Managed ETF”, Investopedia, June 2022)

The particular twist here is that FMIL is a non-transparent ETF. That is, it does not disclose its holdings daily. That’s a protection offered to the manager who might need a week to either build or unwind a portfolio position; if their activity was disclosed too soon, hedge funds and others would front-run the fund’s trade, driving up costs and driving down returns.  Fidelity honestly warns investors about the price that comes with non-transparency:

Traditional ETFs tell the public what assets they hold each day. This ETF will not. This may create additional risks for your investment. For example: You may have to pay more money to trade the ETF’s shares. This ETF will provide less information to traders, who tend to charge more for trades when they have less information. The price you pay to buy ETF shares on an exchange may not match the value of the ETF’s portfolio. The same is true when you sell shares. These price differences may be greater for this ETF compared to other ETFs because it provides less information to traders. These additional risks may be even greater in bad or uncertain market conditions.

VettaFi provides a handy list of active ETFs (“Actively Managed ETFs”). The largest actively managed equity ETF is JPMorgan Equity Premium Income ETF (JEPI) with $12B in assets. Fidelity is relatively new to active managed equity ETFs and has Fidelity Blue Chip Growth ETF (FBCG), Fidelity Blue Chip Value ETF (FBCV), along with Fidelity New Millennium ETF (FMIL). VettaFi classifies FMIL as a “Large Cap Blend Equity” developed markets fund while Factset classifies it as a “Global Broad Thematic” sector fund. Morningstar classifies FMIL as a Large Cap Value Fund and Lipper classifies it as a Multi-Cap Value Fund. The composition will change with the investment environment. FMILX is currently about 85% invested in domestic equities and 11% invested in international equities.

The Manager and Strategy: Multi-cap growth with value

Fidelity Actively Managed New Millennium ETF (FMIL) is a clone of the four-star Fidelity New Millennium Fund, so the shape of that fund and its manager can help us anticipate the ETF’s prospects.

We can see in Figure #1 that the mutual fund (FMILX) and ETF (FMIL) versions have performed very closely since the inception date of FMIL. We can learn how FMIL might perform over the longer-term by looking at the mutual fund version, New Millennium Fund (FMILX).

Figure #1: Comparison of Fidelity New Millennium Mutual Fund and ETF

Source: Created by the Author Using the MFO Premium Multi-search Tool

John Roth joined Fidelity in 1999 and has managed Fidelity New Millennium Fund (FMILX) since 2006. He has been part of the management team on a wide array of funds including balanced, mid-cap stock, sector, consumer discretionary, multimedia, chemicals, and utility funds. Fidelity describes the fund’s approach this way; it takes:

  • … an opportunistic approach, investing across all sectors, market capitalizations and styles.
  • Philosophically, we believe a company’s stock price reflects the market’s collective view of its future earnings power, but the collective view is often wrong.
  • We believe bottom-up, fundamental analysis can identify those opportunities where our earnings forecasts deviate from consensus, and where the potential reward for being right is high.
  • We look for investment opportunities in emerging growth stocks, where we have a differentiated view on the magnitude of the growth rate; compounders, where we have a differentiated view on the sustainability of the growth rate; and mean-reversion stocks, where we have a differentiated view on the timing, duration or magnitude of the cycle.
  • In constructing the portfolio, we size positions by assessing our conviction in the differentiated view on future earnings power versus its potential payoff.

Morningstar agrees that the strategy is distinctive and evolving, but frets that the process has been applied inconsistently,

  • Manager John Roth pursues a blend of growth, economically sensitive, and cyclical companies.
  • The name count has gradually come down during Roth’s tenure. The number of stocks in the portfolio peaked at nearly 300 in mid-2007, but since mid-2014 it has stayed mostly in the 150-170 range. Roth tends to trade infrequently. Annual portfolio turnover in the past five years has ranged from 22% to 44%.
  • This strategy’s contrarian, valuation-conscious approach is distinctive but lacks consistency over time and warrants an Average Process rating…

Morningstar praises Mr. Roth’s “long tenure, overall experience, and access to Fidelity’s vast analyst pool [which] earn this strategy an Above Average People rating…Roth has more than $1 million invested in both this fund and Fidelity Mid-Cap Stock. He draws on Fidelity’s well-resourced equity team, which includes around 60 domestic-focused analysts.”

Shortly after Mr. Roth assumed management of FMILX, it had a maximum drawdown similar to the S&P 500 during the 2008 Global Financial Crisis of just over fifty percent; however, this was better than most multi-cap value funds. The management style of FMILX has changed significantly since then and the analysis in this article focuses more on the past three to eight years.

The ETF has $56M in assets under management, holds 125 companies, and the top ten companies comprise 26% of the investments. Mr. Roth is responsible for the investment strategy and Andy Browder is responsible for trading and execution. The style box from Morningstar shows that FMIL is a diversified multi-cap fund with a “tilt” towards large cap value. Lipper concurs. Over 35% of the fund is in small-cap and mid-cap companies which tends to increase volatility.  The manager having the flexibility to select funds across style and size was a factor in my selection of FMIL.

Table #1 shows the sector allocation for FMILX. My Defensive Portfolio is heavy in Consumer Staples, Healthcare and Utilities. I wanted a fund that is tilted toward other sectors but “light” on Technology and Consumer Cyclical. There is an overlap on Healthcare.

Table #1: Sector Allocation of Fidelity New Millennium Fund (FMILX)

Source: Morningstar

The Rubber Hits the Road: Fund performance

I used my Bullish ETF Screen at Fidelity, which I modified to include only Actively Managed ETFs, to identify the actively managed ETFs in Figure #2 since July 2020. I added the State Street SPDR S&P 500 ETF (SPY) as a baseline, and FMIL which only has $56M in assets under management whereas one of my normal criteria is a minimum of $100M. The eleven actively managed ETFs have done relatively well compared to the S&P 500. The fund with the lowest total returns over the past two years is the Invesco S&P 500 Downside Hedged ETF (PHDG) and the best performing fund is the State Street SPDR SSgA Multi-Asset Real Return ETF (RLY) which has benefited from higher inflation. Both of these funds perform well under specific situations.

Figure #2: Selected Actively Managed ETFs Since July 2020

Source: Created by the Author Using the MFO Premium Multi-search Tool

Let’s take a look at the better performing funds year-to-date as of the end of July. The S&P 500 (SPY) is the worst performing of the remaining nine funds followed by State Street SPDR SSgA US Sector Rotation ETF (XLSR). Not surprising with high inflation, State Street SPDR SSgA Multi-Asset Real Return ETF (RLY) is the best performing fund. Fidelity New Millennium ETF (FMIL) is the second-best performing fund nearly breaking even.

Figure #3: Top Performing Actively Managed ETFs Year-To-Date

Source: Created by the Author Using the MFO Premium Multi-search Tool

Risk vs Reward

I used eight years to analyze the performance of multi-asset value funds available to individual investors, to see how FMILX compares since Mr. Roth became established as the manager. The blue rectangle in Figure #4 highlights those with higher returns and lower risk as measured by the Ulcer Index which is based on the depth and duration of drawdown. Notice the high risk adjusted performance of VictoryShares US EQ Income Enhanced Volatility Wtd ETF (CDC) which I have owned in the past. I had sold CDC last year when simplifying portfolios. Both are great funds, but recently I decided to buy FMIL based on its performance this year. I may consider adding CDC again at a later date.

Figure #4: Multi-Cap Value Funds Reward vs Risk (Eight Years)

Source: Created by the Author Using the MFO Premium Multi-search Tool

Table #2 compares some of the best multi-cap value ETFs over the past five years. The names in blue indicate funds that are classified as “Great Owls” by Mutual Fund Observer. These Great Owl Funds “delivered top quintile risk-adjusted returns, based on Martin Ratio, in its category.” With the exception of SPY, used as a baseline, Lipper classifies each of these funds as “Active”, but only FMIL, DIVO, and FLLV are not considered Index funds. The Five-Year Tax Efficiency Rating is low for FMILX because the turnover can sometimes be high so tax-advantaged accounts may be ideal locations for the Fidelity New Millennium fund.

Table #2: Top Multi-Cap Value ETFs Compared to FMILX (Five Years)

Source: Created by the Author Using the MFO Premium Multi-search Tool

I then compared how these funds performed year-to-date against their downside deviation as a measure of risk. VictoryShares US EQ Income Enhanced Volatility-Wtd Index ETF (CDC) has been the best performing multi-cap value fund with lower volatility. New Millennium ETF (FMIL) has had a similar return, but has been more volatile.

Figure #5: Top Multi-Cap Value ETFs Reward vs Risk YTD With Objective

Source: Created by the Author Using the MFO Premium Multi-search Tool

A graphical representation of the funds year-to-date is shown in Figure #6. The S&P 500 (SPY) is included as a baseline fund.

Figure #6: Top Multi-Cap Value ETFs (YTD)

Source: Created by the Author Using the MFO Premium Multi-search Tool

Comparison to Low Volatility Funds

After Jerome Powell gave his speech on Friday following the Jackson Hole Conference, the S&P 500 fell 3.37% and FMIL fell 2.31%. When I saw the composition of the iShares MSCI USA Min Vol Factor ETF (USMV) contained 18.6% in Technology, I did a comparison to see how FMIL faired against some low volatility funds on Friday: CDC (-2.08%), SPLV (-2.17%), DEF (-2.82%), FLLV (-2.41%), and USMV (-2.63%). Table #5 shows the comparison for one year. For risk, I showed Downside Capture compared to a 60/40 fund, Downside Deviation, Maximum Drawdown, and Ulcer Index.  For return, I show Total Return (APR) and Risk Adjusted Return (Martin Ratio). The Martin Ratio is the total return divided by the Ulcer Index. CDC, FMIL, and SPLV had the best performance for the past year by most measures.

Table #3: Comparison of Low Volatility Funds to FMIL (One Year)

Source: Created by the Author Using the MFO Premium Multi-search Tool

FMIL does not have an objective of reducing volatility, but has performed better than many low volatility funds for the past year. The funds are shown graphically for the past year in Figure #7. FMIL is more volatile on a month-to-month basis reflecting the high allocation to energy, among other reasons.

Figure #7: Comparison of Low Volatility Funds to FMIL (One Year)

Source: Created by the Author Using the MFO Premium Multi-search Tool

Why did I buy FMIL if I believe that a recession is approaching? I’ve followed the Bucket Approach by having pensions and Social Security to cover most living expenses:

  1. Safety Bucket for living expenses and emergencies for several years,
  2. Defensive Bucket for Traditional IRAs where taxes have yet to be paid and which is overweight in consumer staples, health care, and utilities,
  3. a Tax Managed Account, and
  4. Growth Bucket for Roth IRAs where taxes have already been paid. I use Fidelity Wealth Services to manage the longer-term portfolios.

Mr. Powell’s hawkish speech and response by the markets does not impact my long-term strategy. A bear market will be an opportunity to do a Roth Conversion and increase allocations to stocks at lower valuations. I bought FMIL as a potential long-term investment in which I increase allocations as we move through the contraction phase of the business cycle.

I continue to buy CD ladders as interest rates rise, and will reduce allocations to stocks slightly in favor of bonds as interest rates rise. I reduced allocations to the Columbia Thermostat Fund (COTZX/CTFAX) as interest rates rose, and am now increasing allocations gradually as I expect interest rates to plateau next year and the probability of a recession continues to rise. For those of you not familiar with Columbia Thermostat, the Prospectus shows that it increases its allocation to stocks as the market falls.

Closing

Buying the Fidelity New Millennium ETF (FMIL) is a small adventure for me in my Defensive Portfolio which is set up to balance the risks of inflation and recession while being the least volatile of my portfolios. My Defensive Portfolio contains Real Return, Multi-Asset, Multi-Alternative, Multi-Strategy, Managed Futures, and defensive sector funds. FMIL adds diversification in sectors and styles that I have low exposure to. I chose FMIL because of the active management style which was rewarded this year with lower volatility. The lack of transparency is an issue for investors used to traditional passive ETFs. Short-term investors may want to avoid the fund because of the low assets under management and low volume.

FMILX and FMIL have performed relatively well against multi-cap funds on a risk-adjusted basis over various timeframes. I like the adaptive investment style that adjusts to market conditions, even though it has been described as “inconsistent”. When market conditions change, I expect allocations in my investments to reflect these changes. I expect FMIL to be a longer-term equity holding.

For readers who may be interested in a broader selection of actively managed ETF Categories, I extracted the following actively managed funds with high MFO ratings for risk-adjusted performance for the past three years. FMILX is included for comparison purposes.

Figure #8: Best Risk Adjusted Actively Managed Equity Funds (Three Years)

Source: Created by the Author Using the MFO Premium Multi-search Tool

Here be dragons: Data-driven caution for the market ahead

By Charles Lynn Bolin

Medieval world maps were speculative documents, incorporating what the cartographer knew to be true, but that often left a lot of blank space on the map. The places where the mapmaker could offer only uncertain guidance were marked with the Latin legend “Hic sunt dracones.” That is, “here be dragons.”

To be clear, these were not stupid or credulous guys. They were just guys who knew the world was a dangerous place, and the uncharted regions were the most dangerous of all. And so, they offered the clearest warning they could.

Oh, and for those of you thinking about investing in the next 6-18 months: Hic sunt dracones.

A lot of people whose job it is to convince you to invest (with them) have been working overtime to convince you that it’s … well, time to invest (with them). They’ve spotted market bottoms in June, July, and August, with one maven foreseeing “a relief rally” just 24 hours before the post-Powell plunge.

Investment Environment

In “What’s Next for the Economy?” Fidelity describes that the US economy has moved into the late stage of the business cycle, which is personified by volatile markets, slower economic growth, and increasing signs of a possible recession. Energy, materials, health care, and consumer staples have historically done well during the late stage, and stocks continue to rise along with the volatility. Wells Fargo’s view, as described in “International Economic Outlook: August 2022”, continues to be that the US economy will be in a recession by early 2023.

Federal Reserve Chairman gave his speech following the Jackson Hole central banking conference. The S&P 500 fell 3.37% for the day. Mr. Powell said:

Reducing inflation is likely to require a sustained period of below-trend growth. While higher interest rates, slower growth, and softer labor market conditions will bring down inflation, they will also bring some pain to households and businesses. These are the unfortunate costs of reducing inflation. But a failure to restore price stability would mean far greater pain… (Howard Schneider and Ann Saphir, “Powell Sees Pain Ahead as Fed Sticks To The Fast Lane To Beat Inflation,” Reuters, August 2022)

The narrative has changed from inflation being “transitionary” to rates needing to be “higher for longer.” Higher interest rates will be beneficial to savers over the long run. I believe that a hard landing (recession) is more likely than a soft landing. Figure #1 reveals that the year-over-year change in the Personal Consumption Expenditures Price Index (PCEPI) has remained flat for the past six months suggesting that the U.S. economy has probably reached peak inflation. In addition to a slowing economy, Quantitative Tightening, or Federal Reserve balance sheet normalization, will be a headwind to markets.

Figure #1: Peak Inflation – PCE Price Index

A worsening investment environment is no surprise as my Investment Model continues to deteriorate rapidly, as shown in Figure #2. My neutral allocation to stocks is 50%, with a minimum of 35% and a maximum of 65%. The average allocation to stocks over the past 27 years has been 58%. The current allocation as of July is estimated at 45% stocks, and if the trend continues, will fall to my minimum allocation to stocks of 35% in August as data becomes available. Production, Services, and Labor Conditions are the strongest indicators and provide hope for a soft landing. Indicators that continue to be highly negative are Valuations, Inflation, Margin Debt, and Housing.  Contributing to the decline in Investment Environment are Productivity, Eurozone, Consumer Confidence, Banking, Leading, Recession, Yield Curve, and Interest Rates. To a lesser extent, National (Coincident) Activity and Spending are decreasing the outlook. The Corporate Health and Orders indicators are beginning to show weakness. A recession in 2023 is becoming increasingly likely. The slowdown is broad-based (red line), with nearly forty percent of the indicators being negative.

Figure #2: Author’s Investment Environment

Source: Created by the Author

The Model is not indicating “Defensive” conditions are warranted, only to be conservative. The next six months will be enlightening. I expect Federal Funds rates to rise for the next three to six months, but the yield curve may continue to flatten as a prelude to a recession. I believe that we will see lower lows in 2023 compared to today and position portfolios conservatively.

Retirement Planning in the Face of the Dragon

Why did I buy FMIL if I believe that a recession is approaching? I’ve followed the Bucket Approach by having pensions and Social Security to cover most living expenses:

  1. Safety Bucket for living expenses and emergencies for several years,
  2. Defensive Bucket for Traditional IRAs where taxes have yet to be paid and which is overweight in consumer staples, health care, and utilities,
  3. a Tax Managed Account, and
  4. Growth Bucket for Roth IRAs where taxes have already been paid. I use Fidelity Wealth Services to manage the longer-term portfolios.

Mr. Powell’s hawkish speech and response by the markets do not impact my long-term strategy. A bear market will be an opportunity to do a Roth Conversion and increase allocations to stocks at lower valuations. I bought FMIL as a potential long-term investment in which I increase allocations as we move through the contraction phase of the business cycle.

Those already singed by the dragon might consider the effects of even a modest change in retirement date. According to Emily Brandon at U.S. News in “What Is the Average Retirement Age?”, the average retirement age is 61, up from age 59 in 2022, showing that people are working longer. A 2018 study at the National Bureau of Economic Research called “The Power of Working Longer” estimates “that delaying retirement by 3-6 months has the same impact on the retirement standard of living as saving an additional one-percentage point of labor earnings for 30 years.” I did not know this metric while I worked until age 67. This extra six years of employment deferred drawing from savings, increased the value of pensions and retirement benefits, extended work benefits such as insurance, and increased savings. It also allowed me to defer drawing Social Security retirement benefits until age 70, increasing benefits by over thirty percent in retirement. Social Security and pensions are a form of longevity insurance.

Investors looking at the challenge of traversing the uncharted waters of retirement might benefit from listening to the replay of a seminar I attended in late August 2022. I watched the Retirement Preparation Battle Plan Workshop put on by Richard Risso (Director of Financial Planning at RIA Advisors) and Danny Ratliff (Senior Financial Advisor at RIA Advisors), along with Lance Roberts (Chief Investment Officer at RIA Advisors) and Adam Taggart (CEO at Wealthion).  It is a comprehensive two-hour online presentation about Financial Planning and a great start for someone at any age saving for retirement who wants to understand more about retirement planning. They cover topics such as taxes, Social Security, Medicare (and supplemental plans), Health Savings Accounts, Roth 401K vs Roth IRA, tax-advantaged accounts, investment environment including inflation, asset allocation in retirement, long-term investment environment, aging in place options, housing and care in retirement (Continuing Care Retirement Communities), and longevity insurance, among many more relevant topics. The presentation is available at this link. The presentation will be enlightening for most people.


Happy Preferencing!

By Charles Boccadoro

All fund risk and return metrics, ratings, and analytics were uploaded to MFO Premium Sunday, 31 July, reflecting performance through July 2022.

When we run the monthly update that close to the last business day, we will normally re-run the ratings the following Saturday to pick up any late reporting funds. This past month that version was uploaded Sunday, 7 August. We also uploaded Tuesday, 30 August using the Refinitiv datafile of 26 August.

Going forward, thanks to a suggestion by long-time subscriber Alfred, we will try to update the site database weekly. Those intramonth updates help when funds report portfolio changes, launches, and closures, etc. The datafile date will be posted on our homepage under the “What’s new?” section, each time we update the ratings. Consistent with that date, you will now find the “Month To Date [MTD]” return and rating under Calendar Month metrics in the MultiSearch results table.

The presentation and video of our recent webinar can be found here: Mid-Year Review Webinar Material. Things had been recovering since that mid-July review, but then Chairman Powell shared the Fed’s intentions from the central bank’s retreat at Jackson Hole, WY and markets resumed their decline.

We have a more recent subscriber, Mark Levine, to thank for our recent Enhanced Preferences upgrade. Since Introducing MFO Premium’s Saved Preferences Feature in 2021, users can save in their profiles the way they want to view results from the MultiSearch screening tables. Mark requested two good enhancements: 1) save any resized column widths in Preferences, and 2) keep column order of existing Preferences intact when adding new columns (or deleting) existing ones.

Now, if new columns are added, they will be placed to the right of the existing columns specified in the running Preference. The new columns can then be moved accordingly by the user and re-saved to the existing Preference or to a new one. Ditto, if an existing Preference column is deleted, the remaining Preference columns remain intact, both order and width, until the user decides to exit or update the Preference.

The Preferences feature will appeal to those, like myself, who track say just a hand-full of key metrics [from the more than 1000 available] and more, but also want these metrics to appear in a particular order and format!

Below are three examples, which highlight the Three Alarm metrics. First, the view showing the key alarm metrics:

Next via the View/Preferences button, here’s a saved “Three Alarm New Widths” Preference, which alters column widths, thanks to the feature introduced last year:

Finally, an alternative view “Three Alarm New Order” Preference, for those that like fund name first:

Any or all these views can be saved to user profiles and set at start of search or implemented from results tables via the View/Preferences button.

Expect ratings update through August to post this Saturday late or early Sunday.

Some of the site’s best features come from subscriber requests. Can’t thank you enough!

As always, if you see anything amiss or have more suggestions, let us know and we will respond soonest.

Emerging Markets Investing in the Next Decade: The Players

By Devesh Shah

Who, from a universe of 200+ emerging markets managers, did we choose to speak to … and how?

Good question! We decided to rely on insiders’ judgment, rather than mere notoriety or a strategy’s recent performance. We started by talking with Andrew Foster about his take on his investable universe and its evolution, then asked Andrew whose judgments he respected and who we ought to talk with. We asked those folks the same. Those recommendations, constrained by time and availability, led to conversations with the six worthies below.

We wanted to share a brief bio of each, then a quick snapshot of their strategy’s five-year performance. In each bio, the link directs you back to the strategy’s homepage.

Fund Manager Their story Them!
Andrew Foster Andrew cofounded Seafarer Capital in 2011 after an illustrious stint at Matthews Asia. He co-manages his flagship Seafarer Overseas Growth & Income (SIGIX, five star, Silver) with Paul Espinosa and Katie Jacquet, and Seafarer Overseas Value (SFVLX, five star, Silver) with lead manager Paul Espinosa. SFVLX is one of only four small-to-midcap value EM funds in existence.
Laura Geritz Laura founded Rondure Global in 2016 after a distinguished career at Wasatch Funds, with whom Rondure has an ongoing partnership. Rondure is one of the few women-owned fund advisors and focuses on high-quality core holdings in both developed and developing markets. She co-manages Rondure New World (RNWIX, five star, Neutral M* analyst rating) with Blake Clayton and Jennifer McCulloch.
Todd McClone Todd joined William Blair in 2000 after managing portfolios for Strong Capital Managements. (Who now remembers Dick Strong?) He co-manages William Blair Emerging Market Leaders (WELIX, five star, Gold rated), which targets “well-managed, quality growth companies” with Casey Preyss and Vivian Lin Thurston, both of whom joined the fund (though not the firm) in 2022.
Rakesh Bordia Rakesh, a software engineer by training, joined Pzena in 2007. He co-manages Pzena Emerging Markets Value (three star, Neutral rated), which invests in “deeply undervalued businesses” from among the largest companies in the developing markets, with Caroline Cai and Allison Fisch.
Arjun Jayaraman Dr. Jayaraman is a director, quantitative portfolio manager and head of the quantitative research at Causeway and has been with the firm since January 2006. He co-manages Causeway Emerging Markets (CEMIX, three star, Bronze), which relies on quant screens to create a growth/value balance, with MacDuff Kuhnert, Joe Gubler, and Ryan Myers.
Pradipta Chakrabortty Pradipta has an unusual path to investment management, with 12 years as a product manager for the Indian group of firms like General Mills before completing his MBA at the Wharton School. He joined Harding Loevner in 2008 and co-manages Harding Loevner Emerging Markets (HLMEX, two star, Silver rating) with Scott Crawshaw.

The table below tries to give you a quick visual summary of each strategy’s relative performance over the past five years.

Except for the first column – average annual returns over the past five years – focus on a column heading and a cell color to get the most understanding in the quickest interval. For more detailed analysis, either click on the fund’s web link, in the bios above or be smart to join MFO Premium where the cool kids hang out.

The color coding reflects each fund’s performance relative to its peer group over the past five years.

Blue: much above average, top 20% of all funds!

Green: above average, top 21-40%

Yellow: somewhere between the 40-60 percentile. A perfectly reasonable place to be.

Orange: below average, somewhere between 61-80th percentile.

Red: much below average for this particular time period in this particular measure. Especially in the case of a fund that3 has earned a lot of respect from the experts (Morningstar’s analysts think of Harding Loevner as an intrinsically above-average fund even though that’s not reflected in the recent returns), the best response to a low score is to learn more about what’s behind the lag. Often the laggard in one set of conditions can become the champion in the next.

The first two columns reflect a fund’s above and relative returns over the past five years. Columns 3-7 reflect a fund’s downside potential, ranging from its maximum decline relative to its peers (Rondure and Seafarer, for example, have much smaller maximum drawdowns over the past five years than their peers) to various measurements of volatility, called deviation. Finally, the last four columns offer summary risk-return assessments. If you see blue, you’re getting amply rewarded for the risks you’ve been exposed to.

Complete definitions are available at MFO Premium.

Emerging Markets (EM) Investing in the Next Decade: The Game

By Devesh Shah

Is it time to overweight EM stocks now? To answer this and many other questions, the Mutual Fund Observer reached out to six EM Equity Fund Managers. Our plan was to talk with each at length, sharing one manager’s insights with another and seeking their response. Our hope was to help you gain an insight deeper than “boy, EM valuations sure are low! Time to buy, right?”

I am deeply grateful to them for helping our readers further their understanding. This essay will walk you through their arguments and our reflections on what EM investors might reasonably expect in the years ahead. Our companion article, EM Investing in the Next Decade: The Players, highlights the biography, strategy, and record of these fund managers.

Investors need to stay engaged and pay attention to underperforming asset classes because returns mean revert. EM equities have been significant laggards in the last decade. To make money, we need to buy good assets cheap. What do these managers, breathing EM stocks in and out every day, have to tell us about this asset class today?  We’ll highlight six threads that we’ve drawn from our conversations:

  1. Wild optimism about the prospects of EM at the dawn of the century.
  2. Ugly reality interjecting itself by the second decade
  3. The classic case for EM investing or EM Investing 1.0: They Grow!!
  4. The revisionist case for EM Investing, or EM Investing 2.0: They’ve Changed
  5. The most undervalued stocks on the planet
  6. What could possibly go wrong (i.e., will I soon be writing EM Investing 3.0?)

The 21st century was supposed to be the EM century. It started off that way.

The first decade of the 21st century was an outstanding one for EM stocks. $1 invested in the MSCI Emerging Markets Local Stocks index in Jan 2001 would have turned into $4.04 by Dec 2010, an annualized return of 15 percent. The US dollar was on the down and further juiced EM returns for US investors by an extra 1.2% per year.

Index (Total Returns) MSCI EM Local Index MSCI EM US$ Index
Jan 2001-Dec 2010 15% 16.2%
$1 Invested $4.04 $4.5

In the same time period, from 2001 to 2010, the broad US stock market struggled. The decade was spent digesting the misallocation of capital in two bubbles. $1 invested in the S&P 500 index remained more or less the same, saved by stock Dividends, which helped US stocks return a paltry 1.4% per year.

Index (Total Returns) USA S&P 500 Index
Jan 2001-Dec 2010 1.4%
$1 Invested $1.15

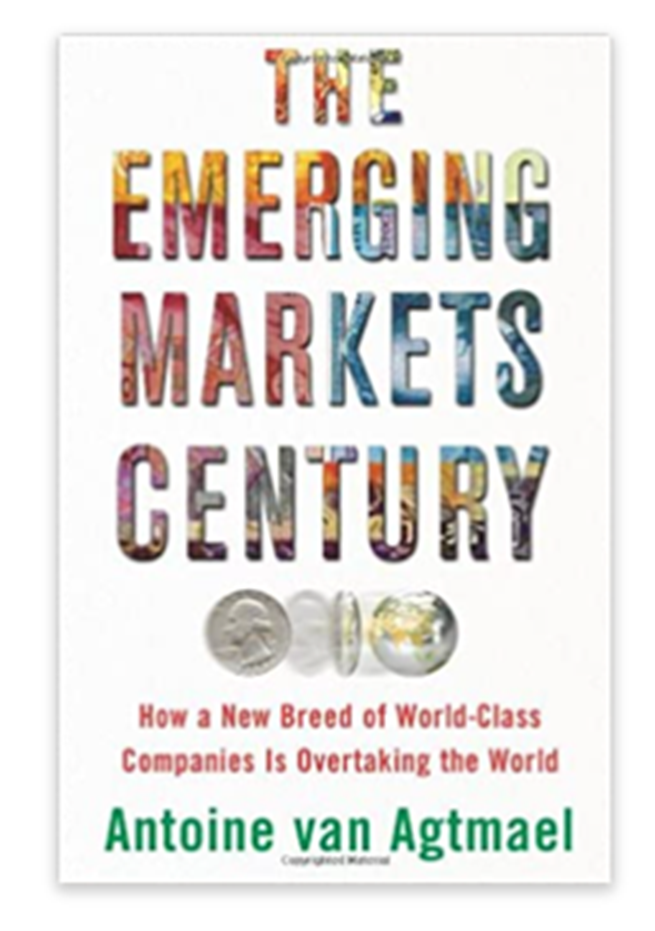
Laura Geritz of Rondure New World recalls how the book, The Emerging Markets Century by Antoine van Agtmael, was published in 2007 when EM countries and stocks could do no wrong.

Coming out of the 2008-2009 crisis, the geopolitical and market thesis was that US dominance after two 50% stock market crashes in one decade was over. EM countries were supposed to be the future. It got so bad for the US that at one point in the 2009 Copenhagen Climate summit, leaders of Brazil, India, China, and South Africa met secretly to negotiate portions of the climate pact. Unthinkably, they excluded the American President from the meeting. When President Obama found out, he crashed into the meeting uninvited. The US was on its knees.

Just when everyone ruled out the US, the second decade had other plans

Consensus bullishness for EM in those days couldn’t have been more wrong over the following 12 years. In fact, we all learnt the hard way that the only asset worth being invested in was Mega Cap US Technology Growth Stocks.

In the 12-year period from 2011 to August 2022, $1 in US Stocks became $4.02, a return of 12.7% annualized. The MSCI EM Local index returned 4.9% a year but adjusted for the strengthening US Dollar, returns for American investors clocked in at a low 1.7% a year.

Index (Total Returns) MSCI EM Local Index MSCI EM US$ Index USA S&P 500 Index
Jan 2011-Aug 2022 4.9% 1.7% 12.7%
$1 Invested $1.74 $1.20 $4.02

Sequence of Returns Matters

Over the entire 22 years of this century, ironically, both the S&P 500 and the MSCI US$ EM Stocks index, produced similar returns – about 7-8 percent annualized. But, from the perspective of an investor, the sequencing of returns matters.

In hindsight, it would have been better to avoid the consensus EM bullishness coming out of the 08-09 crisis. Why did US stocks do so well, and why couldn’t EM keep up in the second decade?

Todd McClone of William Blair pins the blame on quantitative easing:

Central Banks in the Developed Markets (DM) – Japan, Europe, USA – liberally used Quantitative Easing since the crisis. The lower interest rates in US incentivized corporate borrowing, increased leverage, stock buybacks, leading to PE multiple expansion, and DM stock outperformance. EM Central Banks never had that option. EM countries mostly stuck to orthodox monetary policy.

Various fund managers attributed it to a malign combination of inept policy-making and pure bad luck:

Brazil and South Africa went into a deep political and economic crisis. Turkey is out there running some kind of economic experiment. China went through a mid-decade A-share bubble and burst and then undertook regulatory reform to cut the legs out of her fast-growing technology companies. Covid-19 lockdowns and slow vaccine availability crushed GDP in many countries. The commodity boom, which had helped many EM companies outperform in the previous decade, turned into a bust. The final nail in the coffin was the strengthening US Dollar.

Pradipta Chakrabortty of Harding Loevner sees the Western response to the Russian invasion as inadvertently tripping innocent third-party economies:

The speed at which sanctions were imposed on Russian stocks and the trading ban was unprecedented in the modern era. We are now far more focused on the S (Social) of the ESG now. Not just directly but also 2nd and 3rd tier effects in the supply chain.

Original reason to invest in EM stocks Version 1.0

Starting from the 1990s, there were two intertwined reasons to invest in EM.

First: EM version 1.0 was about faster economic growth in those countries. The prime source of returns was supposed to be the high growth in per capita terms. As countries pursued reforms and productivity, they would increase the living standards and life spans of their citizens. In turn, this would create greater profit opportunities for local companies, propelling higher stock market returns.

Second: Investing in EM economies, which were physically and proverbially different from the US would add an uncorrelated source of returns. investors would benefit from portfolio diversification through EM investing.

Andrew Foster of Seafarer: That version 1.0 is now over. Extinct! The low-hanging fruit has been picked, and whatever productivity growth was possible was met. Many of these countries still have the potential, but they lack the political or social will to undertake additional structural reforms. Many EM countries find themselves in the middle-income trap. As a result, EM countries will struggle to generate Real GDP in excess of 3-4% a year. Individual countries and pro-cyclical policies will take selective growth up from time to time to 5-6%. But the delta of EM Growth outperformance to Developed Market (DM) Growth will decline going forward.

The EM story has now evolved. After twenty-five years of EM investing, we have a more liquid, deeper, and broader investment asset class. This allows for more complicated and nuanced strategies to be implemented. This EM version 2.0 is compelling for investors, provided they have at least a 5-year investment horizon.  

Vallabh Bhansali, a hugely successful (and now retired) investment banker in India, in a recent interview with Maggie Lake of Real Vision, said, “I do like to think that if the world had to become rich and prosperous and happy by American standards, it will be a disaster in 20 years.”

I say, why wait for 20 years? Even today, large swaths of Europe have been pushed to the brink by the energy crisis. Shorter hot water showers in Germany, streetlights out in France, state-monitored temperature settings in Spain, and as a UK friend recently mentioned, “the heat wave was so bad, my kids could not sleep. London isn’t built for the summer.” The future of growth in EM and perhaps the world over might require more localized economic models. The companies which succeed will know how to adapt locally in every jurisdiction. Can EM companies cut it? Our fund managers think they are the best suited.

Welcome to the Emerging Markets version 2.0: 

What might be some features of this new version, and what factors support the vision? There are two main reasons to be invested in EM today:

  1. A New kind of company: Confident, regional, and global leaders

In the early days, successful EM investment meant finding local champions. Today, some of these companies have become regional leaders – Mercado Libre, the Amazon of S. America, and Globant, the Infosys of S. America. In a few cases, these EM companies have become global leaders. Samsung and Taiwan Semiconductors in chips, and Tata Consulting in IT.

When a company does well in its own country, it may be because of political patronage or subsidies. But for a company to do well in foreign lands, political favors do not work. The company must have an inbuilt edge: technology, distribution, matured management, and foreign know-how. Such companies have larger revenue streams, bigger market opportunities, and the ability to fire on multiple cylinders. These companies are less prone to cycles in one country. This leads to less earnings volatility and lower cost of capital. It is a small but lucrative subset.

Think about American companies and how they expanded across the globe in the 1980s and 1990s. Globalization brought in a huge profit driver which lasted multiple decades. Many EM companies are today where American companies were 30-40 years ago. They will have to bootstrap their way differently to becoming global companies, but they are knocking on the door, and using every trick in the book.

  1. Value Investing

Value investing is the concept where investors buy shares of companies in the market lower than the valuation dictated in the Balance Sheet. One can say the value is “hidden,” and through some effort – either by shareholders or management – the value gets unlocked, raising share prices. There are prerequisites to the process which make value investing work. Namely:

      1. Accounting standards have to be accurate. The Balance sheet should mean what it says.
      2. Minority Shareholders should have Governance rights, such as proposals at Annual General Meetings and the ability to vote in and out certain Board Members.
      3. Litigation should be an option when all else fails to enforce minority shareholder rights.

These options are now available in many (most) Emerging Markets. Even in China, where justice may be heavy-handed and state determined, a fair commercial litigation is now possible.

There were always cheap companies in EM, but previously, there was no way to extract that cheapness because of promoter control. In version 2.0, Value investing is a strategy available to investors. It’s a new and different source of return available in the Emerging Markets.

Factors that are accelerating version 2.0 in EM:

  1. Many EM companies are family-controlled. Some of them are in their 3rd generation and are often finding that the family is no longer that interested in running the same business as the 1st and 2nd generation.
    1. Non-family management is being increasingly brought in to run the companies.
    2. Families are more open to Private Equity investors becoming large shareholders.
    3. If in the past, owners tried to hide assets from tax authorities, now they are unhiding the asset values to raise selling valuations to institutions.
  2. Local debt markets are becoming more mature. In the US of the 1980s, KKR was able to buy RJR Nabisco because the Michael Milken crew was willing to lend high-yield money. Bank financing would have never created that buyout. In EM, slowly but surely, debt markets are maturing. Companies are able to borrow for longer maturities. Debt mutual funds are lengthening tenors and increasing credit risk for yield. This makes locally debt-financed M&A in home currencies more likely. An example of this was the shadow banking financed HNA (a Chinese insurance company) trying to buy out Vanda (China’s property developer). China has since clamped that market and HNA got into trouble separately, but the seed of the idea holds. As the local markets mature, debt financing is increasingly an option.
  3. Local institutions have now become majority investors in their own markets. For example, South Korea’s National Pension Service Investment Management owns 8.5% of Samsung Electronics. The cash sitting on Samsung’s Balance Sheet is valuable to a defined benefits Pension company. NPS might ask Samsung to pay dividends. When local companies can no longer lay the blame at the feet of foreign money, they lose the excuse of hoarding the cash and not rewarding shareholders.

In Version 2.0, growth at a country level helps, but we are no longer just counting on productivity gains. Investors are now searching for companies where management has matured, has become ambitious, has mastered their country or a region, and is setting sights globally to become the best company in that sector in that world. There will be more companies like Taiwan Semi, Samsung, Tata Consulting, and Infosys. Investors are now trying to find and get behind EM companies going global.

Moreover, the massive underperformance of the last 12 years, where EM stocks went nowhere as an asset class, has led to a massive pent-up value sitting on the books of EM companies. Accounting, Governance and Legal conditions now exist to monetize this value.

It’s nice to see a fresh narrative that is no longer chasing growth for growth’s sake, especially when we have realized the hard way that the American version of growth is non-replicable worldwide.

The next step is to look at valuations embedded in Emerging Market stocks, comparing Growth versus Value in EM, and comparing EM valuations to DM/US valuations.

EM Stock Valuation in charts and narratives: 

Rakesh Bordia of Pzena: EM stocks today trade at a substantial (35%) discount to DM Valuations.

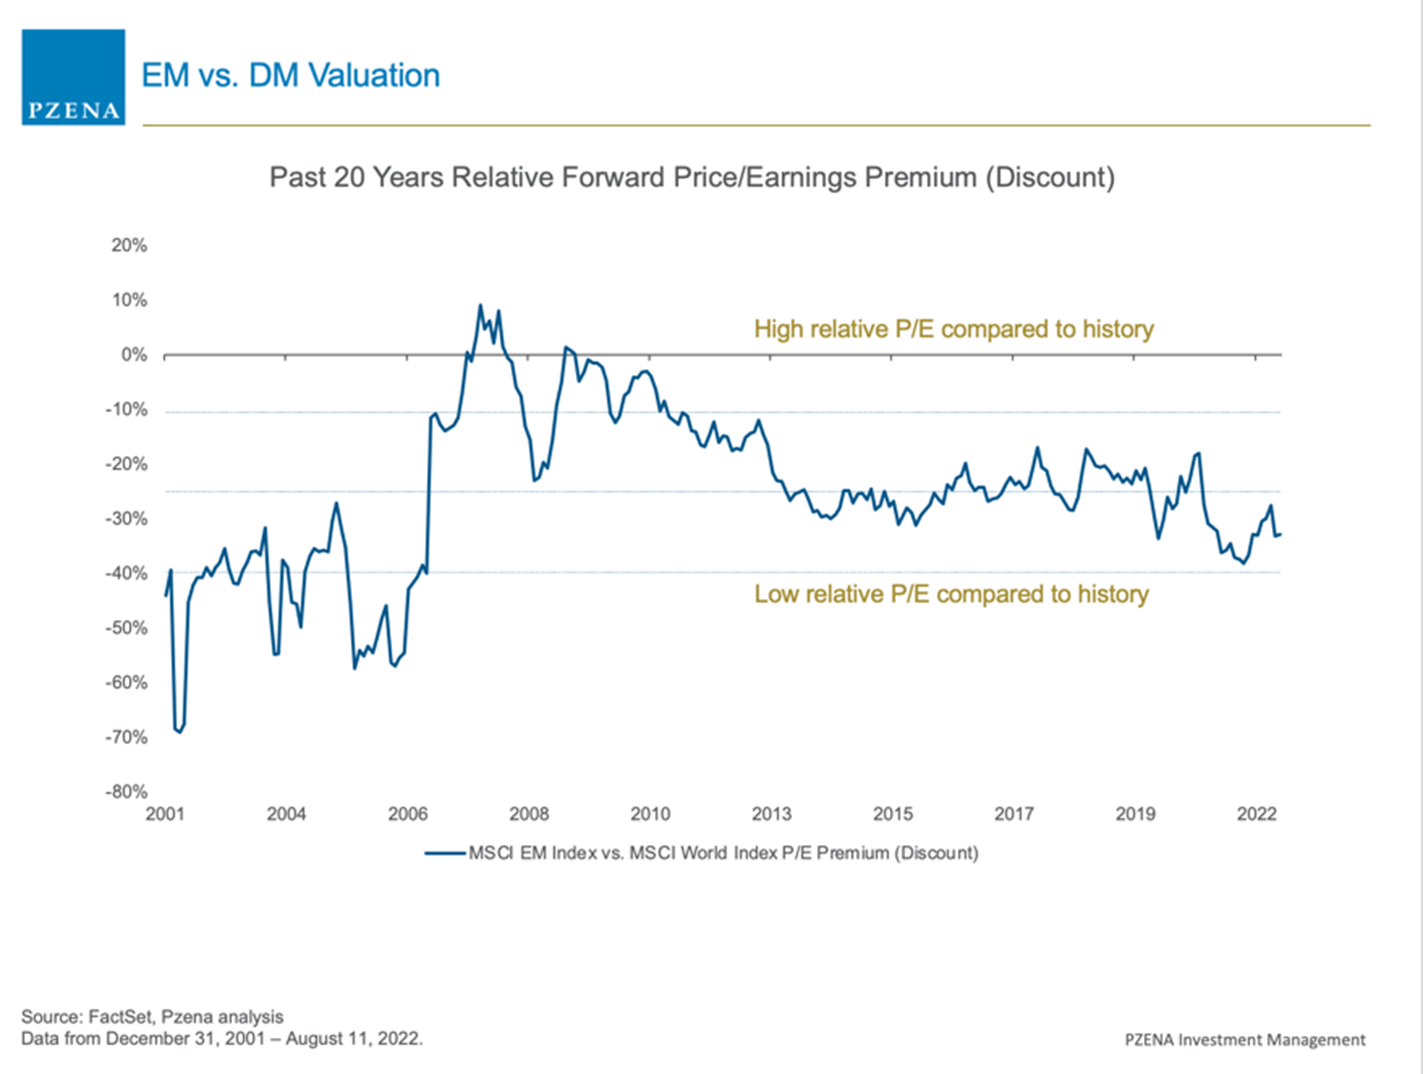
Investors have practically given up on EM. The Return on Equity (ROE) on EM shares has been about 12.5% since 1992 and is presently even higher, in the 14.5-15% zone.

Many high-quality value businesses are trading at 10-15% FCF yield with good ongoing business models. This compelling valuation starting point means that stock returns are obvious, but the timing is always unclear in our business. EM returns are very lumpy.

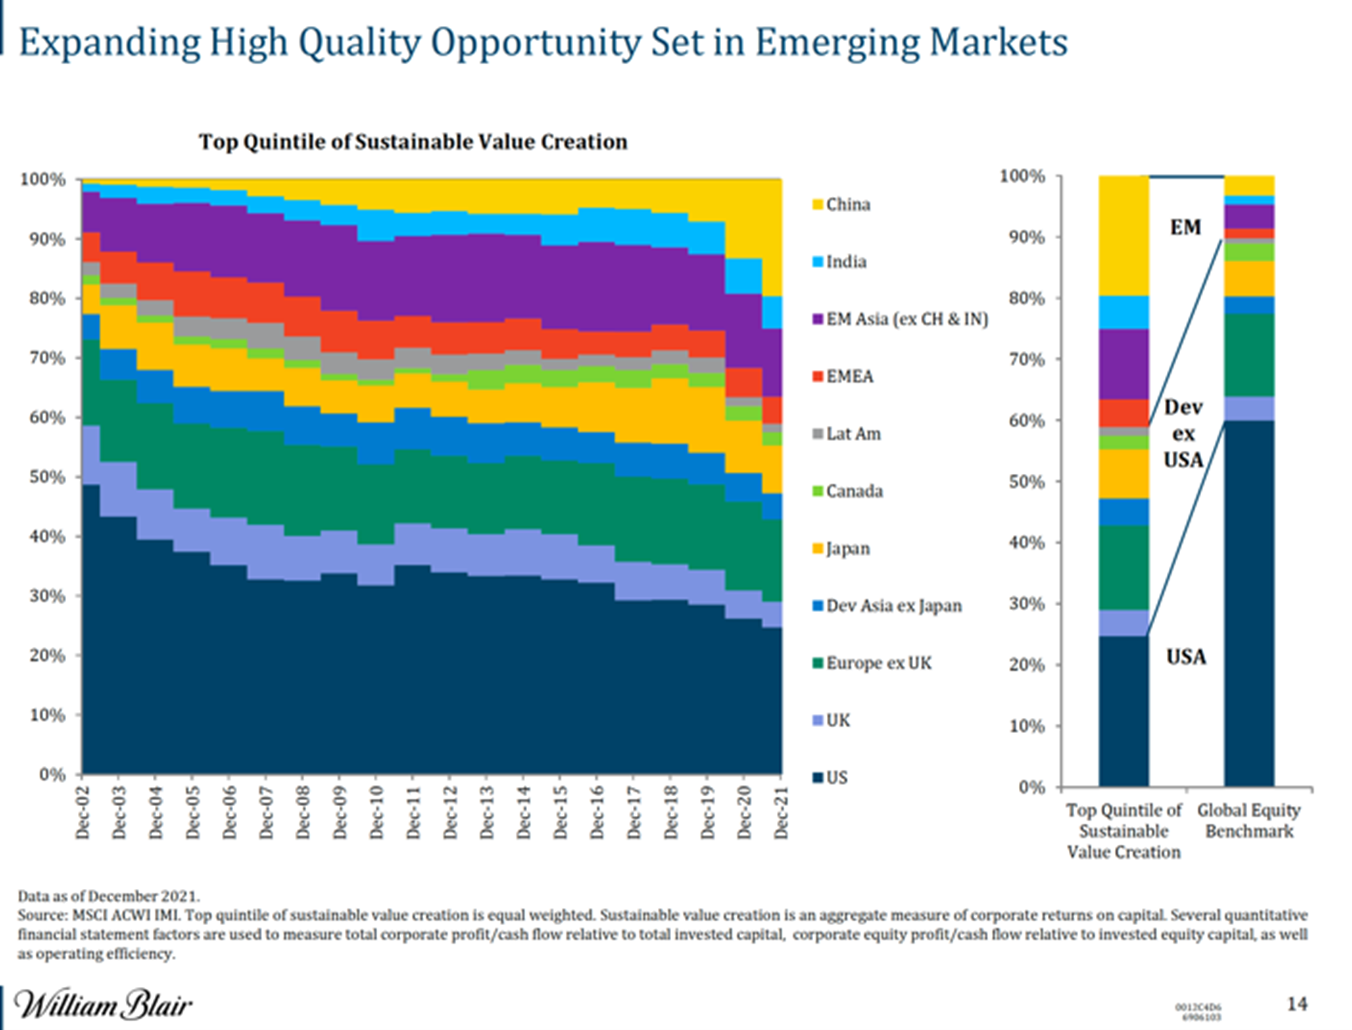
Todd McClone of William Blair: Using Return on Capital (ROC) as a metric and sorting the top 20% of those companies across the world markets – In 2002, only 15% of global companies were based in Emerging Markets. Today, 35% of those companies live in Emerging Markets. Our job is to find the EM leaders and get them on board.

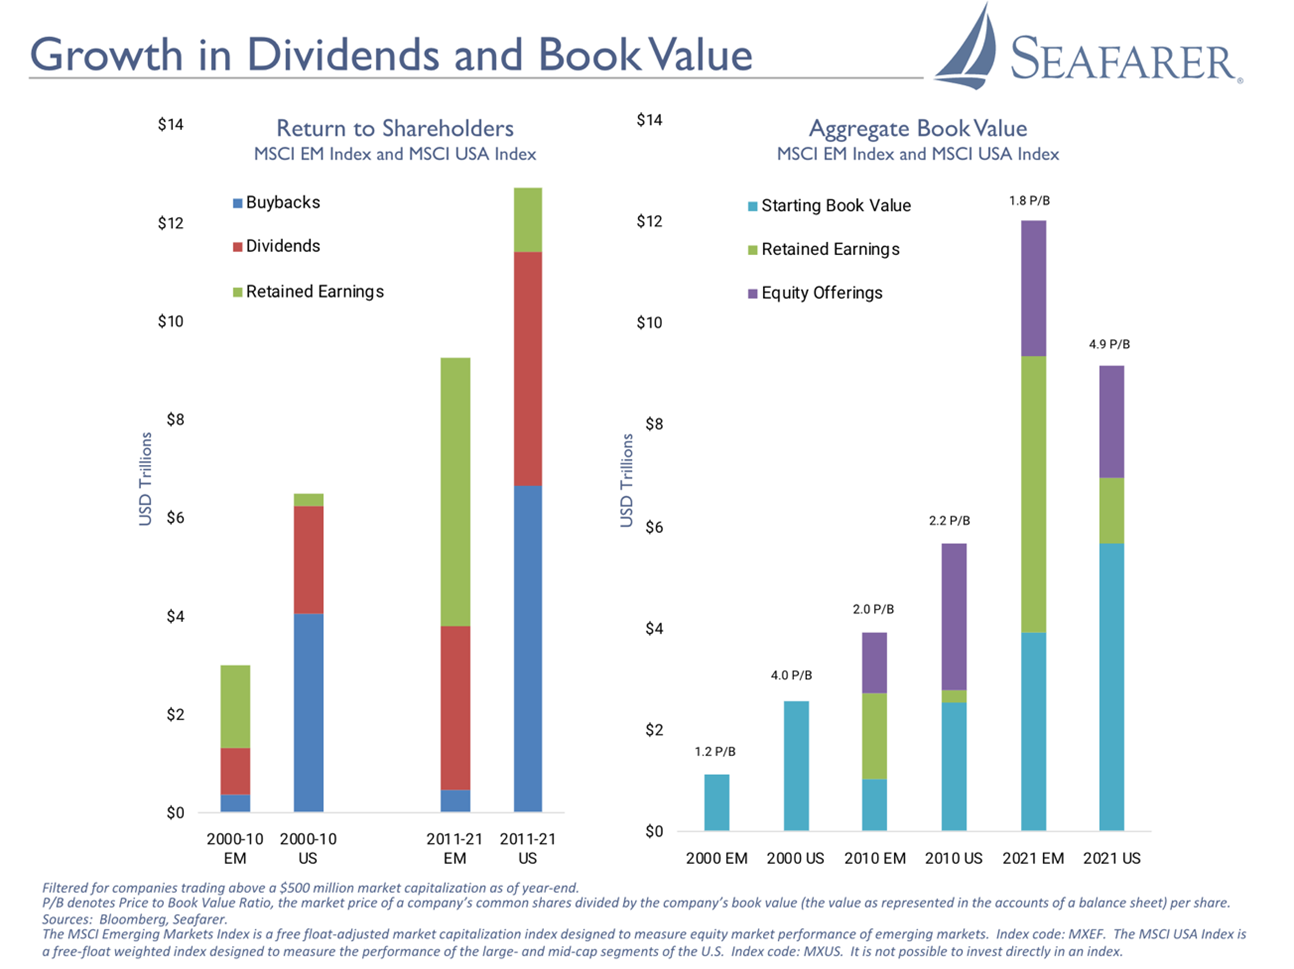
I found the next set of Charts from Seafarer on the growth in Book Value and P/B very insightful. Note that charts use 2021 data. Also, please note Seafarer’s disclosure at the bottom of this article.

* See the note on Seafarer disclosures at the end of this article.

Take time to process all the charts (especially this one above) slowly.

The chart on the left shows the evolutions of how profits were distributed and retained in 2 different decades in EM and in the US.

The first set of bars on the Left shows the progression of Earnings use in the 1st decade. EM stocks produced ~$3 Trillion of Earnings (profits) while US stocks earned ~$6T. Note the Blue bar – which stands for Buybacks, and the Red bar – which stands for Dividends paid.

EM companies’ buybacks and dividends to Shareholders were about 50% of the profits. The other half was saved up in Retained Earnings on the Balance Sheet – the Green bar.

US companies gave away 67% in Buybacks and dividends and retained 33% on their Books.

 The next set of bars reflect the 11-year period from 2011 to 2021. EM companies earned ~$9Trillion. EM stocks have almost no increase in Buybacks, but significant Dividends were paid. The total returned to Shareholders was about ~4T out of ~9T, or 44%, a lower number than the previous decade.

US companies meanwhile earned $13T in that period. $11T, or 85%, was returned to shareholders through Dividends and Buybacks.

Lesson: US companies are showering Shareholders with money while EM companies are being stingy with their purses. It’s not that EM doesn’t make money; EM companies don’t like to share profits! 

The chart on the right side shows the progression of Price To Book Values for EM and US stocks at 3 distinct points in time: the year 2000, 2010, and 2021.

Year 2000 2010 2021 end
~ MSCI EM Book Value ($Trillions) 1 4 12
~ MSCI US Book Value ($Trillions) 3 6 9

Did you notice that from 2010 to 2021, EM companies grew book value from $4T to $12T, while US companies went from $6T to $9T?

Because EM companies held on to Retained Earnings, there are now MORE BOOK VALUE EM stocks than in US stocks. This was a big surprise to me. What does Mr. Market think?

Book Value is an accounting concept. The Market Price of companies trades at a premium or discount to Book Value. We call this metric Price to Book or P/B. On top of each of these bars, you will see a number for P/B for each asset in each time window.

Time Window 2000 2010 2021 end
MSCI EM P/B 1.2 2.0 1.8
MSCI US P/B 4.0 2.2 4.9

I asked Seafarer for P/B estimates as of today. EM now trades at a P/B of less than 1.5x, and the US now trades at a P/B greater than 4x.

The lesson here is that US companies have rewarded shareholders, and shareholders have rewarded US companies by taking their Prices up.

IF, and it’s a big IF, EM companies started rewarding shareholders, and EM stocks could potentially trade at much higher valuations. Will EM companies pay shareholders?

Andrew Foster of Seafarer: The value is beginning to get realized. Notice how Alibaba and Tencent have initiated share buybacks. Also, keep an eye out on the Korean National Pension fund and if they start asking Samsung to pay more dividends going forward. In either case, I am agnostic about how the value gets monetized. One way or another, the Book Value is there, and the market will find its way to these stocks in EM version 2.0

Laura Geritz of Rondure: Today’s EM investor has many choices. If China doesn’t implode, it has one of the best quality and value companies. Opening (post-Covid) will lead to EPS growth, and stocks are cheap. Mexico is very interesting and a beneficiary of reshoring. It was ignored because it was not tech driven. If commodity prices stay balanced (not too low, not too high), that’s the ideal setup for EM stocks.

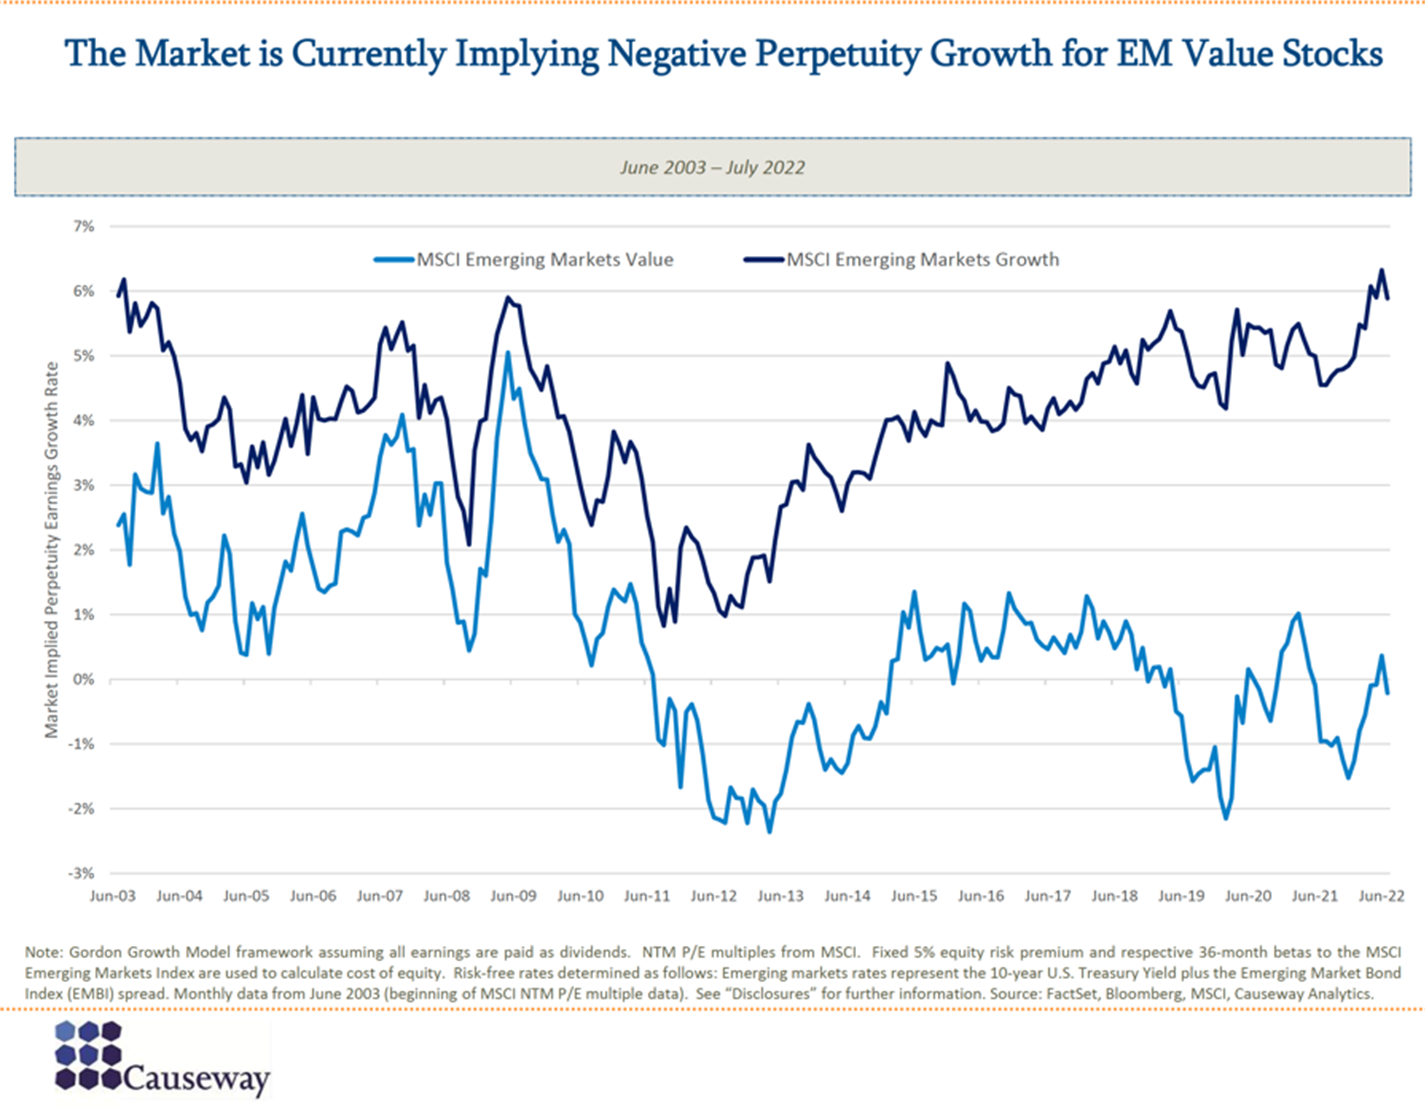
Arjun Jayaraman of Causeway: Now that the US is moving toward QT and rate increases, while a few countries are in the rate easing cycle (notably China and Brazil), the monetary policy equation tide is slowly turning in favor of EM equities. Once the Fed pivot arrives and the US$ peaks, EM has a much greater chance of outperforming. The orthodox monetary and fiscal policies that constrained EM stocks (compared to DM) might be the savior as EM stocks won’t have to deal with an unwinding of QE and negative real rates. Furthermore, we see the greatest opportunity in EM Value Stocks.

From the various charts, here is what stands out:

  1. EM companies know how to make money.
  2. But EM companies are not rewarding shareholders.
  3. The market is not rewarding EM company valuations.
  4. EM Value Stocks seem probably the cheapest of the stocks among all major asset classes.
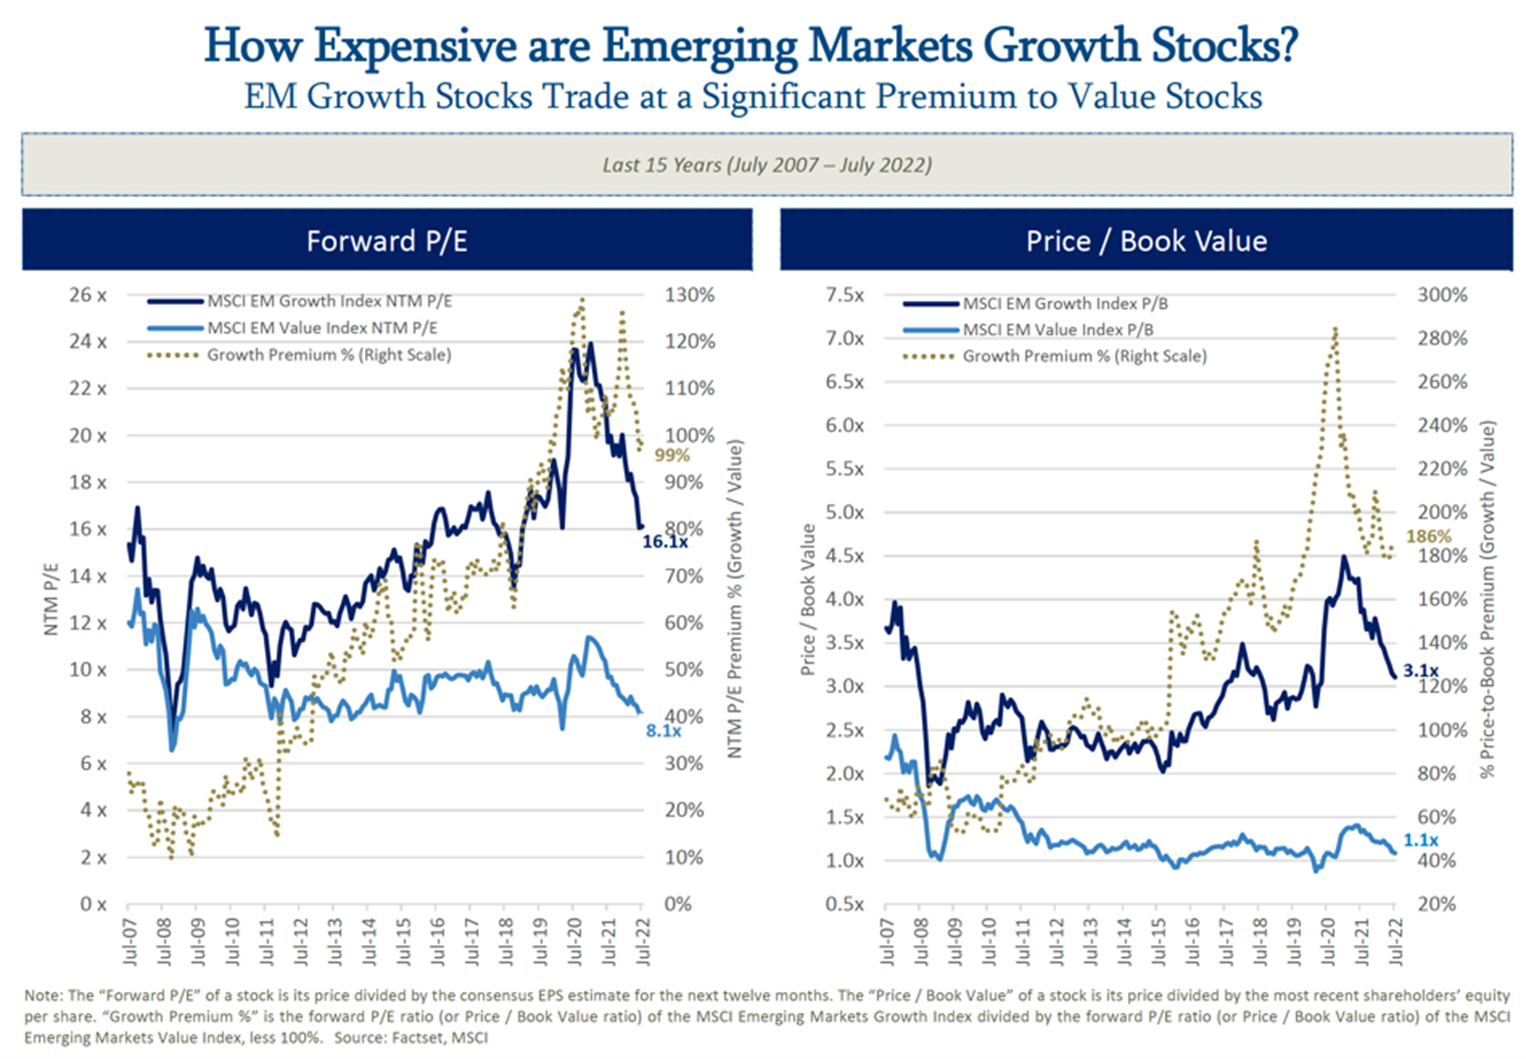
  5. EM Growth stocks exist and are less expensive than in the US but require investment skills to pick carefully.

Rakesh Bordia of Pzena: People panic in EM far more than in DM. These panic moments create value opportunities in those countries where a great asset might be hit along with everything else. We like to swoop in then accompanied with deep research, value analysis, and long-term holding periods.

What could go wrong? What do EM investors need to be able to do?

This is no time to be cavalier about taking Risks in the Markets. Even Balanced portfolios are down 16% this year. No one should be throwing caution to the wind.

I asked my wife, Radhika, to read this article, and she said, “Devesh, this is great stuff. But EM is risky for a host of reasons, no?”

Momma, having raised no stupid son, I was quick to tell my wife, “You are right.”

  1. General Risks

The risks of EM are: Breaking of the dollar hegemony and world monetary order, an invasion of Taiwan, inflation persistency, superpower wars, the end of globalization, weak institutional strength, etc., etc.

  1. Inflation and US $ Strength Risk

The biggest source of risk is that inflation is running hot everywhere. If estimates for UK inflation at 20% are true and Europe is running at 8% inflation, the Euro and the British Pound are in for a tough run. In such environments of Dollar strength, Emerging Market Currencies will face an equally tough time.

Emerging Markets depend on Export earnings. They will not allow their currencies to appreciate in times of Dollar strength against major currencies. US investors make money on the stocks, but they will lose money on the FX side.

  1. Absolute Returns vs Relative Returns

Investors need to eat absolute returns, not just relative returns compared to DM markets. It’s not enough that EM should outperform US stocks. They must deliver positive returns absolutely.

  1. Preferences vs Constraints

We should all study the geopolitical framework of Marco Papic in Geopolitical Alpha. South and North Korea have been living with each other not because they prefer it, but because neither can afford to blow the other up. China has seen what happened to Russia’s bank accounts and sanctions worldwide. We think we understand geopolitics, but Russia and the sanctions have shown us how little we know.

  1. What if the next decade continues like the last one?

Isn’t it possible that EM companies continue to hoard cash and not return money to shareholders? EM version 2.0 requires something to give. Hope is not a strategy. And we investors have to depend on fund managers to argue minority rights on our behalf.

The Bottom Line

EM assets are terribly exciting but complicated beasts. The discussions with EM fund managers, research, and reading have convinced me the opportunity set is truly promising, at least when compared to DM assets, maybe even on an absolute basis. Too many great EM companies are trading at low valuations.

Cheapness in securities is never a reason to go buy an asset. Cheapness does not guarantee returns. But cheap securities with good businesses, high ROE, and high FCF provide a risk floor today and a chance at strong returns tomorrow.

Make a list of EM assets to own. Take a look at your current EM allocations and where you might want them to be. Decide if Passive funds are good enough for you or if you want a manager to execute a nuanced version by actively picking stocks.

Even if it’s not immediate, even if the markets are scary, the opportunity is knocking. Let’s not twiddle thumbs and do nothing.


* Note on Seafarer Disclosures: The views and information discussed in this presentation are as of the date of publication, are subject to change, and may not reflect Seafarer Capital Partners’ current views.  The views expressed represent an assessment of market conditions at a specific point in time, are opinions only, and should not be relied upon as investment advice regarding a particular investment or markets in general.  Such information does not constitute a recommendation to buy or sell specific securities or investment vehicles.  It should not be assumed that any investment will be profitable or will equal the performance of the portfolios or any securities or any sectors mentioned herein.  The subject matter contained herein has been derived from several sources believed to be reliable and accurate at the time of compilation.  Seafarer does not accept any liability for losses, either direct or consequential, caused by the use of this information.


Briefly Noted . . .

By TheShadow

Fallen angels: “The Securities and Exchange Commission today charged Atlanta-based Angel Oak Capital Advisors, LLC and its portfolio manager Ashish Negandhi for misleading investors about the firm’s fix-and-flip loan securitization’s delinquency rates. Angel Oak and Negandhi have agreed to settle charges and pay a penalty of $1.75 million and $75,000, respectively” (sec.gov, 8/10/22). Angel Oak advises a series of mutual funds whose activities, so far as we can tell, are completely unaffected by the SEC action. That said, it’s not a good look.

An initial registration filing has been filed for the Harbor Health Care ETF. The fund intends to invest in companies principally engaged in the research, development, production, or distribution of products and services related to the healthcare industry. No expenses have been stated at this time.  The portfolio managers will be William A. Muggia and Matthew R. Renna.

David Marcus, the CEO of Evermore Global Advisors and manager of the two-star Evermore Global Value Fund (EVGBX), has opened a “family office” on behalf of the family of Michael Price. Mr. Price was Mr. Marcus’s mentor from their years together at the Mutual Series funds (later bought by Franklin Templeton), where Mr. Price practiced, and Mr. Marcus studied “special situations” investing. That often translated to pursuing investment related to opportunities too unusual or too complex for most investors to contemplate. Mr. Price died in March 2022 at the age of 70. Mr. Marcus’s fund has been spectacularly independent of the market (which is good) but not consistently rewarding.

Bill Nygren will focus more on domestic investing with the Oakmark Select and Oakmark Funds and cease managing the Oakmark Global Select Fund effective the end of 2023. As a result of the change, the Oakmark Global Select Fund will get two new co-managers: Colin Hudson and John Sitarz. Robert Bierig will be added as a co-portfolio manager to the Oakmark Fund with Bill Nygren and Michael Nicolas.

Robert Bierig and Alex Fitch will become co-portfolio managers of the Oakmark Select Fund alongside Bill Nygren and Tony Coniaris.

Effective December 31, 2023, Clyde McGregor will be transitioning his portfolio management duties and stepping off the Oakmark Equity and Income Fund and the Oakmark Global Fund. Mr. McGregor will remain with Harris Associates as an investment leader and portfolio manager for the firm’s private wealth management business

The Tocqueville Opportunity and The Tocqueville Phoenix Funds will be reorganized into the Tocqueville Fund. The reorganization is expected to occur on or about November 18. Robert W. Kleinschmidt will remain as the portfolio manager of the Tocqueville Fund.

Several Touchstone Strategic Trust Funds will be undergoing a reverse stock split in October 2022. The “C share class” of the following funds: Touchstone Growth Opportunities, Touchstone Mid Cap Growth, Touchstone Non-US ESG Equity, Touchstone Small Company, and Touchstone Sands Capital Select Growth. The reason for the reverse stock split was due to better alignment with the NAVs of the fund’s other share classes.

A registration filing has been filed for the Vanguard Global Environmental Opportunities Stock Fund. Total annual operating expenses will be .75% for the investor class shares; admiral class will be .60%. The fund will invest in a global portfolio of stocks of companies located in a number of countries throughout the world, including developed and emerging markets. The portfolio managers will be Deirdre Cooper and Graeme Baker.

SMALL WINS FOR INVESTORS

The SEC is starting to make some potentially useful moves in the direction of reining-in “greenwashing” to strengthen whistleblower protections and requiring better climate impact disclosures by corporations. All good, give or take the details. Otherwise, a quiet month on the Good News front!

Old Wine, New Bottles

361 Domestic Long/Short Equity and 361 Global Long/Short Equity Funds will be reorganized into corresponding funds of the Allspring Funds Trust (part of the Wells Fargo family). Each of the corresponding Allspring Funds will have a substantially similar investment objective, investment strategy, and fundamental investment restrictions as its corresponding 361 fund.

Bridgeway Associates has proposed converting their billion-dollar, three-star Omni Tax-Managed Small-Cap Value Fund in an ETF, EA Bridgeway Omni Small-Cap Value ETF. The conversion will entail “the transfer of all of the property, assets, and goodwill” of the fund sometime early in 2023. (The Bridgeway Funds are divided into four Select Funds, which are managed with a strategy based on multi-factor diversification, and four Omni Funds which offer broad diversification within a specific segment, although only two actually bear that name.)

Effective September 23, 2022, the small-cap Empiric 2500 Fund becomes the small-cap Empiric Fund. It switches benchmarks from the Bloomberg 2500 Index to the MSCI USA Small Cap Index.

Great Lakes Funds is reorganizing three of its funds on or about December 10, 2022: Great Lakes Disciplined Equity Fund into the Cambiar Opportunity Fund, Great Lakes Large Cap Value Fund into the Cambiar Opportunity Fund, and Great Lakes Small Cap Opportunity Fund into the Cambiar Small Cap Fund.

Great Lakes has previously reorganized its Great Lake Bond Fund with Weitz Core Plus Income Fund in July 2021.

Several Inspire Funds will change their name, effective August 22, removing the ESG:  

Inspire Global Hope ESG ETF to Inspire Global Hope ETF;
Inspire Small/Mid Cap ESG ETF to Inspire Small/Mid Cap ETF;
Inspire Corporate Bond ESG ETF to Inspire Corporate Bond ETF;
Inspire 100 ESG ETF to Inspire 100 ETF;
Inspire International ESG ETF to Inspire International ETF, and
Inspire Tactical Balanced ESG ETF to Inspire Tactical Balanced ETF.

The Board of Trustees has approved changes to the Fund’s name, objectives, strategies, and benchmark to the Janus Henderson Dividend & Income Builder Fund.  The new name will be the Janus Henderson International Dividend Fund seeking income for the potential for capital growth. These changes will take place on or about October 28, 2022.

Nuveen International Growth Fund is being reorganized into the TIAA-CREF International Opportunities Fund.  Voting on the reorganization is expected to be held in early October 2022, with the reorganization expected to occur approximately 15-30 days after the special shareholder meeting.

On October 24, 2022, the passive WisdomTree CBOE S&P 500 PutWrite Strategy Fund becomes the equally passive WisdomTree PutWrite Strategy Fund, tracking a new index.

CLOSINGS (AND RELATED INCONVENIENCES)

AdvisorShares North Square McKee ESG Core Bond ETF will be liquidated on or about September 7.

The American Beacon Bahl & Gaynor Small Cap Growth Fund will liquidate on or about October 14, 2022.

BNY Mellon Tax Sensitive Total Return Bond Fund will be liquidated on or about November 17.

Champlain Emerging Markets Fund will be liquidated on or about September 23, 2022.

Defiance Next Gen SPAC Derived ETF and Defiance Next Gen Altered Experience ETF were liquidated on or about August 30.

A whole series of Direxion ETFs, some modestly silly and others just very badly out-of-step with the market, hence unattractive to fickle investors, will be liquidated on September 23, 2022.

Direxion Daily Cloud Computing Bear 2X Shares (CLDS)
Direxion Daily 5G Communications Bull 2X Shares (TENG)
Direxion Russell 1000® Growth Over Value ETF (RWGV)
Direxion Russell 1000® Value Over Growth ETF (RWVG)
Direxion World Without Waste ETF (WWOW)
Direxion Fallen Knives ETF (NIFE)
Direxion Low Priced Stock ETF (LOPX)

DriveWealth Power Saver and DriveWealth Steady Saver ETFs were liquidated on or about August 31.

John Hancock Absolute Return Currency Fund will undergo a change in which its subadvisor is being acquired.  The transaction is expected in the fourth quarter of 2022. In order to understand the potential impact of the transaction, the fund will be closed to new investors as of September 6, 2022.

JPMorgan U.S. Dividend and U.S. Minimum Volatility ETFs will be liquidated on or about September 14.

JPMorgan Macro Opportunities Fund will be liquidated on or about October 13.

Premise Capital Diversified Tactical ETF will be liquidated on or about September 7

Tactical Moderate Allocation Fund will be liquidated on or about September 16.