


I have no idea what the best investment of 2023 will be, and neither does anyone else. The annual exercise in futility and fantasy is well underway in the financial press and market pundit community, notwithstanding the fact that their 2022 forecasts were laughably wrong, as were their 2021, 2020, 2019 …
Section 1, The Terrified Investor
Section 2, The Exhausted Investor
Section 3, The Enterprising Investor
The Terrified Investor
If you’re obsessed about 2023, our best advice is (a) minimize your exposure to the stock market and (b) invest regularly and vigorously in short- and ultra-short bond funds. That offers the best prospect of a return of principal, if not astonishing returns on principle.
Best Short-Term and Ultra-short Term Bond Funds
Great Owl funds with the smallest drawdowns for the five-year from 1/2018-12/2022
| APR | Maximum drawdown | Standard deviation | Sharpe ratio | |
| RiverPark Short Term High Yield | 2.13% | 1.09% | 1.07 | 0.81 |
| Baird Ultra-Short Bond | 1.51 | 0.92 | 0.78 | 0.30 |
| BlackRock Ultra Short-Term Bond ETF | 1.65 | 0.85 | 0.77 | 0.50 |
| Ultra short average | 1.19 | 2.34 | 1.37 | -0.10 |
Source: MFO Premium fund screener
The Exhausted Investor
If you’re really tired of making these calls for yourself, or you’re unimpressed with the adviser who’s been making them for you, you have two options for simplifying your life.
Option 1: invest in a best-of-class target date fund
The target-date funds are simple creatures: they announce in advance what allocation between asset classes they intend to make and how those allocations will change over time. All target-date funds have a strategic allocation (“10 years before the target date, we’ll be 55% US stocks, 20% international stocks, and 25% bond”), while many also have a tactical allocation (a bit of room for the managers to exercise judgment: “we’ll be 55% US stocks give or take 2.5% with the option of tilting a bit toward value or small or …”).
A chunk of my retirement portfolio sits in the T. Rowe Price Retirement funds, the more aggressive of their two target-date series. Morningstar rates it as a four-star Gold fund. It’s one of only two Great Owl funds in the category, which are defined as funds with risk-adjusted performance in the top 20% of their group for the past 3-, 5-, 10- and 20-year periods. The other is Mutual of America 2030 which is primarily available through retirement plans.
Best Target-date 2030 Fund
Great Owl funds for the five-year from 1/2018-12/2022
| APR | Maximum drawdown | Standard deviation | Sharpe ratio | |
| T Rowe Price Retirement 2030 | 4.4% | 22.1% | 14.2% | 0.22 |
| 203o group average | 3.3 | 21.1 | 12.7 | 0.15 |
Source: MFO Premium fund screener
Option 2: invest in a best-of-class flexible allocation fund
Flexible allocation funds give their managers wide latitude to select both their allocation to stocks, bonds, and cash and also latitude in selecting which stocks or bonds. The idea is that if you’re going to pay for active management (a prospect that my colleague Devesh finds mostly suspect), then pay for really active management. The worst “active” managers have index-like portfolios but charge exorbitant fees. The best have a clear discipline, a long track record, and reasonable fees.
They are few and far between.
Since the value of a flexible fund is that it allows you to surrender long-term decisions, we screened for the funds with the best really long-term performance: funds that have weathered everything from the dot-com bubble to the Covid crash. There are no Great Owl funds in this group, which highlights the fact that even the best long-term strategies have fallow periods. The list below contains the flexible funds with the highest 25-year Sharpe ratios. We’ve included a pure equity index, the Vanguard Total Stock Market, for comparison. You’ll note that the top five funds have posted gains comparable to, or above, the stock market with distinctly lower volatility.
Best Flexible Portfolio Funds
Highest Sharpe ratio FP funds for the 25 years from 1/2018-12/2022
| APR | Maximum drawdown | Standard deviation | Sharpe ratio | |
| Bruce | 11.0% | -40.3 | 12.6 | 0.74 |
| First Eagle Global | 9.1 | -32.6 | 11.3 | 0.65 |
| FPA Crescent | 7.9 | -28.8 | 11.6 | 0.53 |
| Leuthold Core | 7.4 | -36.5 | 10.7 | 0.52 |
| BlackRock Global Allocation | 7.3 | -29.4 | 10.8 | 0.51 |
| Flexible portfolio average | 6.1 | -37.4 | 11.5 | 0.38 |
| Total stock market average | 7.6 | -50.9 | 16.2 | 0.36 |
Source: MFO Premium fund screener
The Enterprising Investor, or portfolio positioning for active, long-term investors
If you’re looking to reposition your portfolio for the long term – knowing that the changes might or might not blow up in the short term (since no one has a clue about what 2023 will bring) and if you believe that the price of an investment strongly influences your eventual gains, then there are three tilts to consider for the next market. We’ll start with the essential background to the past and coming markets, then introduce the tilts.
Distortions from the zero-rate environment
The zero-interest-rate markets that have persisted since the Great Financial Crisis in 2008 have produced dramatic movements in the stock market and even more dramatic price dislocations. Free money favors some investments far more than others: large firms with easy access to capital markets could buy growth using free money – sometimes paying less than zero to borrow once inflation was factored in – and use that growth to generate headlines and momentum. But it also depended on continued access to free money to support its empire of cards.
In a 2019 interview, Rupal Bhansali, manager of Ariel Global, warned that “a market that’s been on steroids is now on opioids which, I believe, cannot end well.”
As money flowed to FAANGs or tech or momentum, it simultaneously flowed away from areas that are now tremendously undervalued by historical standards. Investors might want to ask whether it’s time to tilt in their direction.
Projections for a normal-rate environment
Very large long-term investors need to have a clear sense of what’s worth buying and what’s grievously overpriced. Those calculations allow them to construct long-term allocations for their major clients. While they’re not reliable sources of actual returns (that is, Fidelity’s “it’ll be 3%” actually means something like “our computer models say we have a 65% probability of stock returns between -1.0% and +5.00% with a mean value of 3%”), they’re often pretty good at signaling relative asset class performance. That is, whether domestic or international is positioned to lead by a little or a lot, and so on.
As an overview, here are the capital market assumptions used by large US investment firms for the period through 2033.
Projected 10-year asset class returns through 2033
| US equity | International equity | Emerging equity | US bonds | Commodities | |
| BlackRock | 8.8% | 11.5 | 11.8 | 4.2 | |
| BNY Mellon | 5.9 | 5.8 | 7.6 | 1.2 | 3.0 |
| Callan | 6.6 | 6.8 | 6.9 | 1.75 | 2.5 |
| Fidelity | 3.0 | 3.7 | 5.1 | 1.9 | 2.1 |
| Invesco | 9.3 | 9.2 | 12.4 | 4.5 | 10.9 |
| JPMorgan | 7.8 | 8.9 | |||
| Research Affiliates | 1.8 | 7.7 | 8.6 | 0.9 | 0.7 |
| Schroders | 8.4 | 7.9 | 11.3 | 4.4 | 4.6 |
| Vanguard | 4.4 | 7.1 | – | 3.5 | – |
| Voya | 6.8 | 7.3 | – | 4.0 | – |
| Mean | 5.38 | 7.48 | 9.08 | 2.93 | 3.97 |
It’s not guaranteed that the numbers between firms are perfectly comparable because not all firms specify whether their estimates are real (inflation-adjusted) or nominal. Regardless, asset class differences within each firm’s row will be comparable; that is, if Schroders projects stocks leading bonds by 400 bps, it doesn’t matter whether that’s based on real or nominal estimates.
Short version: Commodities over bonds. International over the US. Emerging over international. And, as we’ll see below, small over large, emerging over developed, value over growth.
Small cap stocks
And, particularly, small-cap value.
Morningstar’s Lauren Solberg noted in December 2022 that “For smaller-company stocks, price/earnings ratios—a widely used measure for determining the value of a stock relative to its earnings—have reached their lowest levels in two decades.” The difference in P/E ratios between small-cap and large-cap stocks – 12.6 versus 20.2 – is the greatest since 2002. (Small Cap Stocks are Really Cheap, Lauren Solberg, 12/2/2022) The almost permanently skeptical GMO allows that “small-cap stocks have become notably cheap,” and RBC’s Lori Calvasina says that at current levels, small-cap stocks are already priced at valuations that would account for “the worst that you’d expect to see in the middle of a recession.”
Virtually all of the major management firms anticipate a decade of small-cap outperformance though the magnitude of the projected differences is huge. At the low end, Callan anticipates US small to outperform US large by 20 basis points (bps); BNY Mellon gives small caps at 100 bps, while Invesco and Research Affiliates both put the small cap advantage in the 300 bps area. Bank of America estimates the gap at 400 bps.
Given that small caps are always more volatile than large caps, we searched out the funds with the best long-term risk-adjusted returns.
Best Small Cap Stock Funds
Great Owl funds with the smallest drawdowns for the 20 years from 1/2003-12/2022
| APR | Maximum drawdown | Standard deviation | Sharpe ratio | |
| FMI Common Stock | 10.5 | -42.6 | 16.1 | 0.58 |
| Meridian Contrarian | 10.1 | -44.01 | 17.0 | 0.52 |
| Kinetics Small Cap Opportunities | 14.3 | -67.1 | 22.9 | 0.57 |
| FPA Queens Road Small Cap Value | 9.5 | -43.1 | 15.0 | 0.55 |
Source: MFO Premium fund screener
There are three other funds that we’ve written extensively about that deserve special attention.
The Last True Believers
Palm Valley Capital (PVCMX) is an absolute-value small-cap fund that is managed by Eric Cinnamond and Jayme Wiggins. Nominally the fund is four years old, which is wildly misleading. Mr. Cinnamond and, most recently, Mr. Wiggins have successfully pursued this strategy in four distinct mutual funds for a quarter century. The core distinction is this: the managers only buy stocks that are trading at a truly substantial discount to their fair value. If there are no appropriately priced opportunities, they invest the portfolio in cash and cash-like securities. That makes them incredibly frustrating to own when markets are soaring and they’re steadily unloading overpriced portfolio holdings in favor of cash. Indeed, Mr. Cinnamond liquidated one fund because he felt it unfair to charge investors for equity investments when only cash made sense.
The new fund is a five-star Great Owl that returned 3.2% in 2022, while its average peer lost 9.8%. That’s especially striking because the portfolio is still only 19% investing in stocks, mostly small- to micro-cap value stocks.
Disclosure: I’ve owned PVCMX since launch, and before that, I owned shares of two of the team’s earlier funds.
The Anti-momentum Index
Index Funds S&P 500 Equal Weight (INDEX) aspires to beat the index with the index. The S&P 500 index weights its holdings by each stock’s market cap; the fund’s top five holdings – Apple, Microsoft, Amazon, Google (two share classes), and Berkshire Hathaway – consume 19.5% of its portfolio. That gives the index strong biases toward size, growth, and momentum, which are sometimes profitable and sometimes not. INDEX takes a different approach and equally weights the same 500 stocks. That gives it a bias toward smaller, cheaper and steadier. They capture the advantages of passive investing, have the prospect of outperforming the S&P 500 in the long run (since 2003, the equal weight has a substantial lead on the cap-weighted version), and free themselves from dependence on big tech.
Through a thoughtful trading strategy, INDEX tends to modestly outperform its large competitor (RSP) in the long term.
Beating the index with the INDEX
Performance since INDEX inception, 4/30/2005
| APR | Maximum drawdown | Standard deviation | Sharpe ratio | |
| S&P 500 Equal Weight | 9.24 | -26.5 | 17.4 | 0.47 |
| Multicap core peer group | 7.9 | -25.3 | 16.6 | 042 |
| S&P 500 | 11.3 | 23.9 | 15.9 | 0.65 |
Source: MFO Premium fund screener
The World At Your Fingertips
Harbor International Small Cap (HIISX) was reborn several years ago when the team from Cedar Street Asset Management assumed control. The managers target high-quality, undervalued small-cap stocks … and they do so brilliantly.
As we noted in our August 2022 profile of the fund: “Harbor is the best international small-cap fund around. The immediately meaningful metric here is the fund’s three-year record since the current team – which itself has a solid record for longer than three years – assumed responsibility for the fund … we examined the records of all international small-cap value and core mutual funds and ETFs. In both absolute and risk-adjusted metrics, Harbor is the top-performing fund.”
36-month record (through August 2022), international small-to-mid value
| Total return | Sharpe | Martin | Capture ratio | Alpha | |
| Harbor | 7.9% – #1 | 0.35 – #1 | 0.72 – #1 | 1.2 – #1 | 4.0 – #1 |
| ISCV peer ave. | 3.2 | 0.12 | 0.25 | 1.0 | -0.7 |
The Return of the Old Ways
We noticed one intriguing new fund that was slated to launch on the last day of 2022. Hunter Small Cap Value Fund is a small cap value fund run by a bunch of guys named Perkins. The fund will typically hold 30-60 small-value stocks, at least 90% of which will be domestic. For those with a long memory, Perkins was a premier small-cap value investor that was purchased by Janus, a firm not renowned for its commitment to value investing. The senior Messrs. Perkins – Tom and Bob – retired from the firm in 2018, which subsequently rebranded the funds twice. Somewhere in 2020, the younger Mr. Perkins departed as well and founded Hunter Perkins Capital Management. The new fund will be managed by all three.
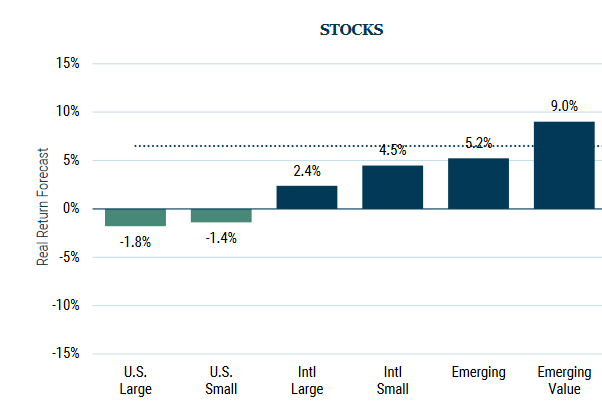
Emerging markets stocks
And, particularly, emerging markets value.
After years of being neglected because of free money available in the developed markets and geopolitical instability, essentially every major professional investor has made the same two observations: EM economies are far stronger than ever (representing 45% of global GDP), and EM stock valuations are far lower, setting them up for a period of extended outperformance albeit with higher volatility. GMO’s November 2022 asset class projections for the next 5-7 years are pretty typical:
In general, value tends to outperform in rising-rate environments. David Dali, head of portfolio strategy at Matthews:
Since 1995, there have been five Federal Reserve interest rate-hiking cycles and they have all had several things in common . . .the US dollar tends to outperform both developed and emerging market currencies, and cyclical, value-oriented stocks tend to outperform growth-skewed companies. (Five reasons, 11/28/2022)
Market conditions today–with rising inflation being driven in part by higher commodities prices–have added support to many emerging markets, and not just in Asia, some of which have smaller benchmark or no benchmark representation.
Looking back 20 years, there have only been five end-of-quarter instances when the MSCI Emerging Markets Equity Index has registered a price-to-earnings (P/E) multiple of 10 times or less. The September quarter-end was one of them, with a P/E of 9.96 times. Of the prior four instances, the median index total return for the subsequent one year was 19.03% and for the subsequent two years it was 31.47%. And in all the prior cases, the five-year total returns were positive.
Best Emerging Markets Stock Funds
Great Owl funds for the ten years from 1/2013-12/2022
| APR | Maximum drawdown | Standard deviation | Sharpe ratio | |
| Matthews EM Small Companies | 6.7 | -26.0 | 16.3 | 0.36 |
| Driehaus EM Small Cap Growth | 4.5 | -26.9 | 15.2 | 0.25 |
| First Trust EM Small Cap | 5.2 | -40.7 | 20.4 | 0.22 |
| Fidelity EM Discovery | 3.4 | -35.3 | 16.3 | 0.16 |
| EM peer group | 0.5 | -41.6 | 18.4 | 0.02 |
Source: MFO Premium fund screener
There are three other funds that deserve special attention.
Seafarer Overseas Value (SFVLX) is a $70 million, five-star, Silver-rated Great Owl fund backed by Seafarer Partners who’ve always struck us as the most sensible players in the game. In our Elevator Talk with lead manager Paul Espinosa, we got a sense of his values:
I’m managing this fund for the reader you talked about, the guy who manages a diner in Montana and who’s thinking about his retirement and his family’s security. This is the core, my personal crusade, for why I want to lead this fund. Government and central bank policies penalize thrift; they’re trying to encourage price inflation through low interest rates, but this means purchasing power is declining, and many of us are having trouble retiring with dignity. What I’m truly truly trying to do here is to increase the purchasing power of a saver.
The vogue today is for relative return investing. It asks, “how did you do relative to a benchmark,” not “has your manager been helping you meet your goals?” I think of myself as a sort of absolute return investor; we’re benchmark-agnostic, our aim is to produce a minimum rate of return that allows our investors to increase their purchasing power.
His performance speaks for itself. The fund was by far the best-performing EM fund of 2022, losing less than 1% in value while its peers were trimmed by 21% on average.
Seafarer Value since inception (5/2016-12/2022)
| APR | Maximum drawdown | Standard deviation | Sharpe ratio | |
| Seafarer Value | 6.2 | -27.1 | 14.6 | 0.35 |
| Int’l small value peer group | 4.0 | -33.9 | 17.0 | 0.13 |
| EM index | 4.4 | -36.7 | 17.3 | 0.19 |
Source: MFO Premium fund screener
Disclosure: I’ve owned Seafarer Growth & Income, Value’s older sibling, since launch, and before that, I owned shares of Andrew Foster’s earlier fund. Of special interest is the fact that Lydia So, who managed Matthews EM Small Companies to absolutely peer-tromped performance, has now joined the Seafarer Partners.
Much has been made of the problems posed by the Chinese regime as President Xi pursues a fundamental power grab that carries enormous risk. In consequence, several well-respected firms have just launched, or are just about to launch, funds designed to invest in emerging markets but not in China. Those include:
Matthews Emerging Markets ex China Active ETF, launching later this month, has the opportunity to invest in “every country in the world except the United States, Australia, Canada, Hong Kong, Israel, Japan, New Zealand, Singapore and most of the countries in Western Europe” and, of course, China. The fund will be managed by John Paul Lech and Alex Zarechnak, who are also responsible for Matthews Emerging Markets Equity Fund, which holds a 10% China stake against its peers’ average of 26%. Since its launch in April 2020, that fund is up 27%, while its peers and index are up about 11%. More recently, they’ve run the ETF version of the strategy.
BlackRock Emerging Markets ex-China Fund will fish in the same waters. It’s led by Chris Colunga, who manages BlackRock’s Emerging Europe fund, which is available only to non-US investors.
Value stocks
And, particularly, deep value.
It’s well known that value has lagged growth for a decade, driven by the inevitable consequences of a zero-rate / zero-inflation environment. That market has now expired, leaving value stocks trading at epic discounts to their own historical averages.
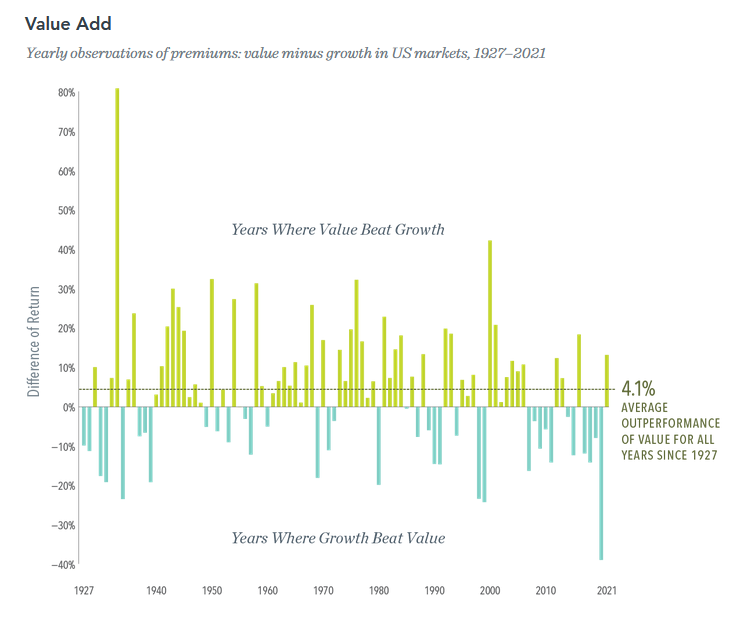
2022 saw a dramatic reversal. The Vanguard Value Index (VIVAX) dropped 2.5%, while its sibling Vanguard Growth Index (VIGRX) fell 34%. Their Small Cap Value Index Fund (VISVX) dropped 9.5%, while the Small Cap Growth Index Fund (VISGX) fell 29%. Value and growth tend to trade off market leadership, with one style easily capable of besting the other for five years or more. The chart below, from Dimensional Advisers, shows value outperformance both in the aggregate (about 400 bps since 1927) and annually (the yellow bars). In particular, you might note the pattern of the high inflation period of the 1970s and early 1980s.
The question is whether the recent outperformance by value is a head fake or the beginning of a period of extended dominance. GMO is clearly in the latter camp, arguing that growth stocks are still ridiculously expensive by historical standards (after the 2022 bloodbath, they still sport valuations higher than they have 88% of the time over the last half century) and value stocks are still ridiculously cheap by those same standards (lower than they’ve been 89% of the time).
The same pattern extends to the European markets (in the bottom 4% of their historical range) and the emerging markets (bottom 10%).
The problem is that not all parts of the “value” market are equally attractive. GMO breaks the market into “shallow value” and “deep value” cohorts. Because the whole US market remains expensive by historical standards, stocks barely into the cheapest half of an overpriced market are no bargain at all. The cheapest 20% of the market is incredibly cheap: the deep value stocks are in the lowest 8% of their historic range, and the shallow value stocks just above them are in the 86% of their range. What does that mean? In order for both sets to regress to the 50th percentile – that is, to be priced in a purely ordinary manner – the deep-value stocks would need to grow by 600%, and the shallow-value stocks would need to decline by 42%. “A value strategy in the US,” they suggest, “should be avoiding the ‘shallow value’ stocks that are mildly cheap relative to the market and focusing solely on the ‘deep value’ quintile.” By their estimation, the deep value might outperform the shallow value by 400 bps, and even the shallow value will outperform growth.
Most stocks that are deeply discounted have earned those discounts. They represent the securities of fundamentally flawed, mismanaged firms that consistently lose money; they are The Zombies. Because deep value stocks have been the worst possible niche in the market – “Deep value stocks were both the worst performing cohort from 2007-2020 and the group that didn’t have particularly obvious compelling attractions beyond their cheapness” (GMO) – every deep value fund has a miserable trailing record.
Funds with deep-value portfolios
| Portfolio | 2022 returns | |
| Aegis Value | 64 deep value small- to micro-cap stocks, 2% cash, a market cap of $440M | 10.5%, top 1% of small-value funds |
| The Cook & Bynum Fund | Nine value stocks from small to large cap, 6% cash, 70% invested in Latin America | 9.3%, top 1% among … emerging markets funds? A passion for South American Coca Cola |
| Pinnacle Value | 49 deep-value microcap stocks, 35% cash, a median market cap of $170M | 1.1%, top 2% of its peer group |
| Towle Deep Value | 27 deep value small cap stocks, 10% cash, a median market cap of $2.5B | -2.2%, top 10% of its peer group |
| LSV Value Equity | 178 deep-value mid-cap stocks, fully invested, market cap of$22.5B. The managers are famous quants and behavioral researchers; Morningstar gushes about it. | -6%, middling for a large-cap value fund |
Bottom line
Life’s uncertain, a reality that’s maddening for some and exhilarating for others. A fundamental choice you face is how you’ll face the uncertainty in the market and how much of your life you want to spend worrying about it. We don’t pretend to have solutions, just perspectives. Begin by asking, “am I the Terrified One, the Exhausted One, or the Enterprising One?” and begin exploring the path laid out for each.
We wish you well.