By Charles Lynn Bolin
I have made many mistakes investing and am an example that if one reflects upon their mistakes, they can recover. As George Santayana said, “Those who cannot remember the past are condemned to repeat it.”

I received assistance from Murray in writing this article.
In an AAII Newsletter, Warren Buffet’s mentor Benjamin Graham described individual investors as either “Defensive” or “Enterprising/Aggressive” based on how much “intelligent effort” they were willing or able to devote to investing. The Defensive Investor included professionals without much time and young investors without much investing experience.
In this article, I review the “mistakes” that I have made along the “Investor Life Cycle” journey and the “lessons learned” from the seven recessions that have occurred since I graduated from high school. Recessions should not be feared but understood and prepared for. These mistakes should be taken in the context of where I was in the chronology of the Investor Life Cycle, which I summarize as follows:
Pre-Accumulation Stage
Accumulation: Early Career
Accumulation: Middle Career
Consolidation and Preservation: Pre-Retirement
Withdrawals: Retirement
Gifting: Estate Planning
In my journey, I fit into the “Defensive” category through most of the Accumulation Stages and began using more “intelligent effort” as I shifted into the “Consolidation and Preservation” Stage.
This article is divided into the following sections:
Section 1, Investing Life Cycle
Section 2, 1973 – 1982: Secular Bear Market and Stagflation
Section 3, 1983 – 2003: Fabulous Decade(s) Ending in Dotcom Crash
Section 4, 2004 – 2010: Great Financial Crisis & Business Cycle Investing
Section 5, 2011 – 2020: QE & ZIRP – There is No Alternative
Section 6, 2021 – 2023: Preparing for Retirement & There Is an Alternative
The Weekly Market Pulse by Joseph Calhoun on Seeking Alpha (membership may be required) has some good research into past recessions for those interested in more information.
Investor Life Cycle
Since 1973, the deregulation of brokerage commissions, the rise of discount brokers, the increased popularity of mutual funds and exchange-traded funds, and the availability of the Internet and smartphones have revolutionized investing for individuals. “The Future of Capital Markets: Democratization of Retail Investing” by the World Economic Forum describes how recent changes allow retail investors to “take ownership of their financial future” yet exposes newer investors to higher risk.
The Modern Wealth Survey for Charles Schwab by Logica Research shows that of the participants, Americans believe that it takes a net worth, including home equity, of $774,000 to be financially comfortable and $2.2M to be wealthy. FatFIRE Woman has an interesting Net Worth Calculator. The concept behind FatFIRE is “Financial Independence, Retiring Early,” but with enough to have a good quality of life. The calculator shows that the median net worth of households in the 65-year age group is $189,100, including home equity, while ten percent of households at age 65 have a net worth of $2.3 million or higher. Pensions are often not included in net worth calculations and greatly distort comparisons.
This video from CNBC describes that if an investor seeks $70,000 in income from savings in retirement without drawing down the principal, $2.3 million is currently required at age 65 years of age. Saving $2.3M is a challenging but attainable goal for many people if the stars align properly. To achieve it, a person needs to save about $1,200 per month starting at age 25 or about $3,400 per month starting at age 40. Wow! Fidelity’s guideline is to have the equivalent of your salary saved by age 30, three times your salary by age 40, six times your salary by age 50, eight times your salary by age 60, and ten times your age by 67.
I created three scenarios in Portfolio Visualizer, starting with a low balance in 1992 and investing $1,200 per month, and adjusting for inflation. I overlayed my Investor Life Cycle Stages, as shown in Figure #1. Target Retirement Date funds weren’t commonly available until after 2000. The link to Portfolio Visualizer is here. Investing in an S&P 500 index fund would have resulted in $3.2M over the past thirty years, with a drawdown of over 50% during the financial crisis. The Vanguard Wellington Fund (60/40 stock to bond) would have accumulated $2.6M with a drawdown of 33%, while the more conservative Vanguard Wellesley would have returned $2.0M with a drawdown of 19%. At first glance, it sounds like a good strategy to be heavily invested in stocks early in the Investor Life Cycle and to get more conservative as we age to reduce the risk of drawdowns. This is the path that I took.
Figure #1: Growth of $10,000 with $1,200 Invested Monthly Adjusted for Inflation (log scale)
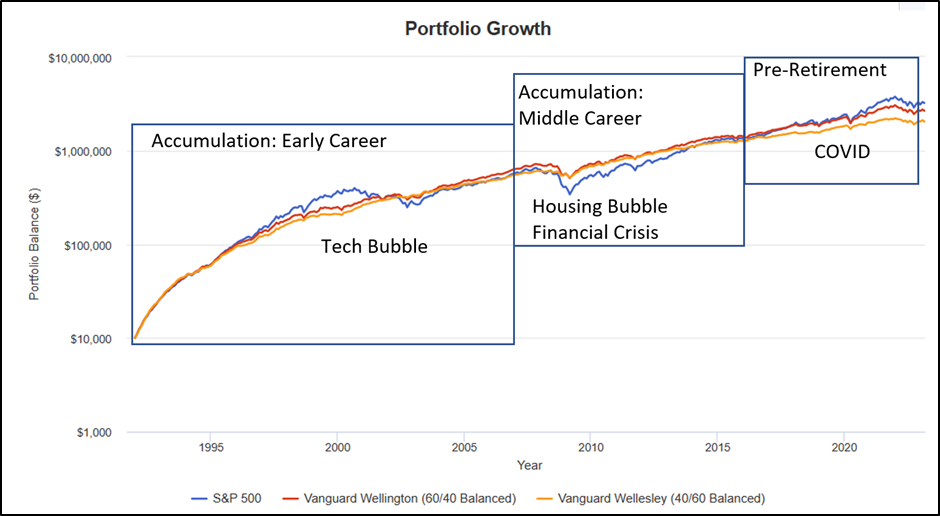
Source: Created by the Author Using Portfolio Visualizer
For the twenty years I was in the Accumulation Stages, the S&P 500 did not outperform either of the two mixed asset funds and was much more volatile. It is only since the Great Financial Crisis ended in 2009 with suppressed interest rates along with massive stimulus that the S&P 500 has significantly outperformed the mixed asset funds. I was overly aggressive during the Accumulation Stages and overly conservative during the “Consolidation and Preservation: Pre-Retirement” Stage.
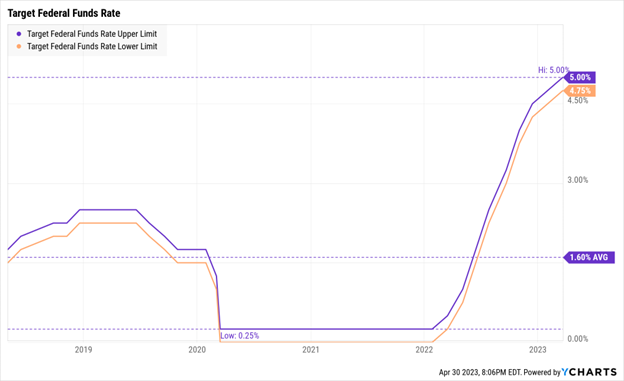
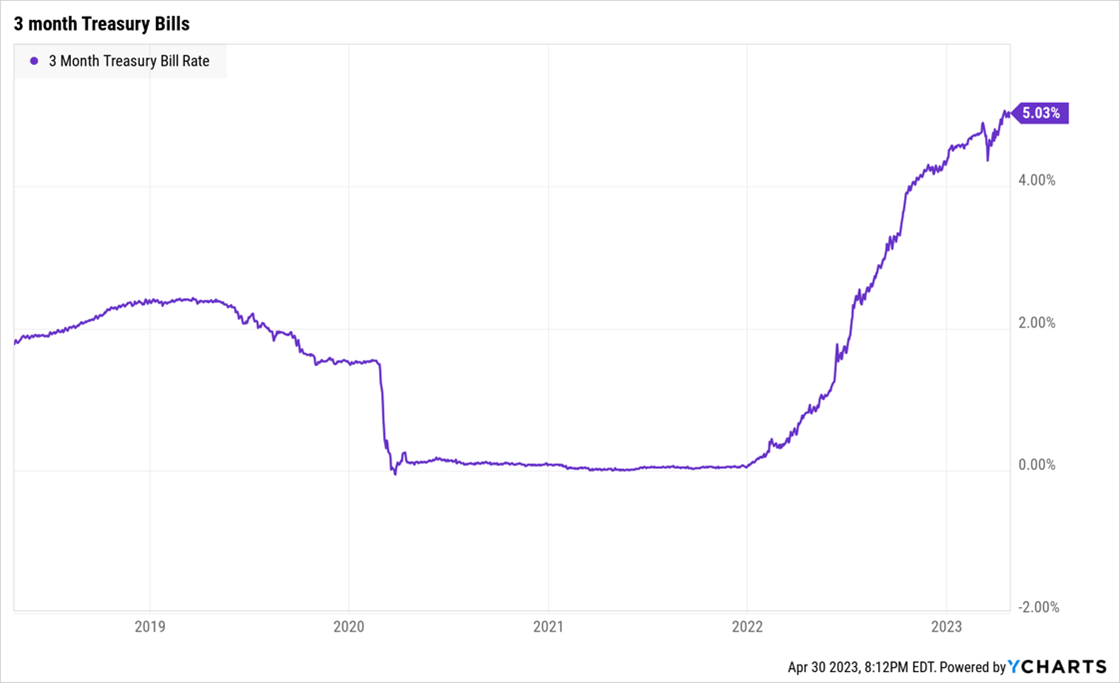
One of my lessons learned is the role of bonds in a portfolio. During the business cycle, the Federal Reserve raises interest rates to slow down the economy and reduce inflation. Figure #2 shows the Federal Funds Rate, yield on the ten-year Treasury note, and the growth of $10,000 invested in the Vanguard Intermediate-Term Treasury (VFITX). The dashed rectangles show the peak to trough of the ten-year Treasury yield as interest rates fell. Bond prices are inversely related to yields. Vanguard Intermediate-Term Treasury (VFITX) returned 8% to 10% annualized during these three periods of recessions and falling rates.
Figure #2: Fed Funds Rate & 10-Year Treasury vs Vanguard Intermediate Treasury (VFITX)
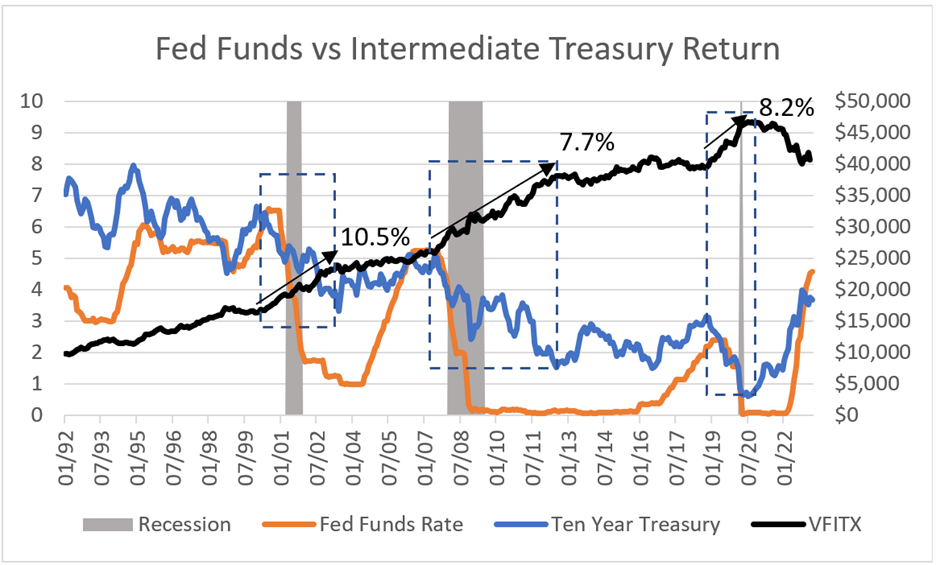
Source: Created by the Author Using Portfolio Visualizer and St. Louis Federal Reserve Database
Bonds can benefit a portfolio if held to maturity by locking in higher yields to cover withdrawal needs. Secondly, bonds usually have a low correlation to stocks, so when stocks go down, bonds increase in value as interest rates fall. Rebalancing, in effect, “buys low and sells high.” Last year was unusual because of high inflation and rates rising so rapidly that both stocks and bonds lost.
In Table #1, I summarize Fidelity Freedom (target date retirement) Funds and Fidelity Asset Manager funds. Both are invested globally. Target Date Retirement Funds decrease the allocation to stocks as an investor gets closer to retirement. The Asset Manager set of funds holds a relatively static stock-to-bond allocation. The Target Retirement Date funds have the advantage of simplicity by being able to invest and forget. The Fidelity Asset Management in the form of the Bucket Approach is better, in my opinion, if you are willing to invest the “intelligent effort” to understand your lifetime financial needs, your risk tolerance, and how the funds perform. Note that the short-duration Fidelity Freedom funds have a higher drawdown than the low stock-to-bond Fidelity Asset Manager funds.
Table #1: Fidelity Target Date Retirement and Asset Manager Funds

Source: Created by the Author Using MFO Premium MultiSearch
1973 – 1982: Secular Bear Market and Stagflation
I was oblivious to the Secular Bear Market in the 1960s and 1970s while serving in the military overseas and as a non-traditional student. I studied this time period in hindsight because the specter of a secular bear market and sequence of return risk (drawdowns during a recession) could be devastating for a retiree.
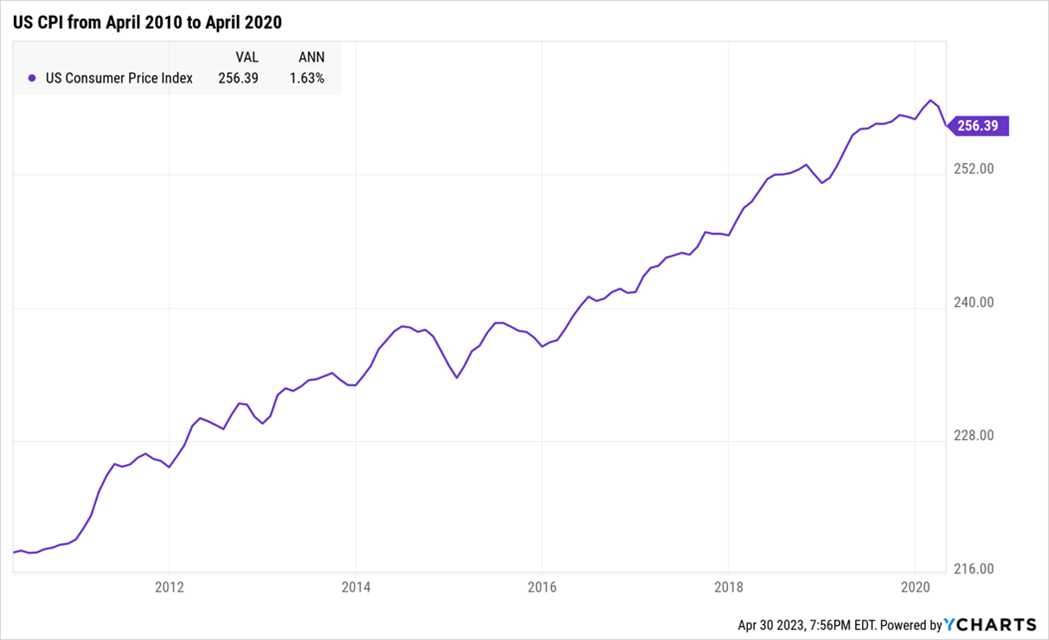
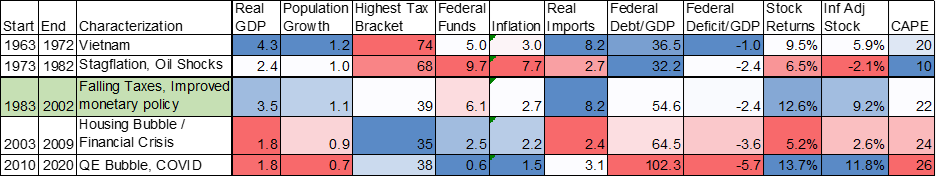
Table #2 contains some of the factors that characterize secular bull and bear markets. Blue is favorable, and red is unfavorable. Following the stagflation of the 1970s, tax rates, inflation, borrowing costs, and valuations fell and helped set up the 1983 to 2002 period for strong growth. The coming decade faces many headwinds, and the IMF estimates that global growth over the next five years will be at the slowest pace in the past three decades.
Table #2: Factors Impacting Secular Growth (Averages for Time Periods)
1983 – 2003: The Fabulous Decade(s) Ending in Dotcom Crash
Taxes falling from a high level and deregulation set the stage for growth in the 1990s (Fabulous Decade) with low inflation, rising productivity, high savings rate, and more globalization. Sound monetary policy led to stability. The Soviet Union collapsed in 1991, leading to higher globalization. To produce a balanced budget, taxes were raised, and federal spending was restrained. Scandals like Enron and WorldCom led to the Sarbanes-Oxley Act being passed, which mandates practices in financial record keeping. Parts of Glass-Steagall legislation were repealed in 1999, which some people argue contributed to the coming financial crisis.
All good things must come to an end, and valuations climbed to extreme levels leading to the bursting of the Dotcom Bubble. John Bogle, Founder of the Vanguard Group and promoter of low-cost index funds, wrote Enough: True Measures of Money, Business, and Life. In 1999, Mr. Bogle was “concerned about the (obviously) speculative level of stock prices.” He reduced his equity exposure to about 35 percent of assets, which he held through the time of writing Enough in 2010. Valuations matter.
Globalization and corporate consolidations and restructurings had some negative impacts on some industries. Entering my mid-30s with no retirement savings had as large of a psychological impact on me as the bursting of the dot-com bubble. What I did right was to find an employer with good benefits, invest the maximum amounts in savings plans, create emergency savings, pay off all debt, complete an MBA between layoffs, and focus on advancing my career.
Mr. Bogle advocated keeping investing simple. The legendary manager of the Fidelity Magellan Fund, Peter Lynch, advocated “buy what you know.” Charles Ellis, Author of Winning the Loser’s Game, advised that investors “can benefit from developing and sticking with sound investment policies and practices.” I keep these lessons close to heart. During the turbulent 1970s and 1980s, I learned to build a “Margin of Safety” into retirement plans.
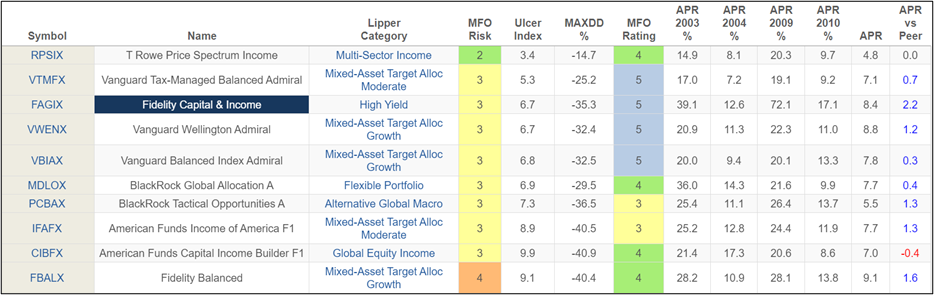
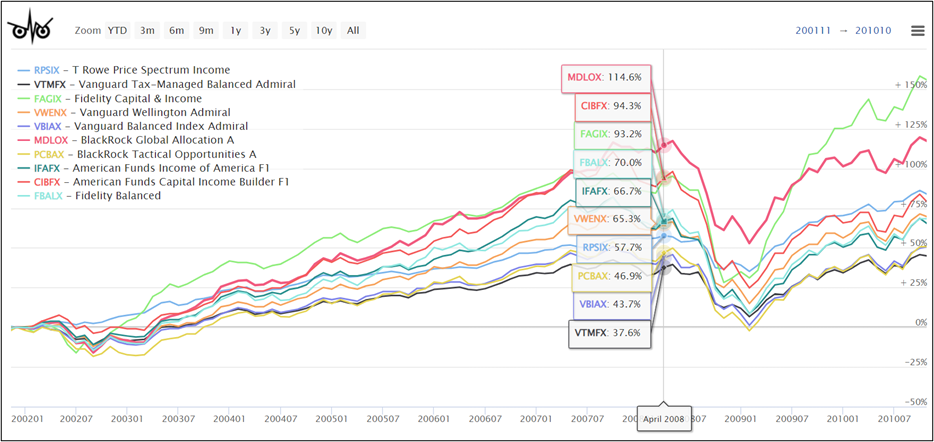
2004 – 2010: Great Financial Crisis & Business Cycle Investing
During this time period, easy credit led to the Housing Bubble with increased risk-taking in subprime loans/mortgage-backed securities resulting in the Great Financial Crisis (GFC). There were bank failures, government bailouts, and massive stimulus (TARP, ZIRP, and QE). Median household wealth fell 35% during the financial crisis. The Bernie Madoff Ponzi scheme collapsed and decimated many people’s retirement plans. The Dodd-Frank Wall Street Reform and Consumer Protection Act overhauled financial regulation in response to the GFC.
During my Middle Career Accumulation Stage, a mortgage loan officer told me that there was a financial crisis coming, and it would be bigger than anything anyone had ever seen before. I researched it and learned about subprime loans. I was ill-prepared (financial literacy) to adjust for a financial crisis, but I lowered my allocation to 40% stocks and 60% bonds. However, I made the mistake of getting back into the market too aggressively. I caught the proverbial “falling knife.” The Columbia Thermostat (COTZX/CTFAX) did not perform well during the Great Financial Crisis because its strategy was to invest in all stocks or bonds. They refined their strategy to gradually increase allocations to stock as the market fell. I like this approach and increased allocations to the fund last month.
Realizing that market conditions and events can be predicted to an extent was a turning point for me. I became more interested in business cycles and managing risk and modified my “buy and hold, low-cost index” approach to include a more active tilt.
I took a career change within the same company and worked internationally for ten of the next fifteen years. It was a refreshing and enjoyable change. I asked my company benefits department to prepare estimates of retirement benefits at ages 57, 59, and 62. I was surprised that there was such a huge increase in benefits for working just a few additional years, mostly because you continue to contribute to the plan instead of withdrawing. The same concept applies to Social Security benefits.
I read and adhered to Retire Secure!: A Guide To Getting The Most Out Of What You’ve Got by James Lange which led me to create a lifetime budget. I gained the understanding that if everything went according to plan, I would be in a high tax bracket in retirement because of the required minimum distributions from Traditional IRAs and switched to Roth contributions. Medicare premiums are also adjusted for high income levels.
In Thinking, Fast and Slow, psychologist Daniel Kahneman describes the concept that the pain of a loss is more than the pleasure of a gain. My biggest mistake was probably not having a Financial Advisor earlier. I view the Financial Advisor’s primary role as pushing investors into appropriate levels of risk and keeping them from panicking and selling when losses inevitably occur. Other benefits include investment selection and education about the consequences of taxes.
The best thing that Anna and I did financially was to help our son develop his talents, select a good university, get scholarships, and graduate with no student debt, along with helping him learn good savings habits. He was able to take a better path along the Investment Life Cycle than we did.
2011 – 2020: QE & ZIRP, There Is No Alternative
In the aftermath of the Great Financial Crisis, quantitative easing and artificially low interest rates helped keep the economy stable and growing with low unemployment. This was detrimental to savers and bond returns. Partisan brinkmanship in 2011 over the debt limits resulted in Standard & Poor downgrading the United States’ credit rating and more market volatility. Internet and Smartphone use grew along with cyber threats and fraud. S.2155 – Economic Growth, Regulatory Relief, and Consumer Protection Act, passed in 2018, increased to $250B the threshold at which banks receive enhanced supervision and likely contributed, along with mismanagement, to the failure of Silicon Valley Bank.
I underestimated the impact of quantitative easing and massive stimulus and was too conservative after the financial crisis. I built an investment model to optimize the stock-to-bond allocation based on risk and growth potential. It uses a macroeconomic approach. The bulk of my assets were in employer-sponsored savings plans, and while investment options were good, they were limited. Allocation was a more important variable to me than fund selection. I eventually was able to transfer employer-sponsored savings to Traditional and Roth IRAs with more funds available.
During the Pre-Retirement Stage, I consolidated accounts and reduced the number of investment companies that I use, but I believe in diversifying across investment companies as well as asset classes. I adopted a strategy to have 50% allocated to stocks dropping to 35% during “Risk Off” times and rising to 65% during “Risk On” times. I increased savings using “Catch Up” contributions and the backdoor Roth. I was introduced to Mutual Fund Observer and MFO Premium, with their rich risk and reward metrics, and I use them as the basis of fund selection.
2021 – 2023: Preparing for Retirement & There Is an Alternative
During the COVID pandemic, I was traveling through empty airports, and it was surreal. Flights were canceled, and more than once, I was quarantined in some remote country. I was overly conservative in investing. I started using Fidelity Wealth Management to manage a portion of my retirement savings because I like their philosophy of investing according to the business cycle. The other benefit is to have support for my wife in case of my untimely death.
I retired in June of 2022 at the age of sixty-seven. Working beyond normal retirement was very beneficial to retirement savings. I updated wills and estate plans and selected a CPA for tax planning. Based on my financial plan, I took one of several pensions not adjusted for inflation as a lump sum payment so that I have control over it and can pass it along as an inheritance. The lump sum payment came at the end of 2021 after the stock market had already fallen. Sometimes it is better to be lucky than good. I deferred the Social Security Pension to increase the inflation-adjusted benefits and the efficiency of a Roth conversion, and yes, I worry about the Social Security shortfall. The higher monthly payments and survivor benefits have a higher value to me than lifetime benefits tradeoffs.
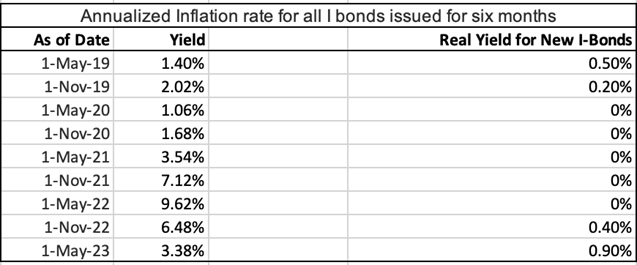
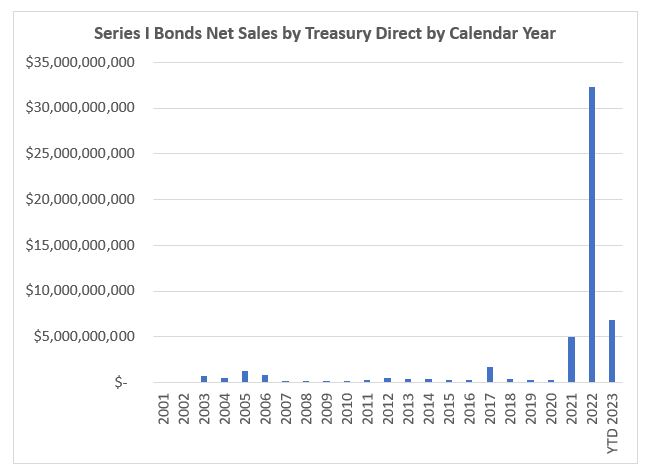
Interest rates have risen, and fixed income now offers a less risky alternative to stocks. I built short-term ladders of CDs and Treasuries as interest rates rose and ladders of Treasuries for the next eight years when Treasury yields were above four percent to match withdrawal (RMD) needs. With the recent bank failures, ten-year yields fell below 3.3%; however, yields on certificates of deposit and Agency bonds rose above five percent, and I have been buying them on the short end of the yield curve. I appreciate an MFO Reader who sent a link to me for Bauer Financial that rates banks and credit unions.
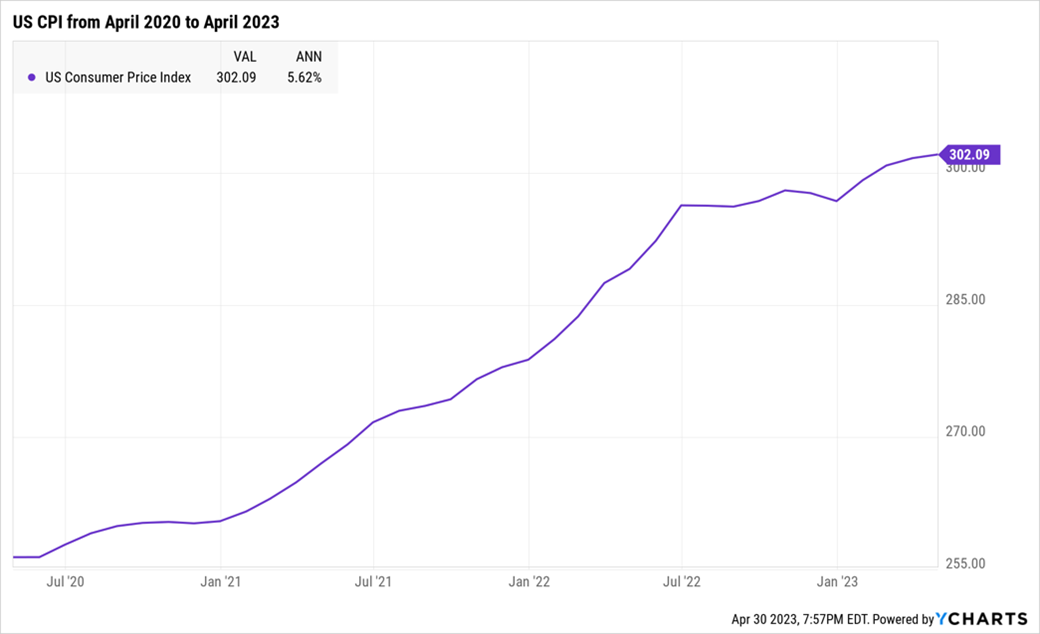
Morningstar’s Christine Benz advocates the Bucket Approach, which I have adopted. Last month, she wrote, “Can You Retire Soon?” She advises us to take higher inflation into account in our financial plans, evaluate spending and guaranteed income to determine a safe withdrawal rate, and to focus on a balanced asset allocation. One important point that she highlights is to use a variable withdrawal rate that is lower in bad times. She adds that balanced portfolios support the highest safe withdrawal rate. Thank you, Christine.
Having guaranteed income (pensions) and emergency savings in Bucket #1 provides safety and allows one to weather the risk of drawdowns. Placing Traditional IRAs in a conservative Bucket #2 is more tax efficient because taxes still have to be paid for withdrawals. I put tax-efficient after-tax portfolios and more aggressive Roth IRAs in Bucket #3 because taxes have already been paid.
Closing Thoughts
I worry about the high risk of a recession starting this year and the political brinkmanship over raising the Federal debt limits. I am “Risk Off.” Financial stress and high yield bond spreads spiked after the Silicon Valley Bank failure but have since receded. Initial claims for unemployment and the delinquency rate on consumer loans have started rising, and banks have been tightening lending standards for consumers since the middle of last year. I believe signs that the economy is slipping into a recession will become more evident during the next six months.
I have been following the recession playbook by reducing risk and buying higher-yielding, high-quality fixed income. I could be wrong. This article shows that I make mistakes like everyone else. Undoubtedly, I will have new lessons to learn, which are yet to be determined.


 Chip and I are planning a visit at the end of July to the Scottish Highlands and the Shetland Islands, home of her great-grandfather. Some prospect of seeing the Northern Lights, and a fair chance to visit some puffins. A road trip to the Isle of Skye, where Chip has an unfinished challenge involving an old lighthouse on a crazy, wind-swept spit of land sticking into the Atlantic. We’ve so far tracked down one (allegedly) amazing chocolatier: Iain Burnett, Highland Chocolatier. If you’ve got other leads, we’d be delighted to hear!
 Morningstar held its annual investment conference [Morningstar Investment Conference US (MICUS) 2023] this past week beginning 24 April in Chicago, where tulip gardens bloomed on the city’s walkways. 