Monthly Archives: June 2023

June 1, 2023

By David Snowball

Dear friends,

Welcome to summer.

Had I mentioned that I have the coolest job in the world? I love a challenge. Augustana offers them to me at the rate of sixty a week, approximately the number of students I work with. They often leave me stunned.

(See how important punctuation is? “They often leave me stunned” and “they often leave me, stunned” are two very different observations. Hmmm … both might be accurate, now that I think of it.)

My college started in 1860 with a very humble mission: it wanted to help the children of immigrants build a good life in a new land without ever forsaking the beauty and culture of their ancestral home. In 1860, that meant Sweden … though there was a short-lived experiment in peaceful coexistence with Norwegian Lutherans. (Predictably, that came to naught.)

In 2023, it means Vietnam and Ethiopia, Nepal and Ghana, more than it means Sweden or France, China or Japan. Over 2500 kids from other lands applied to join us; nearly a third of our incoming class of 840 – the largest in our history – will be international students. But another 20% will be the first in their families to attend college, a quarter will come from low-income households, and a quarter will be US students of color. On the whole, they rock.

And we just launched 550 of them back in your direction.

In the June issue of Mutual Fund Observer

Summer is a time when young people head home on break from school or university while their slightly older siblings in the workforce often get a bit of vacation time. For their benefit, we offer three articles designed to help young investors who are trying to make sense of things and get started: Mark shares the story of the young investor’s secret weapon: the health savings account, which can do three great things at once. Lower medical insurance costs. Lower taxes. Build wealth. Lynn Bolin walks through the process of setting up a financial plan; he’s working with an older friend, but the process is identical. And I cap things off with the answer to the question we’ve all been asking: how does Taylor Swift invest her millions? The answer is surprising: prudently, in real estate … and in closed-end funds? We’ll explain.

Devesh shared an evening with David Sherman, president of Cohanzick Management and a really sharp investor. In a singularly brisk article, Devesh shares 15 investing insights worth pursuing. In a second essay, Devesh channels a second great investor – Warren Buffett, in this case – to consider stocks, inflation, and your portfolio.

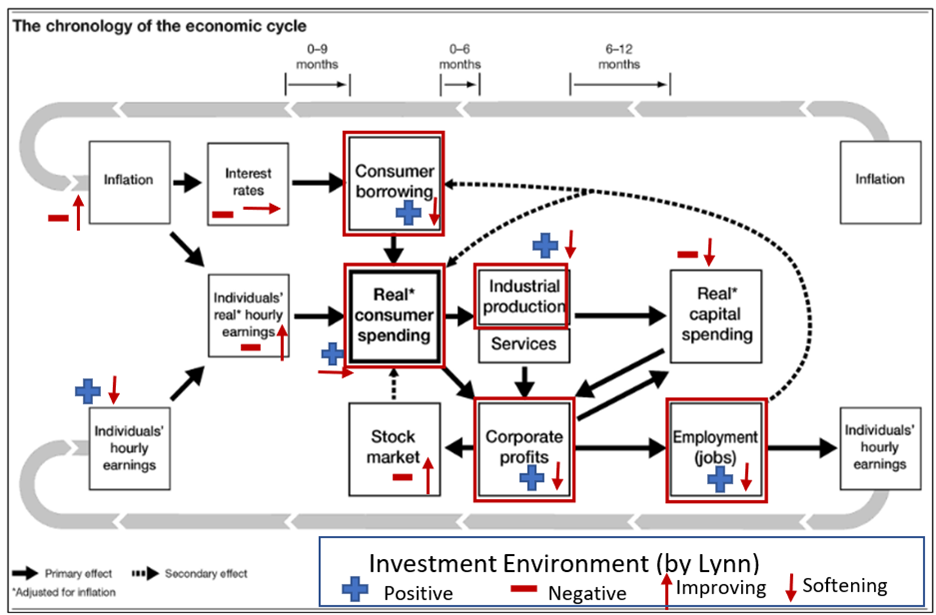
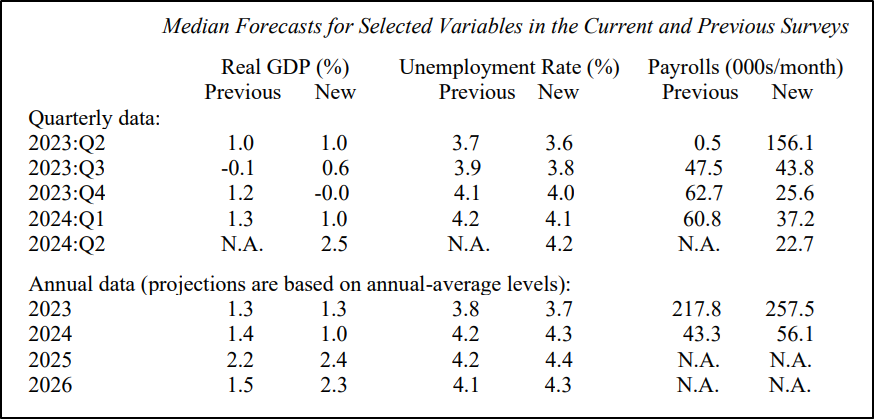
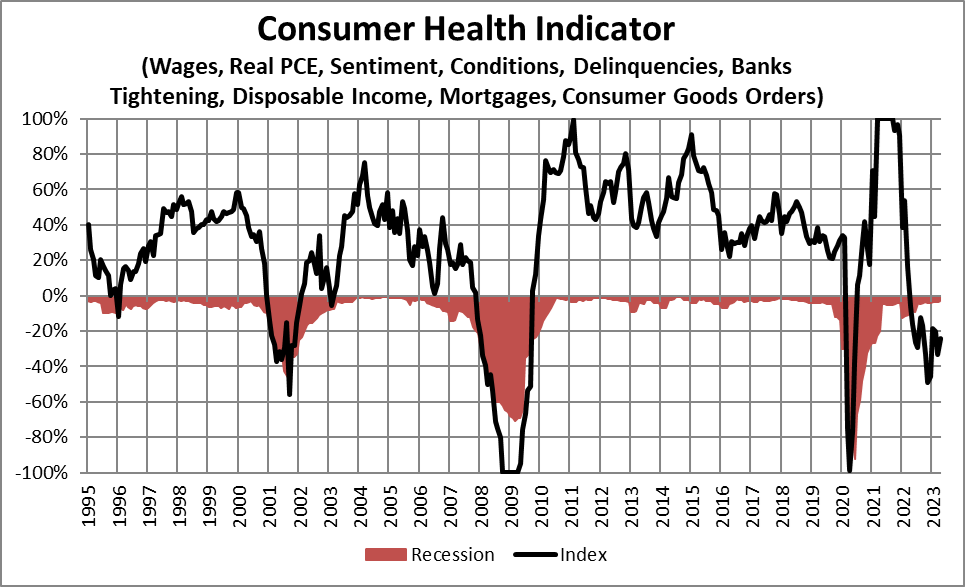
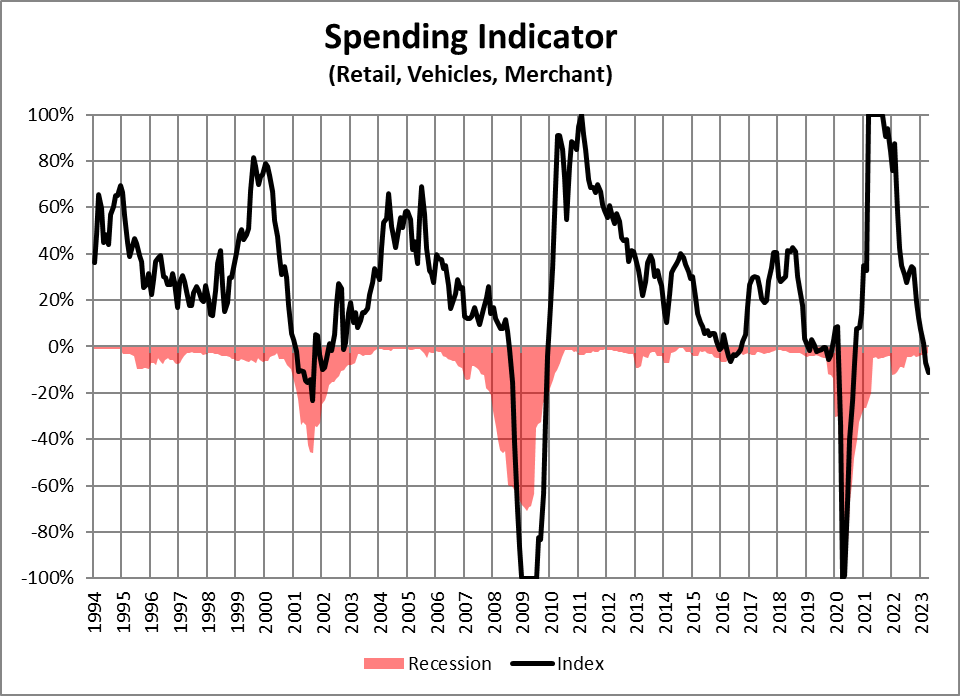
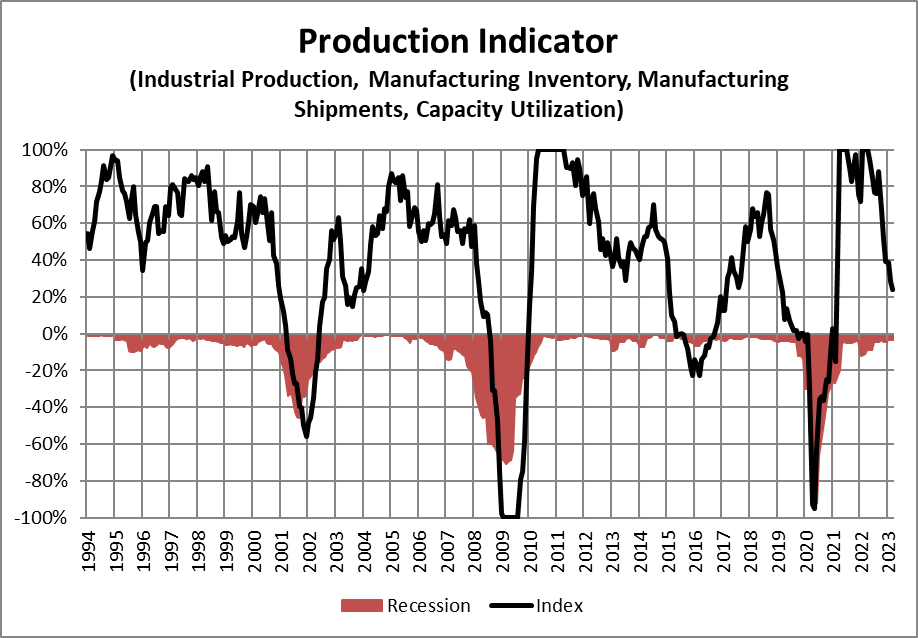
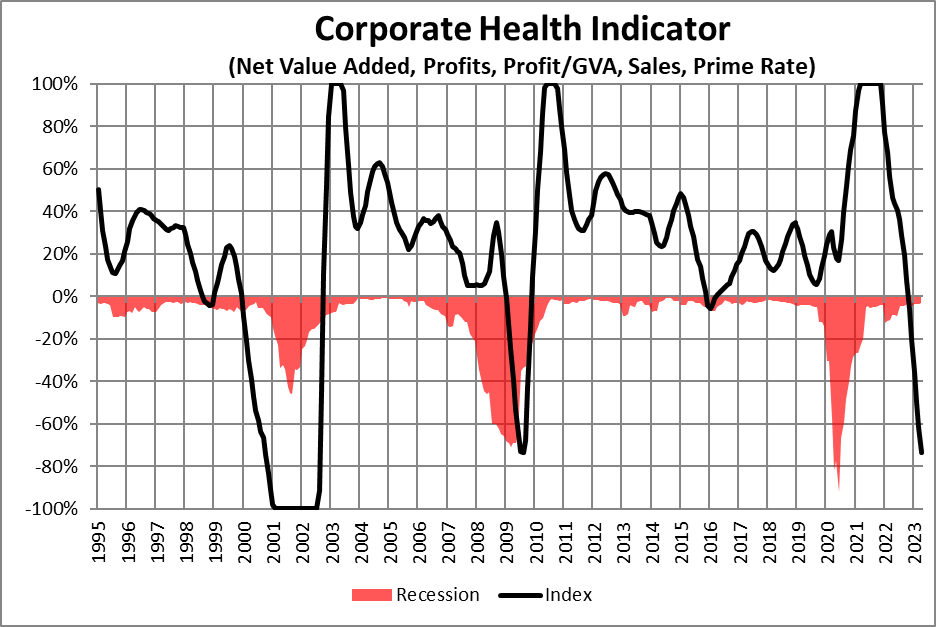
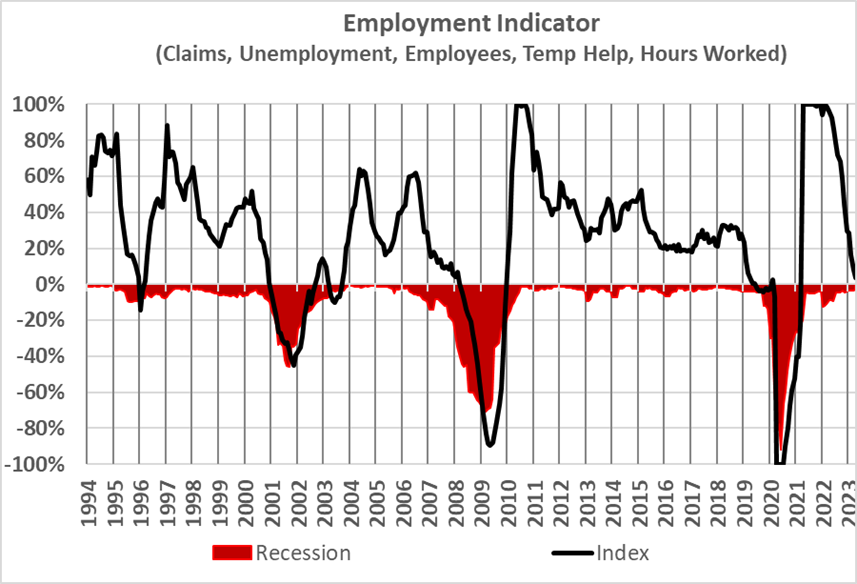
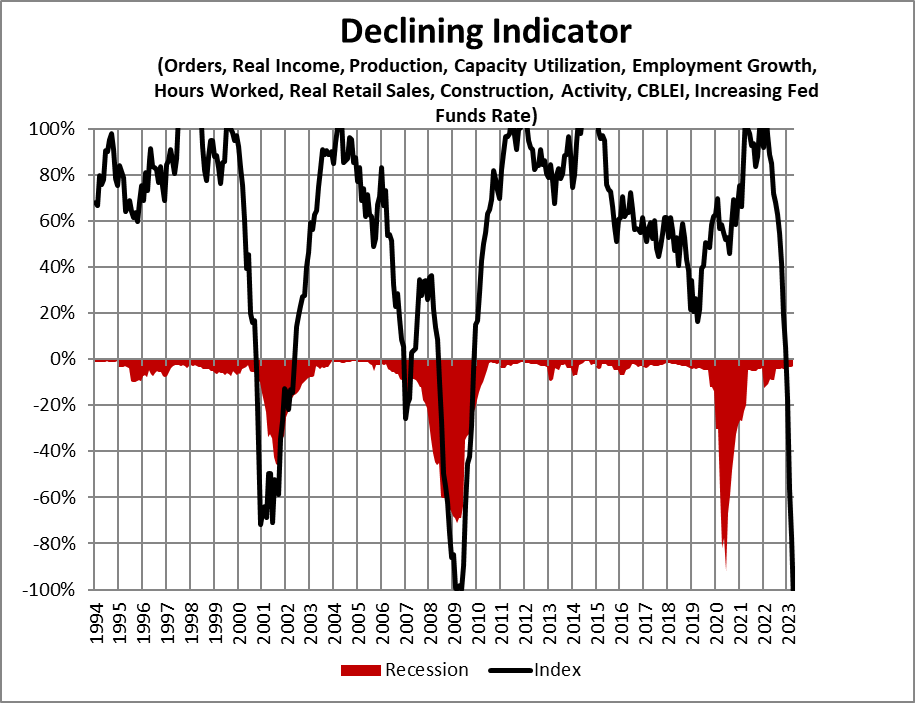
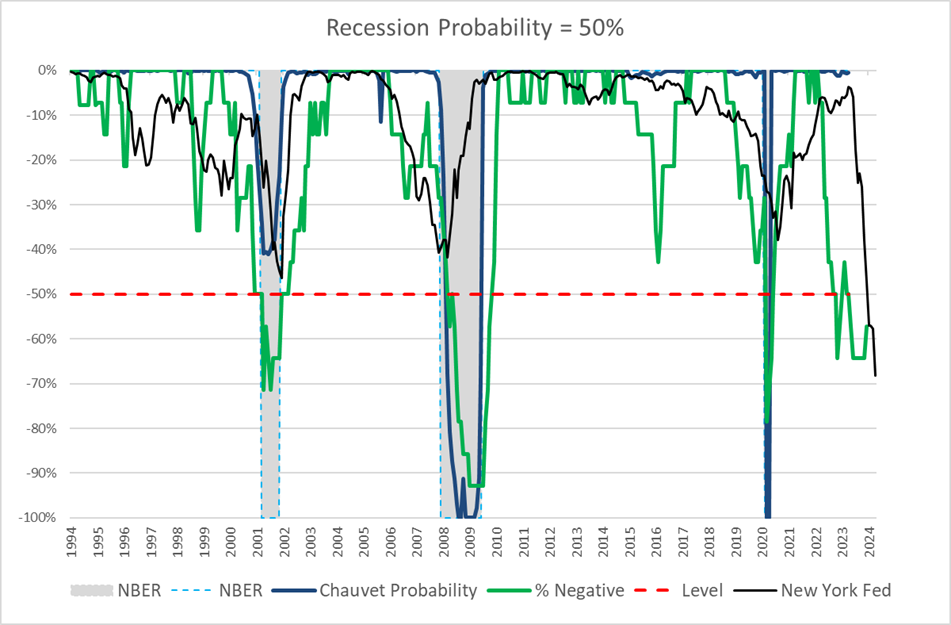
Counterbalancing Devesh’s reflections on inflation, Lynn takes up the recession watch. His recommendation comes down to two words: Buckle. Up.

I profile Leuthold Core Investment, one of the OG quant tactical funds. While Morningstar recently ridiculed the tactical allocation group, Leuthold has stood apart over decades for offering a balanced portfolio that makes smart, disciplined adjustments to evolving market conditions. So you don’t have to.

Finally, Shadow gets us up to speed on the industry’s developments, including the lamentable and slightly ludicrous infatuation with single-stock ETFs, in “Briefly Noted.”

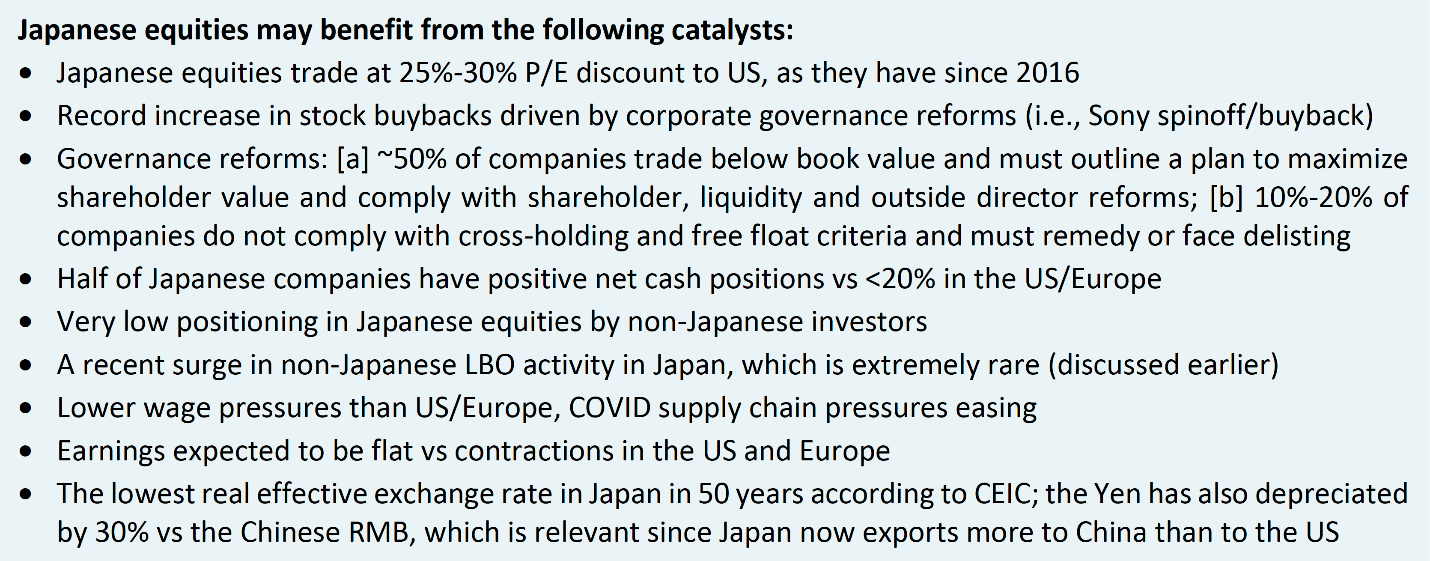
Devesh and David S. (the other David S.): consider Japan

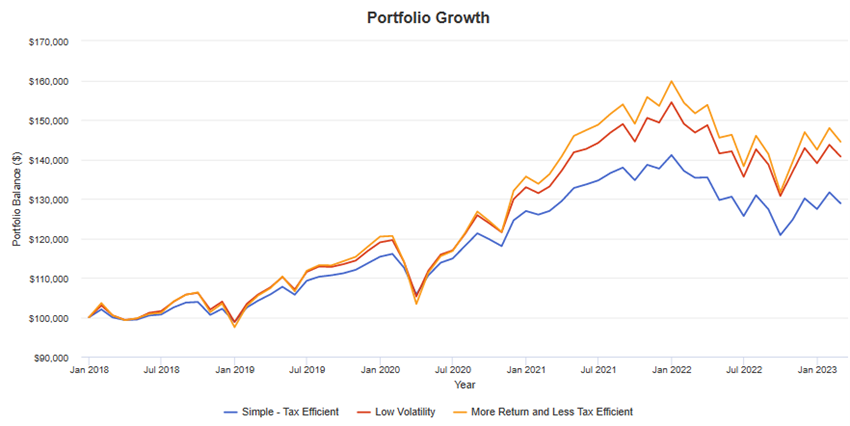
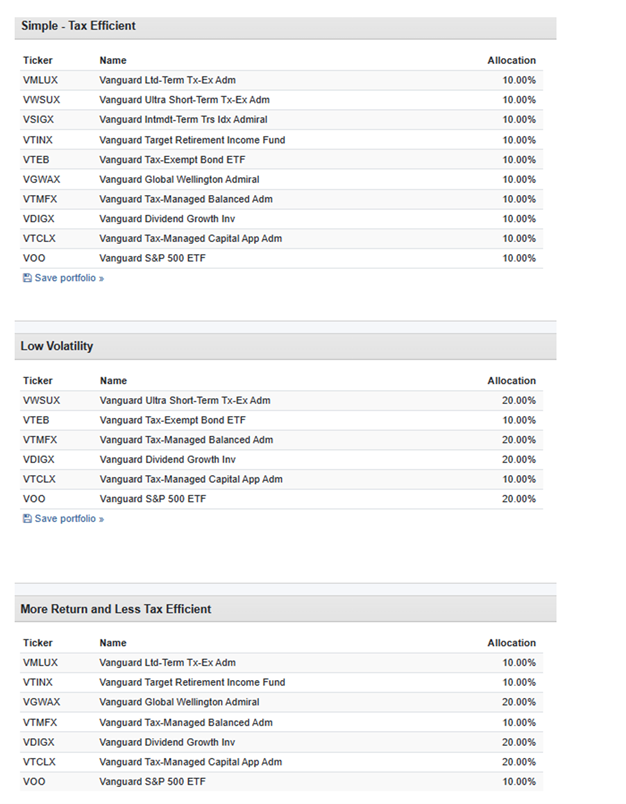
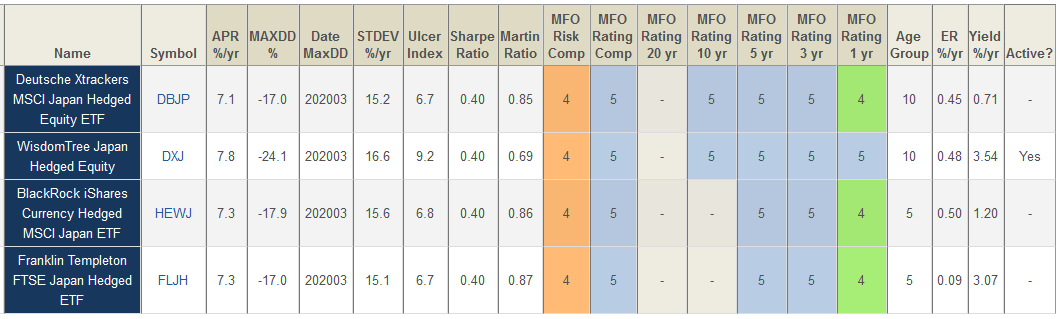
In their long dinner conversation, Devesh and David Sherman explored the prospects of advising in the Japan stock market. A quick survey helps answer the question of how to invest there.

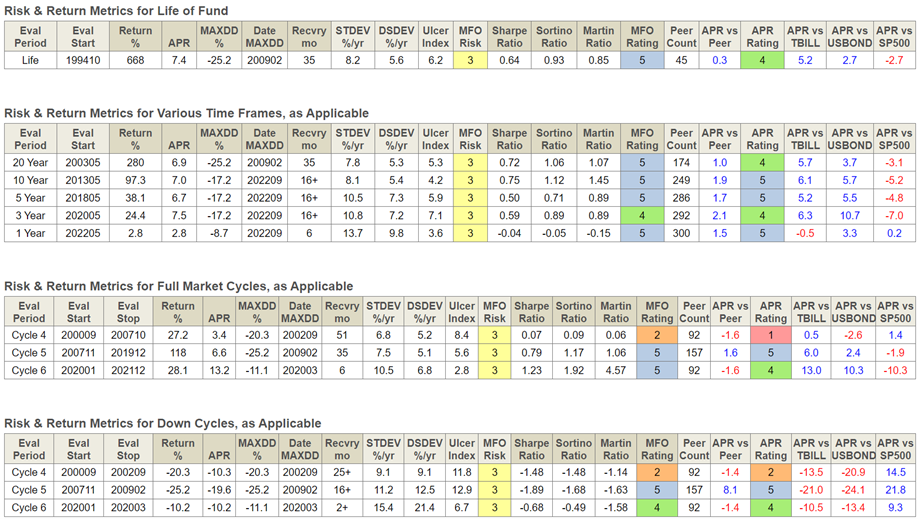
The MFO Premium screener offers up two insights: all of the best-performing funds are ETFs, and they all hedge against currency fluctuations. Here are the Great Owl funds, with their five-year returns and volatility metrics.

Morningstar’s recommended funds tend toward “large and well-established.” There are no publicly available Gold rated funds, but they do offer up two Silver medalists: T. Rowe Price Japan and Hennessey Japan.

Horizon Kinetics: Eight months later, Morningstar discovers the risk Devesh highlighted

In November 2022, Devesh Shah warned investors about the enormous risk that the Horizon Kinetics funds were subjecting their investors to by stashing nearly 50% of all of its firm’s assets into a single stock: Texas Pacific Land Corp.

Horizon Kinetics has placed a spectacular bet – firm wide – on a single stock. My argument is not that their bet is imprudent or that it will harm their investors. Instead, my argument is that the managers’ decisions carry the potential for spectacularly atypical performance.

If they manage to pull a rabbit, Kinetics is on its way to the Hall of Fame of investment returns in an otherwise awful market year. If Lady Luck decides not to cooperate, the risk for investors in Kinetics funds could be substantial. At the minimum, the large position concentration size of TPL in Kinetics portfolio seems diametrically opposite to their belief that investors are better served not by taking more risk…

Kinetics Fund investors: be hyperalert. (“Kinetics Mutual Funds: Five Star funds with a Lone Star Risk,” MFO, 11/2022)

Eight months later, almost to the day, a crack Morningstar team reported their discovery: Horizon Kinetics has a huge stack in Texas Pacific Land (“A Fund Shop Bets the Ranch on One Stock,” Morningstar, 6/1/2023).

Thoughts on the confluence of the two articles:

  1. We warned you of the risk before the funds crashed. Their flagship is down 22% YTD.
  2. Morningstar’s piece doesn’t hint at the existence of Devesh’s prescient warning. That might be because Morningstar doesn’t like sharing credit, or we’re too small for them to notice, or they’re too self-absorbed to care about other sources. None of the possibilities is terribly affirming.

Bigger is not necessarily, or even usually, better. If you’ve had the opportunity to use Morningstar’s newly crippled fund screener (the “premium” screener of old is gone) and compare it to the MFO Premium screener, you might reach the same conclusion. I spent a very long hour online trying to answer a very simple question: what has worked so far in 2023? The answer completely escaped me, but it also completely escaped “Mo,” their version of Microsoft’s Clippy office assistant.

Here’s our exchange:

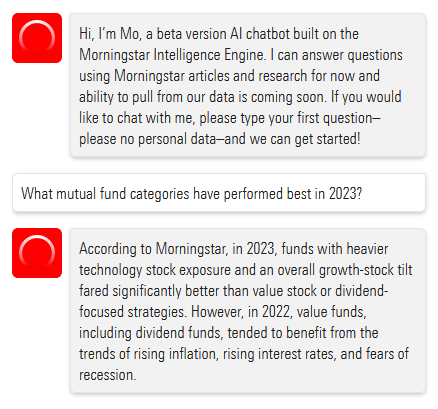
One would think that “mutual fund categories” is a term that might have been available, somewhere or somewhen, in the “Morningstar articles and research.”

Neither the “basic screener” nor the Investor allows you to compare funds with ETFs and CEFs (a function I’d asked about two years ago and to which I’d gotten a “future iterations” response). Investor doesn’t allow a search by returns (“Japan funds with YTD returns over 10%”). I can’t even get either to stop reporting every share class of every fund in the results. The Basic Screener announces there are 200 funds with YTD returns over zero. (There aren’t, that’s just the screener’s unannounced limit.) The first 25 “funds” listed were actually just seven funds with repeated share classes.

It’s hard to come up with a good answer to the simple question, why bother?

CrossingBridge Strategic Income vs. Osterweis Strategic Income: Month Two

In response to my April profiles of his RiverPark Strategic Income (soon to be CrossingBridge Strategic Income) Fund and Carl Kaufman’s Osterweis Strategic Income Fund, David took to the MFO discussion board to toss down the gauntlet:

Mr. Snowball and my fellow named firms:

I would like to have a gentleman’s wager of a dinner between all parties for the fund is considered the best based on the next 12 months in which David Snowball judges as well as determines criteria. Winner pays. Losers show up with winner at Mr. Snowball’s restaurant selection in Davenport environs, New York City, San Francisco, or Santa Fe. We can make it an annual event.

Not “winner takes all” quite so much as “winner takes dinner!” Our tally-to-date:

  CrossingBridge (bps) Osterweis (bps)
April 2023 115 85
May 2023 54 0
Overall 170 85

We will say now what we said then: these are two exceptional funds run by skilled and canny managers who share an independent streak and a loathing of unnecessary risk.

Thanks, as ever …

To our faithful monthly contributors, Greg, William, and the other William, Brian, David, Wilson, Doug, and the good folks at S&F Investments.

And too to Sharon from Illinois (with a matching gift!), Marty (Hi, Marty! My frustration with Morningstar’s screener was triggered by work on your request about funds that recovered dramatically from the 2022 debacle; my current plan is to share a “worst to first” story in our July issue using MFO Premium data through 5/30/23), and Marc from Maryland.

Speaking of July, we’ll share two redemption stories (Goodhaven, which looked hard in the mirror, and First Foundation Total Return, an old failure adopted by a new team, are rolling right along) and updates on our two favorite really passive strategies (Voya Corporate Leaders is approaching its 90th year without a manager or without evidence need for a manager and OneFund’s S&P 500 Equal Weight Index strategy has received endorsements from the Bank of America analyst team and John Rekenthaler who grumbles, “I cannot explain why the equally weighted portfolio has been superior to the sum of its parts … I am merely reporting the findings, which have been impressive.”).

As ever,

david's signature

Modest protection from runaway inflation

By Devesh Shah

Introduction

Warren Buffet has a long history of sharing sharp, colorful reflections on inflation and its role in controlling your profits.

Before we drown in a sea of self-congratulation, a further – and crucial – observation must be made. A few years ago, a business whose per-share net worth compounded at 20% annually would have guaranteed its owners a highly successful real investment return. Now such an outcome seems less certain. For the inflation rate, coupled with individual tax rates, will be the ultimate determinant as to whether our internal operating performance produces successful investment results – i.e., a reasonable gain in purchasing power from funds committed – for you as shareholders.

That combination – the inflation rate plus taxes – can be thought of as an “investor’s misery index”. When this index exceeds the rate of return earned on equity by the business, the investor’s purchasing power (real capital) shrinks even though he consumes nothing at all. We have no corporate solution to this problem; high inflation rates will not help us earn higher rates of return on equity. (italics in original, Shareholder Letter, 1979)

He might well have written those words as he munched his Big Mac and Coke, which that year cost $1.34 together.

High rates of inflation create a tax on capital that makes much corporate investment unwise – at least if measured by the criterion of a positive real investment return to owners. This “hurdle rate” – the return on equity that must be achieved by a corporation in order to produce any real return for its individual owners – has increased dramatically in recent years. The average tax-paying investor is now running up a down escalator whose pace has accelerated to the point where his upward progress is nil. (Shareholder Letter, 1980).

His example was roughly, if inflation is 12% and the short-term capital gains rate is 37% (the 2022 rates), any company with a return on equity below 16.5% – a high standard – is losing money for their investors.

… our views regarding long-term inflationary trends are as negative as ever. Like virginity, a stable price level seems capable of maintenance, but not of restoration.

Despite the overriding importance of inflation in the investment equation, we will not punish you further with another full recital of our views; inflation itself will be punishment enough. (Shareholder Letter, 1981)

A further, particularly ironic, punishment is inflicted by an inflationary environment upon the owners of the “bad” business. To continue operating in its present mode, such a low-return business usually must retain much of its earnings – no matter what penalty such a policy produces for shareholders. Reason, of course, would prescribe just the opposite policy. 

But inflation takes us through the looking glass into the upside-down world of Alice in Wonderland. When prices continuously rise, the “bad” business must retain every nickel that it can. Not because it is attractive as a repository for equity capital, but precisely because it is so unattractive, the low-return business must follow a high retention policy. If it wishes to continue operating in the future as it has in the past – and most entities, including businesses, do – it simply has no choice.

For inflation acts as a gigantic corporate tapeworm. (Shareholder Letter, 1981)

Two years later, he was “as pessimistic as ever on that front” (1983). That year’s inflation rate – 3.2%, though at the time of his letter he feared it would be closer to 4.4% – is lower than what we yet face today, about 4.9%.

Tapeworms, virgins, escalators, and burgers, oh my! What’s a prudent investor to do?

In this article, I’ve tried to go deeper into some of Warren Buffet’s recent comments with charts and data. I’ve tried to connect some of his history lessons from around World War II, the current market environment, and how that explains some of Berkshire’s market positions. Finally, if one is not to use this as a short-term timing message, thinking about his insights has helped me accept why holding stocks may be okay despite the pessimism from sharp market minds.

Background: a timely but uncharacteristic mention

Warren Buffett writes an annual letter to the shareholders of Berkshire Hathaway. This letter usually arrives in February, a few months before the annual shareholder meeting, in May, and is a good place to peg Warren Buffett’s and Charlie Munger’s views on investing, markets, and the economy at large. As an investor in Berkshire, I look forward to both the annual letter and the meeting.

When the 2022 Letter was released this year on the 25th of February, there was an uncharacteristic mention on runaway inflation. Specifically, Buffett wrote, “Berkshire also offers some modest protection from runaway inflation, but this attribute is far from perfect. Huge and entrenched fiscal deficits have consequences.”

Charlie Munger has been outspoken about the government-led giveaway during the pandemic. In the past, Buffett had always defended fiscal spending as needed because no one knew how bad the alternative could be. That tune changed with this year’s letter and meeting.

Runaway inflation is not a term to be used lightly, and I was puzzled by how someone so careful with his words as Buffett would include that term in his letter. I had wished for some more light on this during the annual meeting. He did not disappoint. 

Public Debt to GDP: WW 2 and Today

At various points in the Q&A, Buffett brought up the similarity of US debt around WWII and the present time. The picture below shows Gross Public Debt as % of GDP. We are remarkably at the same level of debt to GDP as we were back then – at around 120%. Economists tell us why large and sustained public deficits are not too healthy. Funding those deficits crowds out other investments. As Interest rates rise, investors feel safer in 5% fixed income. Who needs to risk money in an always nerve-wracking stock market?!

War Savings Bonds

To fund WWII spending, the US federal government needed a lot of money. War Savings bonds was one of the answers. The Joe I. Herbstman Memorial Collection of American Finance has good information on Savings Bonds from 1941 to 2007, along with some history. These bonds were forefathers to our present day Series EE savings bonds. According to the website, “Known originally as Defense Bonds and War Savings Bonds, these securities helped raise some $185 billion for WWII alone. Six million volunteers helped to sell some one billion individual securities for the war effort.” The 1944 War Savings bond apparently had a 10-year Yield to maturity of 2.92% annualized.

To compare the yield on these bonds, it would help to look at the yield available on 10-year US Treasury Bonds in the early 1940s. Buffett mentioned that he (just 11 years old at the time of the Pearl Harbor attack), many of his young friends (nerd alert!), and a whole lot of other investors rushed to buy War Savings Bonds, mostly because of the incessant calls from Donald Duck and war widows to support our boys and defend freedom, but also because the 2.92% yield from the War Savings Bonds looked attractive compared to what was available elsewhere.

Is there a parallel today?

WSJ reporter Lori Ioannau in an article dated May 6th, 2023, “What Investors Should Know About Money-Market Funds and CDs,” reports:

  • About $488 billion has poured into money-market mutual funds this year through April 27, according to Crane Data. These funds now hold a record $5.687 trillion in assets, up from $4.941 trillion a year ago.
  • Balances in CDs skyrocketed to about $577 billion in March from $36.6 billion in April 2022, according to the Federal Reserve. 

For the first time in almost 15 years, investors are getting over 5% in CDs and money-market instruments. The last time around, in 2007, was God’s gift to those who bought and saved themselves from the Great Financial Crisis. It looks like investors are not going to miss the opportunity this time.

What bond investors got wrong with WWII bonds then and what could go wrong now: Inflation

In the years that followed in the 1940s, observed inflation was much higher than investors expected. This higher inflation eroded the value of money. US Consumer Price Index clocked 18% in 1947, 8.8% in 1947, 5.9% in 1950, and 4.3% in 1951. The CAGR for inflation from the start of 1944 to the end of 1955 was about 4%, or a full point more than the attractive yield in War bonds.

US Consumer Price Index Table (as inferred from Y-Charts).

1941 9.93% 1948 1.69%
1942 7.64% 1949 -2.07%
1943 2.96% 1950 5.93%
1944 2.30% 1951 4.33%
1945 2.25% 1952 0.75%
1946 18.13% 1953 1.13%
1947 8.84% 1954 -0.74%

(*I’ve used the US Consumer Price Index (I:USCPINM) ticker from Y-Charts. A spot check to FRED Data shows the series is in the right ballpark.)

This brings us to recent Inflation:

2019 2.3%
2020 1.4%
2021 7.1%
2023 6.4%

Buffett believes that Jay Powell, the Federal Reserve Chair, is absolutely the right man for the job, and he completely gets the inflation situation. Yet, he fears the level of national debt and public deficit and the related consequences have become very real. The inflation monster might just be very difficult to slay. Unlike WWII Savings Bonds and his quick attraction to the higher yield, this time, Buffett wants to be careful. So, what is he doing?

  1. T-Bills: Berkshire holds $125 Billion in Treasury Bills, that is, US Government Debt less than one year in maturity. Others call this “dry powder.”

    Rolling short-term Treasury Bills allows Berkshire to accomplish a few things:

    • Earn 5% annualized yields with negligible risk;
    • Have the resources to move decisively to exploit a market panic; and,
    • Earn even higher yield if the Federal Reserve is forced to raise rates further.

    When asked why he doesn’t hold longer-duration bonds, he replied that he is not good at predicting the future path of long-term interest rates, and he doesn’t know anyone who is good at it either. Take those words seriously.

    Perhaps, he is unwilling to commit to long-dated fixed coupon bonds because he doesn’t see enough value in them. With T-Bills, he is happily earning $6 billion a year on the $125 Billion pile at a 5% rate. Perhaps, he is also unwilling to invest in TIPS, given their illiquidity, despite their inflation protection characteristic. When he needs the money, with T-Bills, he can have the money.

  2. The Largest Shareholder’s Equity of any American Company:

    Buffett likes to remind investors that Berkshire’s Shareholders’ Equity is the largest of any American company.

    As of Q1 2023, Berkshire has Assets of $997 Billion vs $480 Billion in Liabilities. The Total Shareholder’s Equity of $517 Billion. The table from Y-charts and while the numbers may be slightly different, the sizes are relatively recent and mostly in the right ballpark.

Berkshire owns more net assets, including physical assets – assets that can revalue higher in a high inflation environment – than any other US corporation. Through energy investments, through railroad infrastructure, through direct private holdings of companies, and through indirect investment in publicly listed companies, Berkshire is positioned for a relative loss of purchasing power of money and a corresponding increase in real world assets. This is “far from a perfect hedge,” but a hedge nevertheless against runaway inflation.

On one end, Berkshire has highly liquid T-Bills, which, at $125 Billion, stand at around 25% of Berkshire’s Shareholder’s equity. On the other end, Berkshire owns $388 Billion of Net Assets biased towards public and private equity holdings. It’s a rough approximation, but we can call it 75%. (I am oversimplifying the Balance sheet.) What did Buffett learn from the 1940s that he thinks applied now?

How did equities do in the 1940s and 1950s too?

The annualized return on stocks was 10.2% on the Dow Jones Industrials in the years from the start of 1944 to the end of 1954. During the same time, public debt went from 120% of GDP to 70%, War Savings Bonds yielded 2.92%, and inflation clocked at an average 3.9%.

High deficits to GDP and high inflation would certainly have created the same kind of bearish mindset as many investors find it fashionable to sport right now. But runaway inflation might also be a fertile ground for a grudging equity tape higher as the value of money erodes.

This is not a market-timing call. As the chart shows, equities tred water from 1946 to 1949.

They also went through a 24% bear market. There are no easy answers.

Equities today

We all know the story. Stocks presently have a bad breadth problem. NVIDIA, Microsoft, and a handful of other large technology companies with a focus on Artificial Intelligence have risen tremendously while the rest of the stock market has not. Not a single day goes by without some pundit expanding on how “if only someone were to tell you XYZ, would you still think the stock market would be up here?”

I get it. There’s certainly a nice little mini bubble in stocks focused on AI. But if bad breadth in the stock market bothers investors, they need to acquaint themselves with this 2018 research paper: “Do Stocks Outperform Treasury Bills.”

Professor Hendrik Bessembinder, the author, summarizes in the Abstract: When stated in terms of lifetime dollar wealth creation, the best-performing four percent of listed companies explain the net gain for the entire U.S. stock market since 1926, as other stocks collectively matched Treasury bills.

Bad breadth, apparently, is a feature of US stock returns. Equity returns are formed not because the world is a fair place but precisely because it’s an unfair place with monopolistic or oligopolistic pricing. Maybe the rising tide lifts a few boats much higher than other boats.

Conclusion

When all is done and dusted, stocks might still offer modest protection against inflation. As the world clamors for CDs, be careful not to lean too hard against stocks on a permanent basis.

There is a chance we may not see a repeat of the Great Financial Crisis.

We may need to revalue stocks higher as money gets slowly (sometimes not so slowly) devalued. Just be open to the possibility that maybe the next crash might not be as big as what the purists would like. Maybe stocks do win in the long run. Traders are on their own, but longer-term investors might be okay through inflation.

For readers who want a really readable examination of the performances of both equity and fixed-income in different inflation regimes – from deflation to “severe” inflation – from 1900 to 2010, there are few snapshots better than “Inflation and the US Stock and Bond Market” (2011) from O’Shaughnessy Asset Management. While the essay is more than a decade old, we haven’t seen a serious inflation threat – other than the cycle we’re just in – since its publication. Bottom line: Devesh and Warren are right. You’ll be okay.

Helping a Friend Get Started with Financial Planning

By Charles Lynn Bolin

A close friend, who I will call Carol for this article, wanted to meet to discuss whether she should get a Financial Planner. Here is her situation and what she is interested in learning:

Carol and her husband were good savers and earned pensions and Social Security. He passed away a couple of years ago after a prolonged illness. Their focus had been on healthcare needs and not on financial planning. She also received an inheritance from her parents. Carol explained that she had savings scattered at multiple banks in savings accounts, Inherited IRAs, Traditional IRAs, and Roth IRAs. She had questions about why she should invest when her living expenses were met with pensions and Social Security. We established that her preliminary financial goals were 1) to leave an inheritance to her children, 2) to simplify her finances, and 3) to manage taxes efficiently.

Over the past few months, we went over most of the information in this article. Carol assisted me in writing this article to share her experiences. This article is divided into the following sections:

FINANCIAL LITERACY

Carol has a lot of money in savings accounts and certificate of deposit ladders at different banks. I showed her that her bank was paying 1.5% while a money market at Vanguard was paying over four percent. Carol asked, “What is a money market?” Carol is an intelligent person who wants some assistance in becoming more financially literate. For this reason, I spent some time explaining stocks, bonds, mutual funds, and exchange traded funds.

Anna and I helped set Carol up with a computer and virus protection. I set up a web browser with the following links so that she could research financial information at her leisure. 

ASSESSING NEEDS AND GOALS

Carol’s Spending Needs

Carol and I started by understanding her situation, including her spending needs, as follows:

  1. Pensions and Social Security cover expenses.
  2. Has a net worth of several million dollars.
  3. Would like to relocate closer to her children within a year
  4. Would like money available to cover emergencies.
  5. Her money is mostly in low-yielding savings accounts.
  6. Investments are driving up her taxes.
  7. Her assets are scattered over many financial companies.

The Bucket Approach

We went over “The Bucket Approach to Retirement Allocation“ by Christine Benz at Morningstar. Ms. Benz describes having enough money in conservative Bucket #1 to meet near-term living expenses for one or more years. Moderate Bucket #2 contains living expenses for the next five or more years. Aggressive Bucket #3 contains investments that won’t be needed for longer periods of time.

Understanding Carol’s Risk Tolerance

I showed Carol how stocks and bonds can be combined to reduce volatility. I used Portfolio Visualizer to compare how one million dollars invested in the conservative Vanguard Wellesley (VWIAX), moderate Vanguard Wellington (VWELX), and the S&P 500 would have grown over the past thirty years. We looked at the final balance compared to the drawdowns. We discussed that this was a simplified example and, in reality, instead of owning one fund, she should follow the bucket approach to match spending needs.

Figure #1: Growth of One Million Dollars

Source: Author Using Portfolio Visualizer

I then built three portfolios using Portfolio Visualizer to represent a Simple Tax Efficient portfolio, a Low Volatility Portfolio, and a Less Tax Efficient Portfolio with higher returns. We discussed that the returns were before taxes, and the one that was best for her might depend on what tax bracket that she is in. We also talked about rebalancing the portfolios to maintain a consistent allocation to the funds.

Figure #2: Growth of Tax Efficient Portfolios

Source: Author Using Portfolio Visualizer

Table #1: Portfolios of Tax Efficient Funds

Source: Author Using Portfolio Visualizer

I asked her how she would feel if she lost 20% to 50% of her financial assets in a recession. Carol said that she would be comfortable with a stock-to-bond ratio between forty and sixty percent.

Developing Goals

Once we had a firm understanding of what is available, we were ready to define some broad financial goals:

  1. Leave a tax-efficient inheritance for her children.
  2. Have assistance managing her assets.
  3. Simplify finances.
  4. Manage taxes more efficiently.
  5. Improve her financial literacy.

FINANCIAL INSTITUTIONS AND ADVISORS

Carol asked me how to find a Financial Advisor and how she would know if they were right for her. The most important criteria for me are that the Financial Advisor listens to my concerns, understands my situation, puts my interests first, and is financially knowledgeable. Surprisingly, most potential advisors have not passed this simple test. I told Carol that she should interview potential Advisors, and if she felt that they weren’t listening to her and putting her needs first, then they weren’t right for her.

Does Carol (or Anyone) Need a Financial Advisor?

Dr. James Dahle wrote “The Value of a Financial Advisor” in The White Coat Investor, discussing the pros and cons of using an advisor from the perspective of an investor. For me, it comes down to spending the time to educate yourself on the complexity of investing and the ever-changing environment. The main advantage for me is that it provides my wife with someone to give guidance in case I pass away unexpectedly. The second advantage is to help me stay up-to-date as I age. I like a hybrid approach between using an advisor and Do-It-Yourself.

Fraud

Fraud and incompetence should be major concerns for any investor seeking financial advice. Bernie Madoff comes to mind immediately as someone whose $65 billion Ponzi scheme collapsed during the financial crisis in 2008. Ginger Szala at Think Advisor describes just a sampling of financial fraud in “12 Worst Financial Advisors in America: 2016”. One can minimize the risk of fraud by selecting a good asset manager or financial advisor(s) and keeping it simple.

Largest Asset Managers

We reviewed where Carol’s money was invested, and she expressed a desire to consolidate her money. A good place to start is America’s Top 50 Asset Managers by ADV Ratings. BlackRock, Vanguard, Fidelity, State Street Global Advisors, and Morgan Stanley are the five largest, with at least three trillion dollars in assets under management. We then reviewed the IRA Accounts considered “best” by Forbes Advisor, Nerdwallet, and US News.

Financial Advisors

“Financial Advisors” is often used synonymously with “Asset Managers,” but they can be distinct. Once you have selected an Asset Manager such as Vanguard, you may also select an Independent Financial Planner. For example, John Woerth, Senior Communication Adviser at Vanguard, wrote “How To Select a Financial Advisor,” which is a good summary of how to find an advisor and verify their credentials.

“Best” Financial Advisors is subjectively based on what an investor is most interested in. “Best Financial Advisors” by Ashley Eneriz at Consumer Affairs and “10 Best Financial Advisors of April 2023” by Alana Benson at Nerdwallet provide comparisons. Catherine Brock at Forbes has some good guidelines on how to conduct an interview in “16 Important Questions You Should Be Asking Your Financial Advisor”.

Financial Advisors at Financial Asset Managers

I started using Fidelity Executive Services on a limited basis over five years ago through my employer. Upon retirement last year, I started using Fidelity Wealth Services to manage some accounts. My preference is to use a Financial Advisor from the Asset Manager rather than an Independent Financial Advisor. I like companies that use a team approach or have solid practices in place. I have talked with Vanguard representatives about their advisory services but have not used them.

I like Vanguard for its simplicity, philosophy, low-cost funds, and company structure and policies. In my opinion, its educational and analytical tools were lacking but are improving. I like Fidelity for its financial resources and tools, range of products, business cycle approach, and services. Their fees are below the industry average but higher than Vanguard’s in many respects. Below are the Customer Relationship Summaries for Fidelity and Vanguard describing services and fees.

Verifying Your Investment Advisor

Once you have identified a potential Adviser, there are several sources that can assist you to verify their credentials:

FIDELITY VERSUS VANGUARD

Carol expressed an interest in knowing more about Fidelity and Vanguard. I provided her with the following articles, comparing them. In general, Fidelity is best for frequent traders, for ease of use, research and data, technology, and retirement planning assistance. Vanguard is better for long-term/retirement investors, buy-and-hold investors, and those who prefer low-cost investments, simplicity, and index funds.

Companies change, and Advisors change. I like to diversify across financial institutions as well as across asset classes because I can choose the best products and services from each. This is the preliminary conclusion that Carol reached as well.

How Will Fidelity or Vanguard Manage Carol’s Money?

Ultimately an investor needs to talk to the Financial Advisor to determine how they will work together to manage the client’s money because the services are highly customizable. I chose to set up my accounts that are managed in mutual funds and exchange traded funds.

Both Fidelity and Vanguard have a range of Advisory services, from robo-investing to Private Wealth Management, as shown in the links below. To get a full sense of what they offer, I suggested that Carol call both Fidelity and Vanguard and ask them about their advisory services.

What I suggested as a starting point for Carol is considering the Personal Advisor Select at Vanguard, which has a minimum of $500,000 and fees of 0.30%. With this, she gets a dedicated advisor and a host of other services. By comparison, at Fidelity, I suggest Fidelity Wealth Management which has a dedicated advisor and a minimum of $250,000 in assets managed through Fidelity. Fees range from 0.50% to 1.5%, depending upon the amount managed. Another option is Fidelity Wealth Services and Portfolio Advisory Services, which will manage your account.

Investment Approach

Fidelity approach is described in The Business Cycle Approach to Equity Sector Investing by Fidelity Institutional Insights. I find the Insights from Fidelity Wealth Management to be highly informative.

Over the past decade, I talked to Vanguard representatives twice about managing a portion of my financial assets. While I like Vanguard, their advisory services were not a good fit for me. Helping Carol has led me to review what is new at Vanguard. I ran across the recent articles below that describe some of Vanguard’s approaches, and they are on my reading list for June. In particular, I am curious about the Time-Varying Portfolio. Roger Aliaga-Diaz, Global Head of Portfolio Construction, wrote For a Disciplined Investor, Allocations That Fluctuate where he says:

“It’s important to understand two things about our time-varying asset allocation approach. It’s not for everyone; it’s intended for investors willing to accept a level of active risk, specifically the risk that our models may not accurately capture economic and market dynamics. And we recommend that investors make use of professional financial advice in relation to time-varying portfolios.”

EVALUATING TYPES OF ACCOUNTS AND FUNDS

I believe Carol will benefit from a Financial Advisor helping to set up a withdrawal strategy, manage taxes, understand investment products, and rebalance a portfolio. Carol’s situation is complicated because she has about six different types of accounts.

Withdrawal Strategy

Even though Carol has pensions and Social Security to meet spending needs, she is going to have to make withdrawals from inherited IRAs and Traditional IRAs. With her goal of passing along an inheritance to her children, she needs to take into account taxes. “How to Make Your Retirement Account Withdrawals Work Best for You” by T. Rowe Price was particularly insightful for me because it describes taking accelerated withdrawals from a Traditional IRA and putting the money into an after-tax, tax-efficient account.

Taxes

Dividends and interest are taxed as ordinary income, usually at a higher rate than capital gains. A large portion of Carol’s assets are in savings accounts, and she has to pay taxes on this income. Carol and I looked at municipal bond funds and municipal money markets as a way of reducing taxes. Income levels can also impact Medicare income-adjusted premiums, which need to be considered. Passing along an Inherited Traditional IRA can complicate taxes for heirs because they have to withdraw the money within ten years.

Tax Efficient Accounts

It was timely that Christine Benz at Morningstar wrote “Tax-Efficient Retirement-Bucket Portfolios for Vanguard Investors” while Carol and I were working on financial planning. The article describes Conservative, Moderate, and Aggressive tax-efficient portfolios of Vanguard funds using the Bucket Approach.

Rebalancing a Portfolio

Rebalancing sounds simple but involves knowing when and how often to rebalance and what the tax consequences are.

The Bucket Approach with Tax Advantaged Accounts

I put together the table below to explain Carol’s accounts, taxes, and possible withdrawal and investment strategies. “Years” refers to when money will be withdrawn for spending, required minimum distributions, or tax rules. “Risk” refers to whether the Bucket is intended for spending, which should be invested conservatively, or long-term investments. I then listed possible Vanguard funds based on risk and tax efficiency. Carol and I then matched her accounts with the Buckets. Some of the Buckets were eliminated as we defined a withdrawal strategy. Less tax-efficient, higher risk/reward investments should be concentrated in Roth IRAs.

Table #2: Combined Bucket and Accounts by Tax Status

Source: Author

SETTING UP A TAX-EFFICIENT ACCOUNT AT VANGUARD

Carol decided that she wanted to open an after-tax account at Vanguard to manage longer-term tax-efficient investments. I helped her set up the account and transfer the funds from a savings account. Carol and I reviewed the portfolios described by Christine Benz, and she decided to invest in “Vanguard Tax-Managed Balanced Admiral (VTMFX),” which maintains roughly a 50% allocation to stocks as a self-directed portion of her portfolios. The benefit of this fund is that it is an all-in-one fund that Vanguard manages for tax efficiency, and Carol doesn’t have to worry about rebalancing. Table #3 contains some risk and reward metrics from Mutual Fund Observer Multi-Search.

Carol raised a concern about the US economy going into a recession this year and the stock market falling. I explained that she wanted the account and fund to be a long-term investment and to work in a tax-efficient manner, so it should be “buy and hold”. I agreed with her that a recession is likely and that short-term interest rates were high. We invested the money in the Vanguard Municipal Money Market Fund (VMSXX), which currently has a seven-day SEC yield of 3.19%, and put a modest amount in Vanguard Tax-Managed Balanced Fund Admiral Shares (VTMFX). Over the course of the year, we will move more money into VTMFX as opportunities arise.

Table 3: Vanguard Tax-Managed Balanced Fund Admiral Shares (VTMFX)

Source: MFO Premium Multi-Search

THE NEXT STEPS

Carol has identified a potential advisor at Fidelity and will be calling him to open an account and discuss financial advisory services. She will also be calling Vanguard to discuss advisory services.

CLOSING THOUGHTS

In Carol’s words:

My comfort level has improved dramatically. Before working with Lynn, the only place that I felt comfortable putting my money was in savings accounts at banks even though I knew the yields were low. I have a better understanding of the topics covered in this article. I now have a good set of financial tools to do my own research. We set up a tax efficient account at Vanguard with security authorization. I will be contacting both Fidelity and Vanguard to evaluate whether I want to have them as Financial Advisors or manage a portion of my assets. What I will be looking for when I talk to them is how well they listen to me. I will take a step back and think over my options before reaching a conclusion.

I have enjoyed helping Carol and am happy that she has learned so much. Investing is a passion of mine, but as a cancer-free cancer survivor, I remind myself that if I am not around, am I leaving my wife in a good position to manage money? I will read the articles on the Vanguard Time Varying Asset Allocation Model and set up an appointment to see what Vanguard advisory services, if any, I may be interested in.

Best wishes to Readers on the same journey as Carol. I hope you found some of the information in this article informative.

A Dinner and Walk with David Sherman, fund manager of Crossing Bridge Funds.

By Devesh Shah

Last week I had the opportunity to sit down for dinner with one of our own, the legendary David Sherman. He is no stranger to regular readers of MFO. His funds, public and private funds through Cohanzick and CrossingBridge and the RiverPark Short Term High Yield Fund, for which he’s the sub-adviser, are uniformly first rate. He’s articulated four investing principles that are embodied in each of his portfolios:

  1. Return of capital is more important than return on capital
  2. We are in it for the long haul, seeking to achieve consistent, solid returns
  3. Understanding the business model and associated risks is essential to intelligent investing.
  4. Being disciplined and pragmatic are indispensable in this ever-changing world

I commend to you both our coverage of his thoughts on the banking crisis (“The tide is going out,” 2023) and our profiles of RiverPark (now CrossingBridge) Strategic Income and RiverPark Short Term High Yield.

We went to dinner at a local Italian place, La Pecora Bianca, only to find out we could have gone to an even more local(er) Italian. David lives exactly a block away from me on the Upper West Side.

“Where do you get your coffee, David? Why have I never seen you around here?” I asked.

“I don’t do coffee,” he told me. And I understood why when he took me on a whirlwind of his views on markets and business ideas from the 1990s to 2050. David Sherman doesn’t need coffee. He is amped up on markets and life.

It was a most fascinating evening where I learnt a lot from a market veteran. His views often did not align with mine, and to be honest, that’s the kind of dinner I like to go to. It helps me evaluate what I have figured out and what’s missing.

It would be impossible to cover all of it in detail here. However, I think it might be fun to format this article into a rapid-fire set of Q&A to get his perspective on markets (beyond his fund).

Don’t hold him to the responses, but they are instructive nevertheless.

Personal Investment Situation

  • Do you manage your personal investments? Kind of.
  • Do you have a well thought out personal account (PA)? Nope.
  • Why not? Not enough time, given fund responsibilities.

US Stocks

  • Views on US Stock Market: Expensive
  • What percent of your portfolio are US stocks? Less than 15%
  • What did you buy last? Google, when the AI Bard fiasco happened, and State Street, which is the only financial that has nothing to do with the banking crisis.

    Snowball interjects: in February 2023, Google debuted its competitor to ChatGPT, a program that is dubbed “AI Bard.” The problem is that Bard sort of blew the answer to one question. Someone asked, “What new discoveries from the James Webb Space Telescope can I tell my 9-year-old about?” Bard promptly (and, I’d guess, cyber-cheerfully) offered a list that included one 19-year-old discovery definitely not related to JWST. Investors promptly sold Alphabet in a two-day panic, dropping its market value by $170 billion. Fuller coverage from The Verge.

  • View on Berkshire Hathaway: Complicated.
  • Why? It’s better than owning the S&P 500 Index fund. It’s a well-managed “mutual fund.”
  • But? Buffett key man risk.
  • Do you think Buffett makes actual investing decisions anymore? No, but he can call capital away from the guys who do.

International Stocks

  • What do you think about Buffett’s Japan trade? Makes a ton of sense. Japan is my favorite market.
  • Name some reasons: Japanese government owns a significant portion of Japanese stocks. There is now a legal mandate to monetize the embedded value for shareholders. Large number of companies trade at net-net.

    Snowball interjects: hi, again! “Net-net” refers to a company whose cash on the books is greater than the total value of their stock. Translation: when you pay, say, $10 for one share of a net-net company, you’re getting, say, $12 in cash plus the value of the company’s operations.

    JP Morgan’s Michael Cembalest, “Too Long at the Fair” (May 2023) and the case for Japanese stocks

  • View on Indian stocks: They have been a great investment for my family since the 1990s. I sold them a few years ago.
  • Why did you get into India, then? I liked the democratic angle compared to other EMs. This is a country where property right matter – which is very important from an investment perspective – and where the populace values education.

He asked me about my views on India, and I said I was invested through private equity.

Private Investments

  • Do you do a lot of private equity? No
  • Why not? Money is completely out of my control when I do privates. I don’t look at my statements or read commentary. It’s meaningless. Only thing that matters is how much money I get back at the end. India is one place where I would do private equity.

    Snowball interjects: Joel Tillinghast, one of the greatest investors in Fidelity Investment’s history, is retiring from active management at the end of 2023. At the end of May 2023, he sat down for a long interview with Adam Fleck and Christine Benz of Morningstar. In it he was pretty caustic about the prospects of those who invested in US private equity.

    Private equity has lower reporting and regulatory requirements. It accepts much higher leverage than public companies. It doesn’t have to be continuously valued, which is marvelous for people who don’t want to be marked to market, which is a lot of people as Silicon Valley Bank showed. My personal guess is the ship won’t go much further. One Ivy League endowment, public American Equities, are just 2.25% of the endowment assets. So small caps are a niche asset within this niche asset class. For comparison, the university holds about 10 times as much as that 2.25% in leveraged buyouts, and they also hold about 10 times as much in venture capital. The horse is already out of the barn.

    What’s amazed me is how high private equity, and hedge fund, and all the other chic things that the Ivy League endowments go for—how high the fees are. The Ivy League needs a Jack Bogle moment. (Joel Tillinghast: The Art of Investing, 5/30/2023).

    That was generous, compared to Jason Zweig’s acidic take of private investments that are publicly available (“No one is checking to see if the details in these [regulatory] filings are even remotely true,”4/7/2023) and the funds that tout them (“Imagine an investment that can deliver high returns with barely any risk, almost completely independent of the stock market. Good luck finding that. But you can easily find funds that make such grandiose claims. They’re common in one of the hottest areas in markets today, private investments,” 4/28/2023).

Real Estate Investment Trusts (REITs)

  • View on Real Estate Investment Trusts (REITs): Terrible investments
  • Why? They are serial diluters. They keep issuing stocks all day long. No way to make money.
  • How do you do real estate? Through private investment.

    Snowball interjects: Taylor Swift, likewise. I wonder if they’ve met. Regardless, you might want to check out our article “Taylor the Investor: You Belong With Me.” She’s also into closed-end funds.

Inflation

  • Views on inflation: Read David Buckham’s The End of Money (2021). We are scr***d.

Bonds

  • TIPS: Not good investments.
  • Why? They don’t capture services inflation.
  • NY Munis: Better investments, given the tax angle.
  • What should I have more of? Munis > TIPS

Strategic vs Opportunistic

Me: You have identified a lot of problems with a lot of conventional assets. Where’s your money in?

David: I am very opportunistic. If I don’t see something obvious and big, I keep my money in cash. I don’t have to invest.

Mutual Fund Observer

  • Thoughts on MFO: Great community. Not enough young people in the community. Fix that.
  • How? Write more columns for young people. Market. You can’t just write. You have to market what you write.
  • What do you want written? Health Savings Account (HSAs). Please tell young people about them. It’s the best tax advantaged vehicle out there. I love them.

David made sure I ordered dessert – an Olive Oil cake with caramelized kumquats. He paid for our meal and insisted we walk off the dinner with a stroll around the Museum of Natural History. He explained to me how he thinks of his funds, his investors, challenges with the fund management industry, and the fund rating systems.

“You know what people want, right,” asked David. With David, questions posed are a pause which he answers with my silence.

“POSITIVE BETA,” he emphasized. “ALPHA seems less important to them.”

Snowball’s final interjection: “Positive beta” describes an investment that moves in the same general direction as the market. “Alpha” refers to peer-beating returns. You could think of a preference for positive beta as a sort of fear of missing out (FOMO) impulse; you don’t need to be at the front of the pack, but you certainly want to be in the race.

More than once, he made fun of me for sitting on my ass while he has to “work hard for a living” and reminded me to get on with my life now that my kids are grown-up teenagers and no longer need me. I said I’d sit down and write a column about that.

Recession Watch

By Charles Lynn Bolin

The Chronology of the Economic Cycle provided by Joseph Ellis in Ahead of the Curve is an interesting chart that shows the ripple effect from left to right of inflation and interest rate increases across the economy over the next six to twenty-seven months. In Figure #1, I added my subjective assessment of whether the indicator level is currently positive (blue +) or negative (red -) for the Investment Environment and the direction of change, whether it is improving (red up arrow) or softening (red down arrow). Most of the indicators are softening, but not at a level to be considered negative (contracting) for the Investment Environment, in my opinion.

Figure #1: Chronology of the Economic Cycle from Ahead of the Curve  

Source: Ahead of the Curve by Joseph Ellis

The Conference Board produces a Leading Economic Index, which “provides an early indication of significant turning points in the business cycle and where the economy is heading in the near term.” The assessment from Justyna Zabinska-La Monica, Senior Manager of Business Cycle Indicators at The Conference Board is:

“The LEI for the US declined for the thirteenth consecutive month in April, signaling a worsening economic outlook. Weaknesses among underlying components were widespread… Importantly, the LEI continues to warn of an economic downturn this year. The Conference Board forecasts a contraction of economic activity starting in Q2 leading to a mild recession by mid-2023.”

In other words, The Conference Board believes that the data for the quarter just ending will come in weak enough to signal that a recession is beginning in the middle of this year.

I built my Investment Model (Figure #2) around the concepts in this book, among others. I use one hundred and twenty-eight sub-indicators composited into thirty-four main indicators, which do not exactly align with those of Mr. Ellis. I include indicators not shown in the chronology of the business cycle by Mr. Ellis for Banking, Monetary Policy, Financial Risk, and Valuations, among others.  The goal of the Investment Model is to maximize risk-adjusted returns, which reduces “Sequence of Return” risks due to high drawdowns. The Model currently suggests about thirty-five percent allocated to stocks, thirty percent allocated to short-term cash equivalent investments, thirty percent allocated to bonds, and five percent allocated to defensive investments such as gold.

Figure #2: Allocation View of the Author’s Investment Model

Source: Author

I have selected five of my indicators to discuss which are close to those covered by the red squares representing Consumer Borrowing, Real Consumer Spending, Industrial Production, Corporate Profits, and Employment (Jobs). They are arranged starting with the shortest lag time (Consumer Borrowing/Health) to the longest (Employment). I roll up the Chronology into a single “Declining” Indicator which is based on the percent of the months over that past year that are negative. The last section is about the risk of a recession occurring.

Real Gross Domestic Product

Before we look at the indicators, let’s take a look at the economy through the lens of the Federal Reserve as provided by the Philadelphia Federal Reserve Survey of Professional Forecasters for the second quarter. Like The Conference Board, the Philadelphia Federal Reserve Survey estimates a significant slowdown in growth (Real GDP) in 2023 with GDP growth being nearly zero in the third and fourth quarters. This suggests a mild recession. The economists also estimate that the probability of a negative quarter for each of the quarters in 2023 to be between 39% to 45%. In addition, the New York Federal Reserve estimates that there is a 68% probability of a recession by April 2024 based on the yield curve.

Table #1: Median Forecasts for Real GDP, Unemployment, and Payrolls

Consumer Borrowing

The average consumer can only continue to spend if they have the income or savings to pay for this spending or the ability to borrow money. Figure #3 is my composite Consumer Health Indicator which attempts to measure the consumer’s ability to keep spending. The cost of borrowing has risen, consumers are becoming delinquent on payments, and banks are tightening their lending standards. I believe that the Consumer’s ability to keep spending is negative at the moment. This indicator does not take into account that pandemic-era savings are being depleted nor that student loan payments that were suspended during the pandemic will be resuming.

Figure #3: Consumer Health

Source: Author Using St. Louis Federal Reserve FRED Database

Real Consumer Spending

If the consumer is getting stretched, we would expect to see a decline in the real growth rate of consumer spending as we indeed are, as shown in Figure #4. Real Retail Sales (adjusted for inflation) have been flat since March 2021. Retail sales are not keeping up with inflation. I include Real Personal Consumption Expenditures with a separate GDP Indicator. I consider Real Consumer Spending to be slightly negative and softening.

Figure #4: Real Retail Spending

Source: Author Using St. Louis Federal Reserve FRED Database

Industrial Production

My Production Indicator includes industrial production, inventories, shipments, and capacity. It should be no surprise that production is softening. Orders, as a separate indicator, are a leading indicator of production, and they have deteriorated more rapidly than production, as you would expect, as the economy slows.

Figure #5: Industrial Production

Source: Author Using St. Louis Federal Reserve FRED Database

Corporate Profits

In the Berkshire Hathaway annual meeting in May, Warren Buffett said that many of its businesses have an inventory build-up that will have to be reduced by sales, according to Yun Li at CNBC. Mr. Buffett says that “the majority of our businesses will actually report lower earnings this year than last year.” Giulia Carbonaro reported in Newsweek that Berkshire Hathaway sold $13 billion worth of stock. Mr. Buffett believes that “With economic uncertainty and earnings pressures, the time is right for investors to have increased Treasury exposure.”

According to Farah Elbahrawy at Bloomberg, first-quarter profits of S&P 500 companies have fallen for the second quarter and are estimated to have dropped 3.7% compared to a year ago. Ms. Elbahrawy says that a “slowing economy is exerting a toll on profit margin.” In addition to lower profits, bankruptcies are on the rise. According to S&P Global Market Intelligence, there have been 236 corporate bankruptcy filings year to date, which is the highest since 2010. These are concentrated in consumer discretionary, industrial, financial, and healthcare sectors. According to Jennifer Sor at Markets Insider, Bank of America says that corporations may default on $1T in debt in the event of a recession and credit tightening.

My Corporate Health Indicator includes measures of profit, productivity, sales, and the prime rate. I estimate Corporate Health to be negative and worsening rapidly.

Figure #6: Corporate Health

Source: Author Using St. Louis Federal Reserve FRED Database

Employment (Jobs)

Year-over-year employment growth has slowed from 5% in the first quarter of 2022 to 1.8% in the first quarter of this year. “Layoffs and Discharges” have almost returned to pre-pandemic levels. Challenger, Gray & Christmas reports that employers have announced plans to cut 337,411 jobs this year, which is an increase of 322% compared to the first four months of 2022.

My Employment Indicator, shown in Figure #7, measures only whether people can find employment, not considering the quality of the work. Temporary Help Services often serves as the canary in the coal mine, giving advance warning of declining labor conditions and working hours being reduced. I estimate that employment has softened almost to the point of being a negative for the Investment Environment.

Figure #7: Employment

Source: Author Using St. Louis Federal Reserve FRED Database

Chronology of the Economic Cycle Rolled into One

The Declining Indicator is calculated differently than most of my other indicators. It is based on the percent of the months during the past year that indicators had negative growth. Collectively, the indicators have peaked, and the decline in the economy is broad based. Matthew Fox at Market Insider provides a deeper dive into indicators in “These 7 Charts Show That a Recession Could Hit The US Economy In The Next Few Months”.

Figure #8: Declining Indicator

Source: Author Using St. Louis Federal Reserve FRED Database

Buckle Up for a Recession

Money supply is contracting to control inflation which will likely result in higher unemployment and lower borrowing and consumer spending. Credit bubbles tend to have hidden consequences that are not known until the tide goes out. In addition to a probable recession, there is a trilogy of problems, including banking failures, a debt ceiling debacle, and high government net interest costs. Kelly Evans at CNBC warns that the debt ceiling is just “Act One,” and the next issue is likely to be austerity over high government net interest costs, which are now approaching fourteen percent of tax revenues. The consequences of austerity would likely be a headwind to economic growth for years to come.

PIMCO writes in this Seeking Alpha article that their base case is a recession in the US later this year, with the Federal Reserve pausing rate hikes. They are cautious because earnings expectations appear too high. They are underweight equities and “prefer to add high-quality duration at attractive levels, especially during sell-offs if inflation fears resurface”.

Figure #9 is my Recession Indicator. The New York Federal Reserve estimates that there is a 68% probability of a recession (black line) by April 2024, while the timely Chauvet-Piger Smoothed U.S. Recession Probabilities (blue line) estimates the current probability of a recession to be negligible. My own recession indicator (green line), which is intended to be a leading indicator of the Chauvet-Piger Smoothed U.S. Recession Probability Model, estimates the near-term probability of a recession to be 50%, but if the current trends continue, it rises to over 60% by the end of this year.

Figure #9: Recession Probabilities

Source: Author Using St. Louis Federal Reserve FRED Database

Closing Thoughts

On May 24th, Fitch Ratings Agency placed the United States’ AAA credit on “ratings watch negative” over the debt ceiling, according to Stephen Groves at Associated Press. Debt ceiling negotiations are progressing. Time is running short to meet the extended June 5th X-Date deadline. At the time of this writing, the stock market has been relatively stable, but Treasury yields have been rising, which provides opportunities to invest in bonds.

My strategy is to be overweight in quality bonds, certificates of deposit, and money markets, and underweight stocks, but still maintain a balanced, diversified portfolio. High yields are providing an incentive to increase allocations to quality bonds. As short-term ladders of Treasuries and Certificates of Deposits mature, I make small decisions to reinvest in bonds with longer durations or in the stock market. At the moment, I see opportunities in Treasuries and Agency bonds with durations of two years or less and Certificates of Deposits and Municipal bonds with durations of five years or less.

In May, I continued to add a small amount to the Columbia Thermostat Fund (Fact Sheet), which increases its allocation to stocks as the market falls. I also bought a modest amount of iShares Gold Trust (IAU) for diversification.

Best wishes during these uncertain times.

Taylor the Investor: You belong with me!

By David Snowball

Taylor Swift might be the swiftest young investor of her generation. Ms. Swift, 33, saw her net worth creep up over the past year, from $570 million at the beginning of 2022 to $740 million now. Most of that wealth is driven by the feverish desire of her fans, the 120,000,000 or so Swifties, to transfer their money to her. At the same time, she’s done prudent and profitable things with her wealth. Other young investors can learn from her reasoning and parallel her strategy.

(Well, give or take the “multi-platinum pop superstar” part of the strategy.)

America is beset by an appalling number of appallingly rich people. In 2023, for instance, Forbes magazine estimates that America leads the world with 735 billionaires worth a collective $4.7 trillion. (More than China and India combined. Take that, crazy rich Asians!) Many of them, and many of Ms. Swift’s peers, are classified as “high-beta rich.” They are rags to riches to rags people, often driven by delusions of their own brilliance or by the unexamined promises of vast wealth offered by others.

Ms. Swift, the child of a Merrill Lynch broker, seemed to have learned early on that “too good to be true” probably means “it’s a scam.” The most famous instance involves her refusal to partner with the (now disastrously) bankrupt cyber exchange FTX to sell NFTs to the Swifties. (Tickets for her June 2023 shows in Chicago were selling for as much as $5400 on the secondary market, so you know they would have bought them.) Reportedly, she asked one question that ended the discussion:

“Can you tell me that these are not unregistered securities?”

Oops. Game over, wealth preserved. (Cheyenne DeVon, CNBC, “Taylor Swift sidestepped FTX lawsuit,” 4/20/23)

Instead, Ms. Swift’s portfolio holds a lot of real estate, perhaps $150 million worth, and a slug of … discounted closed-end funds?

Yep. The news came from two sources with an interest in the matter: Boaz Weinstein, head of Saba Capital Management which invests in the same funds, and Scott Swift, Taylor’s dad, and a former Merrill Lynch vice president. (Hmmm, mom Andrea Swift used to be in fund marketing.) Here’s the tweet:

“Having a blast watching our daughter sing every lyric tonight in Philly. Did you know that @taylorswift13 invests in discounted closed end funds? You think I’m kidding, but her father, Scott, told me so!”

We’ll answer two questions:

  1. What on earth is a closed-end fund?
  2. How can I get them?

The closed-end fund primer

Closed-end funds are pooled investment vehicles, much like mutual funds (which are technically “open-end funds”) and exchange traded funds.

They differ from mutual funds in two important ways. First, they trade on the secondary market throughout the day, just like stocks or ETFs do. Because of that, each CEF publishes two share prices: the net asset value is what their holdings are worth, and the market price is what investors are willing to pay, this minute, for them.

Let’s say your fund, MFO Securities Trust, issued a million shares, and by happy coincidence, the total value of the securities it owns is $10 million right now. Every share would then have a net-asset value of $10.

But what if you’re feeling panicked and very much want to sell? Right! Now! How much cold hard cash would it take to get you to surrender your share? $10 is “right,” but markets are about psychology. You’d probably say “no” to a $5 offer, but you’d entertain a $8.50 offer and would snap up $9.00. If you sold at $9.00, the market price is $9.00, and the fund traded at a 10% discount to NAV.

Second, closed-end funds can use leverage to boost returns. CEFs can borrow money, using their portfolio as collateral, to buy extra shares of securities. By law, they can exercise leverage of between 1.3 – 1.5 times assets; that is, a $10 million fund can own up to $15 million worth of stuff. About two-thirds of CEFs use such tactics (Investment Company Institute, 4/2023).

They differ from ETFs in two important ways as well. First, the number of fund shares never changes. ETFs can issue more shares through “creation units” as time goes on, which allows them to stabilize demand for their products. Otherwise, there could be a bidding war for shares of a particularly attractive ETF, leading it to sell at a premium to its NAV; that is, people might pay $15 for a $10 share of the ETF just as they might pay $1200 – 5400 for a $300 Taylor Swift ticket. Second, closed-end funds can invest in illiquid securities to a far greater extent than ETFs or funds can. An illiquid security is something that you can’t reasonably expect to sell in a hurry; if, for example, you buy an apartment building, it might be a great investment, but it’s not one you can get rid of at a moment’s notice. Selling it is probably all-or-nothing (you can’t sell just the third floor), and it might take six months to find the right buyer. Funds and ETFs can hold only a tiny slice of their portfolios in such juicy opportunities; CEFs can go all-in (Baird & Co., 2021).

Upside: CEFs can get you access to investment opportunities that no one else can touch, and they can generate incredibly high yields by using leverage. The total distribution rate is a surrogate for the fund’s income yield; it includes all of the money returned to shareholders in a year, largely interest and dividends but occasionally return-of-capital.

  Total Distribution Rate
OFS Credit Company Inc 22.9%
Eagle Point Credit Company 19.0
Cornerstone Total Return Fund 18.6
Cornerstone Strategic Value Fund 18.6
Virtus Stone Harbor Emerging Markets Total Income Fund 18.5
Abrdn Income Credit Strategies Fund 18.0
Virtus Stone Harbor Emerging Markets Income Fund 18.0
Oxford Lane Capital Corporation 17.8
NXG Cushing Midstream Energy Fund 16.1
Abrdn Global Income Fund Inc. 15.9
Virtus Total Return Fund Inc. 15.9
XAI Octagon Floating Rate & Alternative Income Term Trust 15.7
RiverNorth/DoubleLine Strategic Opportunity Fund 15.0
Korea Fund 14.9
The Gabelli Multimedia Trust 14.7
Brookfield Real Assets Income Fund 14.7
Pimco Dynamic Income Fund 14.5
Neuberger Berman High Yield Strategies 14.4
John Hancock Tax Advantage Global Shareholder Yield Fund 14.3
Eagle Point Income Co 14.2
Guggenheim Strategic Opportunities Fund 13.9
CBRE Global Real Estate Income Fund 13.9
RiverNorth Opportunities 13.9
Principal Real Estate Income Fund 13.5
Clough Global Dividend And Income Fund 13.5
Saba Capital Income & Opportunities Fund 13.4

Downside: CEFs are involved in expensive operations and can be exceptionally volatile. That scares investors, and so CEF shares typically sell at a discount to their NAV. That is, you can routinely buy $10 worth of securities for $8.50! Which is great as long as someone else is willing to pay you more than $8.50 for that same share.

Here’s the special sauce: there are two reasons why people would pay you more than $8.50. Reason 1: the underlying stocks rose in value. Reason 2: the stocks did not rise in value, but panic passed, and investors were willing to pay something close to $10 for $10 worth of stock. If the market rises, you make money (just as in funds and ETFs), or if people just calm down, you make money (unlike in funds and ETFs). So discounted CEFs offer three drivers of return: the use of leverage, normal capital appreciation, and shrinking share-price discounts.

Investing in closed-end funds

The oldest of the CEFs dates back to the Great Depression. Some have been stellar performers for decades. Many offer access to distinctive and interesting asset classes. You have two options for purchasing them.

Option 1: buy CEFs, one by one, at any major brokerage.

Option 2: buy a mutual fund or ETF of CEFs run by discounted CEF specialists.

MFO Premium users can easily screen for exceptional CEFs and compare them side-by-side with open-end funds and ETFs. (Morningstar users, not so much. Sorry, guys.)

Closed-end funds with the highest 20-year Sharpe ratios

  Lipper Category APR MAX Drawdown Sharpe Ratio Great Owl? ER Assets
Barings Participation Investors General Bond 10.8 -10.8 1.23 Yes 2.09 159
Barings Corporate Investors General Bond 10.9 -21.8 0.97 No 2.09 332
TCW Strategic Income Income & Preferred Stock 7.7 -28.6 0.75 No 1.02 243
Allianz PIMCO Corporate & Income Opportunity General Bond 11.6 -46.9 0.68 No 1.13 1,514
MFS Charter Income Trust General Bond 5.4 -17.1 0.67 No 1.37 300
Rocky SRH Total Return Inc Diversified Equity 9.9 -33.2 0.67 No 1.61 1,542
Central Securities Corporation Diversified Equity 10.3 -45.7 0.66 No 0.50 1,178
MFS Multimarket Income Trust General Bond 5.9 -18.1 0.65 No 1.40 292
AllianceBernstein Global High Income High Yield (Leveraged) 8 -30.7 0.64 No 1.00 915
Allianz PIMCO Strategic Income Global Income 6.9 -24.5 0.63 No 1.44 199
Vanguard Total Stock Index Core Stock 10.1 -50.9 0.58 No 0.14 1.25 trillion
Vanguard Total Bond Index Core Bond 3.0 -17.6 0.44 No 0.15 300 billion

Source: MFO Premium fund screener / Lipper Global Datafeed, through 04/2023. We’ve included Vanguard’s Total Stock and Total Bond Market Index funds for comparison. In Sharpe ratio terms, Total Stock did fine, and Total Bond lagged the CEF universe.

But remember: six out of seven CEFs sell at a discount to NAV. Top-rated Barings Participation sells at a 15% discount, and #2 Barings Corporate sells at a 16.58% discount. Central Securities trades at a 15.22% discount (per Fidelity CEF screener, 6/2023). The key is finding one whose discount is temporary. That’s where Option 2: Funds of CEFs comes in.

Several firms offer funds whose portfolios are made up of discounted CEFs. In theory, each fund has a target allocation (“50% domestic equities, 10% international equities, 40% fixed income”), and they identify the CEFs in that space that are suffering from temporary large discounts to NAV. Ideally, they find a fund that normally sells at a 10% discount but which this week can be purchased for a 20% discount. With luck, the discount will shrink back to 10%, and investors will pocket a handy, market-neutral gain.

Three funds – two open-ended and one ETF – offer experienced teams and balanced CEF portfolios. Because the youngest of those funds, Saba, just launched in 2017, we’re providing just a five-year profile.

Five-year performance

  APR STDEV DS DEV MAX DD Sharpe Ratio Ulcer Index 60/40 Up Cap 60/40 Down Cap 60/40 Capture ER Assets
Saba Closed-End Funds ETF 7.2 17.1 12.5 -25.2 0.33 6.4 102 105 0.97 2.42 102
Vanguard STAR 6.3 13.7 9.4 -23.8 0.35 8.3 101 109 0.92 0.31 22 billion
Matisse Discounted Closed-End Strategy 5.6 21.1 16.2 -37.1 0.19 10.3 115 136 0.85 2.48 37.1
RiverNorth Core Opportunity 4.7 15.9 11.9 -25.5 0.20 8 96 113 0.85 3.56 45.4

Source: MFO Premium fund screener / Lipper Global Datafeed, through 04/2023. We’ve included Vanguard STAR, a balanced fund of actively managed Vanguard funds, as a benchmark.

Measured by five-year performance, Saba Closed-End Funds ETF has offered higher returns (APR) and higher risk-adjusted returns (Ulcer Index, 60/40 capture ratio) than its peers. Its diversified, actively managed, and hedges its interest rate risk.

RiverNorth is the Grand Old Man of the group, offered by a firm that specializes in CEFs, has a high visibility partner in DoubleLine, and even offers CEFs of CEFs. Matisse offers both tactical and income-oriented versions of its strategy and does an exceptional job of explaining the closed-end fund universe for potential investors. They’re worth exploring.

But remember: expense ratios tend to be high because they’re investing in underlying CEFs, which charge a lot for their specialized services, and the funds are intrinsically volatile. Remember, you’re buying these (partly) in hopes of exploiting volatility. Your managers are targeting funds that have been irrationally punished, but they can’t guarantee that the punishment will end the moment they arrive.

Bottom line

A rising tide lifts all boats. When tides are rising, and the weather’s good, you’d be wise to find the cheapest sturdy boat you can. Buy a total market index fund and get back to having a life.

But when the tide is not rising, or the seas are surging, you might be served by paying for a fancier boat or a more complex strategy. In theory, CEFs and funds of CEFs give you two market-neutral sources of return: leverage and discount contraction.

The Young Investor’s Secret Weapon: The HSA

By Mark Freeland

Many things in life suck. High on anyone’s list would be:

  1. Health insurance costs
  2. Taxes
  3. Being poor
  4. Ketchup-flavored Doritos. (And you know some mad scientist will have, like, mayo-flavored ice cream in the pipeline next.)

When it comes to Frankenfood, you’re on your own, but there’s major good news about the other three. It’s called a Health Savings Account, and it’s the partner of a High Deductible Health Plan. Between the two of them, you can cut – perhaps dramatically – your health insurance costs, cut your taxes, and build a substantial investment account that can pay for health care now and retirement later.

While there are rules (duh), there are very few catches. We’ll walk you through it.

The TL;DR version

When you’re young, you’re mostly healthy, which makes traditional health insurance an expensive money-loser for you. Your best move might be a lower-cost plan with a high deductible. Those plans would cover normal preventive care (your annual physical, for example) the same as always, but they would give you the responsibility of covering the first $1700 of other care (from acupuncture visits to kidney dialysis) on your own. Good news #1: you’re healthy. Good news #2: you can set up a tax-deductible health savings account to cover the cost. If you don’t spend the money this year, no problem. It rolls over next year and keeps building until you hit 65 and can use it for retirement income.

Health Savings Accounts, in more detail

Health savings accounts (HSAs) are an interesting financial vehicle. They provide taxpayers the ability to get a tax break on healthcare expenses without itemizing deductions and perhaps even serve as a longer-term tax shelter. In the latter sense, they are often marketed as super duper Roths – tax-free upon withdrawal but also tax-deductible when contributing.

Like 401(k)s, they may be offered by employers who sometimes contribute to them. Like IRAs, they may be used outside of an employer plan. Like both 401(k)s and IRAs, they have their own contribution limits, including a “catch-up” provision for older people.

Unlike 401(k)s and IRAs, HSAs are designed with a non-retirement purpose in mind. They are coupled with what are called “high deductible” health plans (HDHPs). HSAs help cover healthcare expenses that insurance doesn’t cover (i.e., “out-of-pocket” costs). That makes HSAs especially helpful with healthcare expenses incurred before meeting a high deductible, which is when one must pay 100% of the charges.

I start below with an introduction to what HSAs are and how they work; then move on to eligibility, i.e., the HDHP requirement and considerations there; then how one might use an HSA for tax savings and/or as a long-term investment vehicle; and finally offer some thoughts on searching for HSAs. Along the way, rules will be mentioned frequently because there are so many rules.

What Health Savings Accounts Are

Reasons for HSAs

A health savings account is a type of account, much like an IRA, that allows one to save or invest money that is tax-sheltered. The money is to be used to pay for medical expenses incurred any time after one opens their first HSA. In order to contribute to an HSA, one must have a high-deductible health plan and only a high-deductible plan. This restriction creates an incentive for people to subscribe to high-deductible plans.

In turn, the theory of high deductible plans is that they encourage people to use healthcare services more judiciously. People receiving healthcare are required to pay their own way until a high deductible is met. The more skin one has in the game, the more carefully one is expected to shop, and the more hesitant one is likely to overuse services. On the other hand, one has limited control over when healthcare is needed, and disincentives to use care even when appropriate do not necessarily encourage making the best decisions about receiving care.

Here is a fairly recent (2017) meta-study concluding that both of these perspectives have merit. Regardless of your opinion of this system, this is what we have to work with.

Contributing to HSAs

The rules for contributing to HSAs are somewhat like IRA contribution rules. One gets to deduct contributions, and there are maximum contribution limits per year. These are adjusted annually for inflation. What is different is that there is one limit for people with an individual HDHP covering only themselves and a higher combined limit for spouses who are instead covered by a family plan. Spouses can split their combined limit between their HSAs in any way they choose.

For some more unusual situations, including ex-spouses and domestic partners, here is a good two page summary of the issues involved.

Employer contributions and employer HSAs

Employers may decide to contribute money to their employees’ HSA accounts. Like employer contributions to a 401(k) plan, this is “free” money. But unlike 401(k) plans, employees are not stuck leaving the money in a poor (e.g., high-cost) plan. HSAs can be transferred at any time. One can wait for an employer contribution and then transfer some money out. Watch out for transfer fees that some plans charge.

Withdrawing money from HSAs

The basic rule is that so long as one can identify a past eligible expense incurred after opening an initial HSA, then one may withdraw that expense amount tax-free. One can look back years or even decades to find an eligible expense. So hold on to those bills and receipts until they are no longer needed.

Generally, eligible health expenses are ones that can be used as itemized deductions. One’s own expenses and those of one’s spouse or dependents all count. A notable exception is that health insurance premiums aside from Medicare premiums are generally not eligible expenses.

One may withdraw money anytime, with or without having matching eligible expenses. If there are no matching expenses, taxes are charged on withdrawals. Also, if one is under age 65 (not 59½), there is also a 20% penalty. So these withdrawals are like early IRA withdrawals, where taxes and penalties depend on age.

High Deductible Health Plans, in more detail

There is no need to go into details on high deductible plans. Suffice it to say they are what they sound like, plans where no coverage (except for preventive care) is covered before one meets a high deductible. However, for 2023 and 2024, these plans are allowed (not required) to offer telehealth services without requiring the deductible to have been met first.

From a planning perspective, it is important to weigh the benefits of an HSA against the costs and risks of a high-deductible health plan. People who are very healthy may benefit from a high deductible plan. If they don’t spend enough to meet even a low deductible, they will not pay more out-of-pocket with a high deductible plan. Conversely, people who have serious problems may reach the out-of-pocket spending limits of any plan; for them, what matters is the total cost (premiums plus out-of-pocket cap), not the size of the deductible.

For everyone else, and that is many of us, it is a balancing act. Consider the tax benefits one receives with an HSA and compare them with the potentially higher healthcare costs one could pay because of the higher deductible.

Everyone assumes that with high deductible plans, at least one gets the benefit of a lower premium. That’s often the case, but not always. Also, don’t assume that plans ineligible for HSAs have low deductibles. Even if its deductible is lower than a comparable HSA-eligible plan, the deductible can still amount to several thousand dollars. So shop carefully.

Uses of an HSA

There are two main types of HSA users: those who use HSAs to pay health expenses as they go along and those who use HSAs as long-term investment vehicles. These are not mutually exclusive, as someone who is in good health may pay expenses out of the HSA while still having money left over for long term investment.

A third type of HSA user is a saver – one who, like an investor, accumulates money but, unlike an investor, prefers cash accounts to investment accounts. It is the same idea, just focused on a different asset class.

Someone using an HSA primarily to pay for current expense benefits by getting a tax deduction for contributions. The money is withdrawn soon, so there is not much growth involved. This class of users is likely more concerned with liquidity, ease of use, low fees, and decent interest than with investment options.

With these considerations in mind, an HSA bank account or brokerage account with a good money market fund are appropriate choices. Ease of use means good record keeping, especially since there may be many transactions as health providers are paid. Also, the ability to pay providers directly (checks or debit cards) is desirable.

Those using HSAs as pseudo-IRAs benefit not only from the initial tax deduction but from tax-exempt earnings like a Roth. For these users, investment options and fees of a provider are likely paramount. Whether the provider requires some money to be kept in a cash account or allows 100% of the account to be invested is also of major concern. Ease of use is not as important, as investors are more inclined to take significant withdrawals as opposed to relatively petty cash to pay healthcare providers.

How to get one for yourself: Fidelity and the rest of the pack

HSA accounts are a niche market. Historically, HSAs offered directly to individuals rather than through employers came with high costs and limited options. When HSAs were created two decades ago, nearly all providers were banks or credit unions. Searching for providers then meant just looking for one offering a decent rate of interest and low or no fees. Later, providers started offering mutual fund investments, though Investment options were limited, much like early 401(k)s.

The landscape changed radically when Fidelity entered the retail market with a “regular,” free brokerage account (including an HSA debit card). Readers here are at least somewhat familiar with Fidelity, and so already know what to expect with this HSA. It serves as a good benchmark, even if one prefers a different provider.

For example, if one wants to invest in Vanguard open-end funds, Fidelity may not be the best provider to use. Buying Vanguard funds is expensive at Fidelity. HSA Equity is a provider offering Vanguard funds while charging 0.36%/year of dollars invested to administer the account. It also requires a customer to keep $500 in a cash account. HSA Authority (recently moved to UMB Bank) offers funds from Vanguard and some other fund families. It charges $36/year to invest in funds.

HSA providers tend to come in three different flavors. One type operates like a bank, offering only cash options. Many of these providers are, in fact, banks and credit unions. None pays great interest. One of the better options is Liberty Federal Credit Union, formerly Evansville Teachers Federal Credit Union. As of June 1, 2023, its HSA checking account yields about 2%, and it has 2-5 year HSA CDs yielding 3.05%

A second flavor offers a menu of fund options, often using institutional class shares. These may or may not come with brokerage windows. Those windows, in turn, may or may not come with additional fees. An example of a provider offering only a fixed list of funds is the aforementioned HSA Authority, now called UMB HSA Saver®.

A highly rated startup that offers a brokerage window as well as a fixed menu of funds is Lively. When it first began, it offered a brokerage account through TD Ameritrade and seemed to be a good competitor for Fidelity in terms of pricing and services. It has switched to Schwab (not a surprise, given that Schwab has purchased TD Ameritrade), but has also added a $24 annual fee to use this brokerage option. Alternatively, Lively gives the option of keeping $3,000 in a cash account to avoid the fee.

The third flavor is a provider offering brokerage services without also offering a separate platform with a “curated” set of funds to choose from. There are few HSA providers of this type. Fidelity is perhaps the only “pure” brokerage provider. A small number of other providers partner with brokerages. An interesting and very new fintech startup is First Dollar. It is generally fee-free, though one should take care not to let it go inactive for more than a year, when a high ($5) monthly fee kicks in. It originally partnered with TD Ameritrade and, as Lively has, or will shortly, transition to Schwab.

Some resources for researching HSA providers are:

The Bottom Line

“Young, dumb and broke” is not nearly as cool as Khalid makes it sound. Pursuing the HDHP+HAS combo might leave you young, smart, and well-funded. And really, how much might it be worth to look at one of your friends with a shocked (shocked!) expression and go, “Dude, you don’t have an HSA? That’s dumber than when you bought that flip phone because it would be you all retro-sexy. If you got your s**t together, I wouldn’t be the one stuck paying for all the pizzas.”

There are many rules involved in using HSAs though they can be summed up as qualifying with a high deductible health plan, contributing no more than the maximum allowed, and pairing each dollar withdrawn with an eligible health expense. Shop carefully for that high-deductible plan. Finally, use a provider that best fits the type of HSA user you are – an investor or pay-as-you-go customer.

Leuthold Core Investment (LCORX/LCRIX), June 2023

By David Snowball

Objective and strategy

Leuthold Core pursues capital appreciation and income through the use of tactical asset allocation. The objective is to avoid significant loss of capital and deliver positive absolute returns while assuming lower risk exposure and lower relative volatility than the S&P 500. Assets are allocated among stocks and ADRs, corporate and government bonds, REITs, commodities, an equity hedge, and cash. Portfolio asset class weightings change as conditions do; exposure is driven by models that determine each asset class’s relative and absolute attractiveness. Equity and fixed-income exposure each range from 30-70% of the portfolio. As of April 1, 2023, the portfolio had a net exposure to equities of 50%, which was the balance of a 63% equity exposure offset with a 13% equity hedge.

Adviser

Leuthold Weeden Capital Management. The Leuthold Group began in 1981 as an institutional investment research firm. Their quantitative analyses eventually came to track several hundred factors, some with data dating back to the Great Depression. In 1987, they founded LWCM to direct investment portfolios using the firm’s financial analyses. As of December 30, 2022, they managed about $1.1 billion through four mutual funds, an ETF, separate accounts, and a limited partnership.

Manager

Doug Ramsey, Chun Wang, Greg Swenson, and Scott Opsal. Mr. Ramsey joined Leuthold in 2005 and is their chief investment officer. Mr. Swenson joined Leuthold in 2006 from FactSet Research. Mr. Wang joined in 2009 after a stint with a Hong Kong-based hedge fund and serving as director of research & development for Ned Davis Research. Mr. Opsal is Director of Equities and Director of Research for The Leuthold Group. He has been twice named as one of Barron’s Top 100 Mutual Fund Managers. In a previous life, he was Director of the Applied Investments Program and finance professor at the University of Wisconsin ̶ Whitewater. Collectively the team shares responsibility for testing and refining the firm’s quantitative models and for managing Core Investment, Core ETF, Select Industries, and Global.

Strategy capacity and closure

About $5 billion, although they will soft close in advance of that level so as to maintain ongoing capacity for existing clients. Core was hard closed in 2006 when it reached $2 billion in assets. Following Steve Leuthold’s retirement, the managers studied and implemented a couple of refinements to the strategy (somewhat fewer but larger industry groups, somewhat less concentration) that gave the strategy a bit more capacity.

Management’s stake in the fund

The fund’s four managers all have investments in the fund, with Mr. Ramsey over $1 million and his colleagues all in the range of $100,000 – 500,000. Three of the fund’s four directors have invested substantially in the fund or in a separately managed account whose strategy mirrors the fund’s.

Opening date

November 20, 1995.

Minimum investment

$10,000, reduced to $1,000 for IRAs. The minimum for the institutional share class (LCRIX) is $1,000,000.

Expense ratio

1.38% on retail shares and 1.30% on institutional shares on assets of $513 million, as of July 2023. 

Comments

Leuthold Core Investment was the original tactical asset allocation fund. While other, older funds changed their traditional investment strategies to become tactical allocation funds when they came into vogue in the 2010s, Leuthold Core has pursued the same discipline for nearly three decades.

Core exemplifies their corporate philosophy, “Our definition of long-term investment success is making money . . . and keeping it.”

It does both of those things. Here’s how:

Leuthold Group’s asset allocation funds construct their portfolios in two steps: (1) asset allocation and (2) security selection. They start by establishing a risk/return profile for the bond market and establishing the probability that stocks will perform better. That judgment draws on Leuthold Group’s vast experience with statistical analysis of the market and the underlying economies. Their “Major Trend Index,” for example, tracks over 100 variables. This judgment leads them to set the extent of stock exposure. Security selection is a twofold strategy: 1) identify attractive equity industries and themes, then 2) select a basket of the theme’s underlying individual stocks with well-rounded attributes that appear poised for leadership.

Core focuses on industry selection, and its equity portfolio is mirrored in Leuthold Select Industries (LSLTX). Leuthold Group uses its quantitative screens to run through 115 industry-specific groups composed of narrow themes, such as Airlines, Health Care Facilities, and Semiconductors, to establish each group’s quantitative investment appeal. Core and Select Industries choose group investments from among those rated attractive per the model. Mr. Ramsey notes that out of the 115 group universe, only those industries in the top 20% of the ratings are viewed as attractive and considered for investment; currently, they have positions in 16 of them. Within the groups, they target attractively priced, financially sound industry leaders. Mr. Ramsey’s description is that they function as “value investors within growth groups.” They short the least attractive stocks in the least attractive industries.

Why should you care? Leuthold Group believes that it adds value primarily through the strength of its asset allocation and industry selection decisions. By shifting between asset classes and shorting portions of the market, it has helped investors dodge the worst of the market’s downturns.

We can measure that ability using a series of risk and risk-return measures. Leuthold Core Investment is above average by every measure we track. That’s too weak. Let’s be clear: they’re not just “above average.” By every measure of risk and risk-return balance, they are elite. They have outperformed their Lipper Flexible Fund peers by 1.5% annually for the decade. More importantly, they have done so with dramatically less volatility.

There are 105 “flexible portfolio” funds and ETFs with a 10-year record. For the purpose of comparison, we will look only at flexible funds that have managed to return 5% or more, approximately the top 50% of all flexible funds.

Ten-year performance vs. all “flexible portfolio” funds returning 5% or more APR

Annual Percentage Return 6.1% Average annualized returns for the period
Maximum drawdown Top fund Measures an investment’s deepest loss
Ulcer Index Top fund A risk-return measure focused on the downside; it measures both the depth and duration of a fund’s greatest loss
Sharpe ratio #4 of 51 The most widely cited measure of risk-adjusted performance
Standard deviation #2 of 51 A measure of “everyday” volatility, both upside and downside
Downside deviation #2 of 51 A measure of “bad” volatility, focused only on the downside
Down market deviation #2 of 51 A measure of downside volatility in declining markets
Bear market deviation #2 of 51 A measure of downside volatility in bear markets
Capture ratio, S&P 500 #3 of 51 A “bang for the buck” ratio of how much of the S&P 500’s upside you capture versus how much of the S&P’s downside you do.
Downside capture, S&P 500 #2 of 51 A measure of how much of the S&P 500’s losses, or downside, you capture
Capture ratio, 60/40 #4 of 51 A “bang for the buck” ratio of how much of the typical 60/40 hybrid’s upside you capture versus how much of its downside you do.
Downside capture, 60/40 #2 of 51 A measure of how much of the 60/40 hybrid’s losses, or downside, you capture
Beta, S&p 500 #2 of 51 A measure of how much of the S&P 500’s volatility you experience.  49% in this case.

Source: MFO Premium and the Lipper Global Datafeed, data through April 2023

Leuthold Core Investment uses the S&P 500 as a benchmark for its objective of producing “total return in amounts attainable by assuming only prudent investment risk over the long term.”

They have accomplished that goal.

Comparison of Lifetime Performance (12/1995 – 04/2023)

  Annual return Maximum Drawdown Standard deviation Downside deviation Ulcer Index Sharpe Ratio
LCORX 7.8 -36.5% 10.4% 7.1% 8.0 0.55
S&P 500 9.3 -51.0 15.5 10.7 15.4 0.47
  83% 71% 67% 66% 1.9x 1.17x

Source: MFO Premium. See definitions in the table above.

In summary: since inception, Leuthold has captured more than 80% of the S&P 500’s annual returns while exposing its investors to less than 70% of the volatility. As a result, Leuthold’s risk-adjusted returns are between 1.2 to 1.9 times greater than the S&P 500’s.

Bottom Line

At the Observer, we’re always concerned about the state of the market because we know that investors are much less risk tolerant than they think they are. The years ahead seem particularly fraught to us. Lots of managers, some utterly untested, promise to help you adjust to quickly shifting conditions. Leuthold Core has delivered on such promises more consistently, with more discipline, for a longer period than virtually any competitor. Investors who perceive that storms are coming but who don’t have the time or resources to make frequent adjustments to their portfolios should add Leuthold Core to their due-diligence list.

Variation on a theme

Investors who are impressed with Core’s discipline but would like a simplified version of the portfolio should consider the Leuthold Core ETF (LCR), an actively managed fund of funds that was launched in 2020. Those seeking a higher degree of international exposure should investigate Leuthold Global (GLBLX/GLBIX). Global applies the same disciplines as Core but starts with a universe of 5000 global stocks rather than the 3000 domestic-plus-ADRs universe. As of March 31, 2023, Global is 60% equities (25% US, 35% international), while Core is about 60% equities with a 52% US / 8% international split.

Three-year performance comparison

  APR Maximum drawdown Standard deviation Sharpe ratio ER Yield Correlation to LCORX
Leuthold Core Investment 8.5 -12.9 9.6 0.77 1.38 0.3 1.0
Leuthold Global 8.1 -14.5 10.4 0.66 1.91 1.5 .97
Leuthold Core ETF 7.8 -12.8 9.5 0.69 0.85 0.7 .97

Source: MFO Premium

Fund website

Leuthold Funds

© Mutual Fund Observer, 2023. This article reflects publicly available information current at the time of publication. The views and opinions expressed in this article are those of David Snowball of Mutual Fund Observer and do not necessarily reflect the views of the Leuthold Group or its employees. Leuthold Group has no editorial control over the content of the article or subject matter and is independent of Mutual Fund Observer.

Briefly Noted . . .

By TheShadow

Jamie Cuellar, CFA, passed away unexpectedly and tragically on May 8. He was the co-portfolio manager of the Buffalo Small Cap Fund from 2015 and of the Buffalo Discovery Fund from April 2020. Our condolences to his family, friends, and co-workers.

Capital Group, parent of the American Funds and, with $2.6 trillion AUM, one of the world’s largest investment managers, has registered two exchange-traded funds, Capital Group Core Bond ETF and Capital Group Short Duration Municipal Income ETF. Management and operating expenses have not been stated in the registration filing.

Fiera Capital has sold its investment advisory business relating to International Equity, Capital Global Equity, and U.S. Equity Long-Term Quality Funds to New York Life Investment Management. A shareholder meeting will be held in August 2023 to consider the reorganizations.

Franklin Templeton is acquiring Putnam Investments for about $925 million in a cash plus equity deal. Putnam began life during the Great Depression as the adviser to the George Putnam Fund of Boston, the first balanced or hybrid mutual fund. $136bn asset manager Putnam Investments. The firm was entangled in a series of scandals from 2003 – 06, which led it to be bought by the insurer Great-West LifeCo and its parent Power Corporation of Canada. Since then, it has mostly been staggering about with undistinguished mainstream funds, adding alt funds, then dropping alt funds, adding absolute return funds, then dropping absolute return funds, and belatedly adding ETFs, mostly in support of their retirement-oriented funds.

Manning & Napier is converting the Callodine Equity Income Fund, LP, into a mutual fund with painfully high expenses (1.70 – 2.10%). The goal is “to provide strong risk-adjusted total returns with low market correlation and preservation of capital.” The hedge fund returned 1.47% in 2022, a year in which its benchmark S&P 500 High Dividend Index dropped 1.11%.

MainStay Funds is up to something. It probably involved ChatGPT or AI or something, but according to an SEC filing, they’ve launched “Project Beatles.”

The ETF Conversion Beat: Matthews Korea Fund will be reorganized into an exchange-traded fund. On or around June 20, the investor class shares will be converted into institutional class shares. Subsequently, on or around June 23, the institutional shares will undergo a reverse stock split.

The ETF Conversion Two-Step: Neuberger Berman Greater China Equity and Neuberger Berman Global Real Estate Funds will be converted into exchange-traded funds. Prior to the conversion, Class A and Class C shares will be converted into Institutional Class shares, then the funds, with only institutional class shares, will become ETFs sometime in the third quarter of 2023.

Pimco Active Multisector Exchange Traded Fund registration filing has been filed. The ETF seeks to achieve its investment objective by investing, under normal circumstances, at least 80% of its assets in a multi-sector portfolio of Fixed Income Instruments of varying maturities, which may be represented by forwards or derivatives such as options, futures contracts, or swap agreements. Total Annual Fund Operating Expenses After Fee Waiver and/or Expense Reimbursement will be 0.55%.

Small Wins for Investors

Effective June 1, 2023, the four-star Guinness Atkinson Alternative Energy Fund (GAAEX) has dropped its management fee from 1.00% to 0.80%. It’s one of the oldest alt energy funds, a passion of founder Edward Guinness. Admittedly the fund is tiny and streaky, but surely that still crosses the “small wins” threshold.

Old Wine, New Bottles

Greenspring Fund is becoming the Cromwell Greenspring Mid Cap Fund on or about July 28.

The Victory INCORE Fund for Income and Victory INCORE Investment Grade Convertible names will be rechristened Victory Fund for Income and the Victory Investment Grade Convertible Fund effective September 1.

The Miller Transition rolls on. Bill Miller, founding inductee of The Overhyped Manager Hall of Fame for his long run of beating the S&P 500 with his Legg Mason Value Fund (a streak dependent on being very careful about looking only at year-end values and ignoring volatility), was sort of bequeathed several of his funds as retirement presents when he left Legg Mason. In December 2022, he retired from management. On May 26, 2023, his $1.2 billion Opportunity Trust, successor to the Legg Mason Opportunity Fund, has now been assigned to Patient Capital Management. Patient Capital is owned by Miller’s long-time comanager, Sarah McLemore. The one-star Opportunity Trust is incredibly streaky, frequently occupying either the top 1% or bottom 1% of its peer group but rarely anything in-between.

Mr. Miller’s son, Bill Miller IV, has now taken over Miller Value Partners, the family’s $2.5 billion firm. He’s the CIO and manager of the $146m Miller Income fund, which has posted more years in the red than in the black since launch.

Effective on or about July 24, 2023, the name of the Sound Equity Income ETF will be changed to the Sound Equity Dividend Income ETF.

Touchstone Funds has booted Rockefeller & Co. from Touchstone International ESG Equity Fund, replacing them with Sands Capital. As a result, the fund will be renamed Touchstone Sands Capital International Growth Equity Fund. Sands Capital also sub-advises Touchstone Sands Capital Select Growth Fund and Touchstone Sands Capital Emerging Markets Growth Fund, neither of which has been excellent. As of March 31, 2023, Sands Capital managed approximately $48.4 billion in assets.

Off to the Dustbin of History …

AAAMCO Ultrashort Financing Fund will be liquidated on or about May 31.

American Beacon Zebra Small Cap Equity Fund will be liquidated on or about July 14.

AXS All Terrain Opportunity Fund goes off-road for the last time on or about June 26, 2023.

BlackRock is liquidating BlackRock U.S. Impact Fund and BlackRock International Impact Fund on or about August 31, 2023, then BlackRock Total Factor Fund on September 29, 2023

A short rant about single-stock ETFs.

These strike me as incredibly stupid. They are, at the base, tools that allow individual investors to easily make high-risk bets for or against individual stocks. Rather than going to the bother of figuring out how to short Tesla, you can just buy a single-stock ETF that does the job for you.

The key, of course, is that these are trading funds that are meant to have holding periods of hours. Not days, not weeks, and, god knows, not for the long term. The issuers endlessly warn that buying these things and letting your attention wander is an awfully good way to learn about bankruptcy.

Rant over.

AXS has announced the liquidation of a series of single-stock ETFs: AXS 2X NKE Bear Daily ETF, AXS 2X NKE Bull Daily ETF, AXS 2X PFE Bear Daily ETF, AXS 2X PFE Bull Daily ETF, AXS 1.5X PYPL Bear Daily ETF, AXS Short China Internet ETF, and AXS Short De-SPAC Daily ETF. At about the same time, GraniteShares decided to liquidate its GraniteShares 1x Short TSLA Daily ETF, which is down 46% YTD.

An emerging sign of sanity in the markets? No, silly reader. GraniteShares replaced its simple “short Tesla” ETF with leveraged short (and long) single-stock ETFs.

  • GraniteShares 1.5x Long AAL Daily ETF
  • GraniteShares 1x Short AAL Daily ETF
  • GraniteShares 1.5x Short AAL Daily ETF
  • GraniteShares 1x Short AAPL Daily ETF
  • GraniteShares 1.5x Short AAPL Daily ETF
  • GraniteShares 1.75x Short AAPL Daily ETF
  • GraniteShares 1x Short AMD Daily ETF
  • GraniteShares 1.25x Short AMD Daily ETF
  • GraniteShares 1x Short COIN Daily ETF
  • GraniteShares 1.5x Short COIN Daily ETF
  • GraniteShares 1.5x Long JPM Daily ETF
  • GraniteShares 1x Short JPM Daily ETF
  • GraniteShares 1.5x Short JPM Daily ETF
  • GraniteShares 1.5x Long LCID Daily ETF
  • GraniteShares 1x Short LCID Daily ETF
  • GraniteShares 1.5x Short LCID Daily ETF
  • GraniteShares 1x Short META Daily ETF
  • GraniteShares 1.5x Short META Daily ETF
  • GraniteShares 1x Short NIO Daily ETF
  • GraniteShares 1x Short NVDA Daily ETF
  • GraniteShares 1.5x Short NVDA Daily ETF
  • GraniteShares 1.5x Long RIVN Daily ETF
  • GraniteShares 1x Short RIVN Daily ETF
  • GraniteShares 1.5x Short RIVN Daily ETF
  • GraniteShares 1.75x Long TSLA Daily ETF
  • GraniteShares 1.5x Long TSLA Daily ETF
  • GraniteShares 1.25x Short TSLA Daily ETF
  • GraniteShares 1.5x Short TSLA Daily ETF
  • GraniteShares 1.75x Short TSLA Daily ETF
  • GraniteShares 1.5x Long XOM Daily ETF
  • GraniteShares 1x Short XOM Daily ETF
  • GraniteShares 1.5x Short XOM Daily ETF

One of their competitors, eyeing the limited bankruptcy opportunities provided by 1.5x and 1.75x leverage, said “Hold my beer” and filed to launch a series of double-down ETFs:

  • T-Rex 2x Long Tesla Daily Target ETF
  • T-Rex 2x Inverse Tesla Daily Target ETF 
  • T-Rex 2x Long Nvidia Daily Target ETF
  • T-Rex 2x Inverse Nvidia Daily Target ETF

Brown Advisory Total Return Fund will merge into Brown Advisory Sustainable Bond Fund on or about June 23, 2023. 

Harbor Global Leaders Fund, subadvised by Sands Capital, will be liquidated on August 23.

Hussman Strategic International Fund will be liquidated on or about June 27.

James Alpha Funds Trust d/b/a Easterly Total Hedge Portfolio will be liquidated on or about June 12.

PSI Strategic Growth Fund will be liquidated on or about June 27.

Segall Bryant & Hamill Fundamental International Small Cap Fund will be liquidated on or about June 26.

Segall Bryant & Hamill Workplace Equality Fund will be liquidated on or about June 26.

UVA Dividend Value ETF will undergo liquidation and dissolution on or about June 26, 2023.

Virtus FORT Trend Fund will be liquidated on or about July 12.

Finally, Ziegler Senior Floating Rate Fund will be liquidated on or about July 16.

Manager changes

The Board of Trustees of Vanguard Quantitative Funds, on behalf of Vanguard Growth and Income Fund, has approved firing Vanguard’s Quantitative Equity Group, then adding Wellington Management to existing subadvisors D. E. Shaw Investment Management and Los Angeles Capital Management. An odd disclosure: “With the addition of Wellington Management, which will employ a fundamental approach, the Fund’s principal investment strategy will change, as it will no longer use solely quantitative approaches to security selection.” This Leaves it unclear whether Shaw & LA are switching from quant strategies or if they were simply too minor to drive the fund’s “principal” strategy.

Vanguard’s QEG suffers the same fate with regard to Vanguard U.S. Growth Fund; they get booted while Baillie Gifford, Jennison Associates, and Wellington Management Company remain. Despite the disappearance of a quant manager, “The Fund’s investment objective, principal investment strategies, and policies remain unchanged.”