


I hope everyone had a chance to enjoy the holidays and spend time with family! I wish you a pleasant and prosperous new year.
I was preparing for my typical review of forecasts for the coming year and read an interesting discussion about allocation strategies on the MFO Discussion Board and redirected my efforts. The discussions centered around investment and withdrawal strategies. In this article, I will create three base cases compared to the S&P500 using Portfolio Visualizer in response to the comments. I add context using secular and business cycles for the last ninety-five years. I look briefly at life expectancies. I reviewed my own investment system for setting allocations and closed with a review of trending Lipper Categories using the Mutual Fund Observer MultiScreen Tool.
This article is divided into the following sections:
-
- Section 1, Summary of Comments on MFO Discussion Board
- Section 2, Life Expectancy
- Section 3, Creating Three Base Cases for the Past 37 Years
- Section 4, Review of 95 Years of Stock and Bond Performance
- Section 5, Current Market Conditions and 2024 Outlook
- Section 6, My Allocation Strategy
- Section 7, Trending Lipper Categories and Funds
SUMMARY OF COMMENTS ON MFO DISCUSSION BOARD
The discussion on the MFO Discussion Board about allocation strategies mostly in retirement is New Report: All Stock Portfolio Beats Stock and Bond Mix Over Time. I summarize some of the concepts that were in the Discussion by Category and ranked by my preference:
- ALLOCATION TO STOCKS
- Glide path of owning more stocks in the accumulation stage and being more balanced in the retirement stage.
- Guaranteed income (Pensions, Social Security) allows one to take more investment risk.
- Yields are high for allocations to bonds should be higher.
- Equity valuations are high so allocations should be tilted to bonds.
- Warren Buffet’s allocation of 90% stock (for the wealthy).
- Investors may be better off investing in half domestic and half international stocks than in a 60/40 stock-to-bond portfolio.
- WITHDRAWAL STRATEGY
- Starting withdrawals conservatively and then ramping up later.
- Basing withdrawal on spending needs.
- Having higher allocations to stocks and a higher withdrawal rate.
- MANAGING RISK
- Having enough saved for retirement and basing risk on savings.
- Sequence of return risk.
- Using buffer assets like cash, a reverse mortgage or whole life policy with cash value.
- Spend conservatively.
- Be flexible with spending during market fluctuations.
- Glide path of being conservative initially in retirement and increasing allocations later in retirement.
- Annuitizing part of a portfolio to create guaranteed income.
- The risk of being too conservative.
LIFE EXPECTANCY
Key Point: Data showing returns for the past century or more is irrelevant when our investing time horizon is only a fraction of that. We should prepare for maximum life expectancy rather than average life expectancy.
The life expectancy for women at birth is about 79 years. Figure #3 shows how life expectancy changes with age. There is roughly a 32% chance that a 60 year-old-woman will live to age 90. A woman who has lived to age 80 has roughly 45% of living to age 90. We should prepare for maximum life expectancy rather than average life expectancy in order to not outlive our savings.
Figure #3: Life Expectancy at Ages 60, 70, 80, and 90 (Labels = Age)
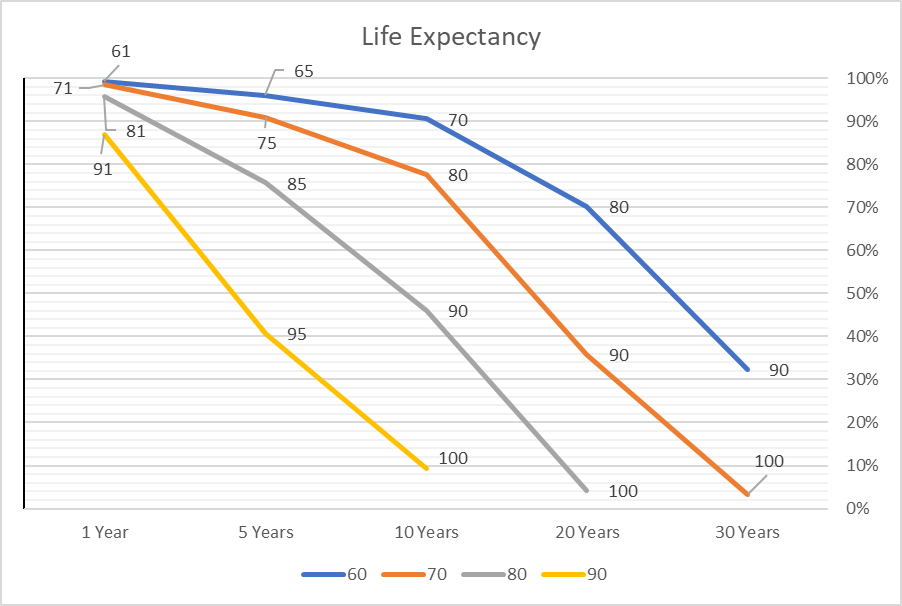
Source: Author
CREATING THREE BASE CASES FOR THE PAST 37 YEARS
Key Point: Manage Risk First – Always maintain several years of living expenses in safe investments. This along with guaranteed income, amount of savings, risk tolerance, and long-term market outlook are the main inputs into setting an allocation strategy in retirement. I use a Financial Planner and advocate most people should start using one early in the accumulation stage.
All-Equity Portfolio Beats Bonds In Retirement Plans, New Research Finds describes a study that found across a sample of three dozen countries over 130 years was that a mix of half domestic, half international equities actually beat blended portfolios in both money made and capital preserved. My investing horizon is significantly less than 130 years during which two world wars occurred so I don’t put any relevance into these studies, valid as they may be.
Portfolio Visualizer can be used to find the best-performing strategies from 1985 to 2023. I created three strategies for comparison with the S&P 500. The link to the Portfolio Visualizer Backtest is here. The strategies are 1) 100% US stock (VFINX), 2) 50% US stock (VFINX) and 50% International Stock (VTRIX), 2) 70% US Stock (VFINX) and 30% Bonds (VBMFX), and 3) 50% US stock (VFINX), 25% International Stock (VTRIX), and 25% Bonds (VBMFX). I assumed a 6% annual withdrawal rate.
The results for the thirty-seven-year period are that investing 100% in the S&P 500 had the highest return, but also a maximum drawdown of 68% including a 6% withdrawal rate. The second-best performing strategy is the 70% US Stock (VFINX) and 30% Bonds (VBMFX) portfolio which also had the highest Sortino Ratio or risk-adjusted return. The portfolios are rebalanced annually.
Table #1: Base Cases for Past 37 Years Using Portfolio Visualizer
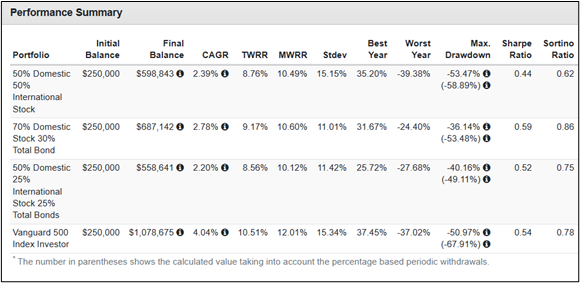
Source: Author Using Portfolio Visualizer
Figure #1 shows the strategies adjusted for inflation. All four strategies held up well against inflation but only the 100% SP500 strategy beat inflation while 70% stock/30% bond portfolio came close.
Figure #1: Base Cases Portfolio Growth for Past 37 Years Using Portfolio Visualizer
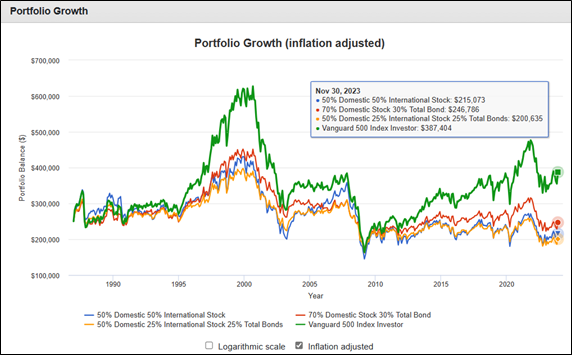
Source: Author Using Portfolio Visualizer
Figure #2 shows annual withdrawals on a nominal basis without inflation adjustments. Overall, the withdrawals would have kept up with inflation, but withdrawals in 2008 would not have kept up a steady stream of inflation-adjusted returns. One alternative withdrawal strategy would be to withdraw less in the years with high returns and reinvest the excess returns. A second approach could be a bucket approach where you withdraw from safer investments in the bad times instead of rebalancing annually.
Figure #2: Nominal Annual Withdrawal for Past 37 Years Using Portfolio Visualizer
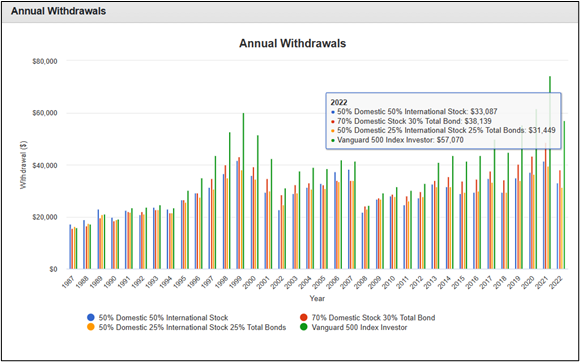
Source: Author Using Portfolio Visualizer
While a strategy of withdrawing 6% during the past 37 years would have worked comfortably, the past decade has experienced unprecedented monetary stimulus which has inflated many assets. Valuations and inflation are major factors in determining future returns. The maximum withdrawal rate may depend upon spending needs and desires to pass along an inheritance, but the time-tested 4% withdrawal rate is a fairly safe assumption for historical market conditions.
REVIEW OF 95 YEARS OF STOCK AND BOND PERFORMANCE
Key Point: Secular markets can suppress returns for decades. Stocks and bonds usually move in opposite directions reducing sequence of return risk.
For this section, I rely on data provided by Aswath Damodaran at the Stern School of Business at New York University. Since 1928, stocks have returned 9.6% compared to a respectable 6.7% for corporate bonds. Stocks have returned 10.5% since 1987 used in the Portfolio Visualizer example above.
Table #2: Historical Returns Source: Aswath Damodaran at the Stern School of Business at New York University
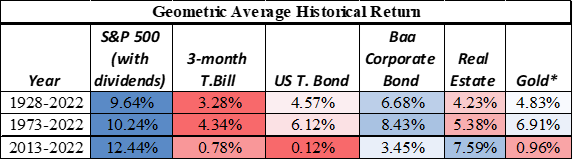
Source: Aswath Damodaran at the Stern School of Business at New York University
Table #3 shows secular returns. The time period from 1928 to 1962 covered the Depression, World War II, and end of the war over which time stocks returned 8.7%. The next time period, 1962 – 1982 was defined by stagflation with slow growth and high inflation from which stocks only returned 2.1% on an inflation-adjusted basis. The Great Moderation was from 1983 to the mid-2000s, and stocks grew at 12.6% with relatively low inflation. During three of the time periods, on average stocks would have supported a 6% withdrawal rate, however, within each of these periods, a sustained drawdown of more than forty percent posed serious risks.
Table #3: Historical Returns by Secular Markets
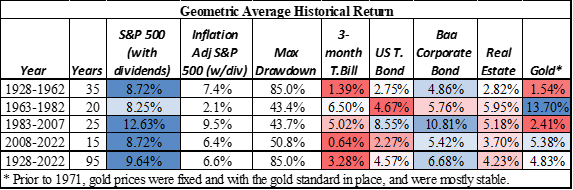
Source: Author Using Data from Aswath Damodaran at the Stern School of Business at New York University; Inflation Adjusted Data from DQYDJ; Drawdown from James Picerno at Seeking Alpha
Table #4 contains a more detailed breakdown of time periods. It shows that there are three time periods in which stocks do not outperform bonds and one in which they are about the same. One of the important characteristics of bonds is that their value typically moves in the opposite direction of stocks. One can withdraw from stocks when they outperform and draw from bonds when they outperform.
Table #4: Historical Returns by Notable Market Conditions
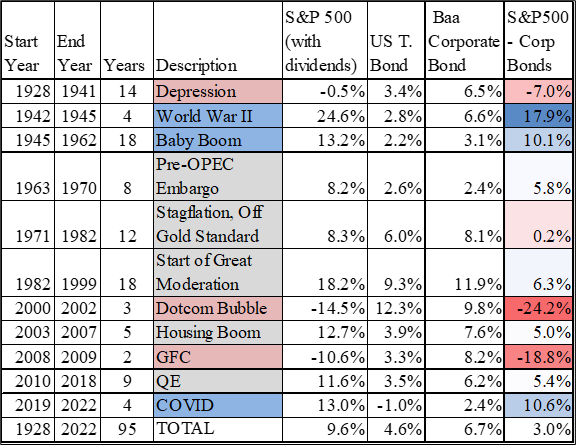
Source: Author Using Portfolio Visualizer
To illustrate the benefits of having a balanced portfolio, from 1999 until 2020, the conservative Vanguard Wellesley (VWINX) and moderate Vanguard Wellington (VWELX) have beaten the S&P 500. This illustrates the importance of starting and ending points – sequence of return risk. A high allocation of stocks in 1999 could have impacted savings for the remainder of retirement.
Figure #4: Example 1998 – 2022 Vanguard Wellesley, Wellington, S&P 500
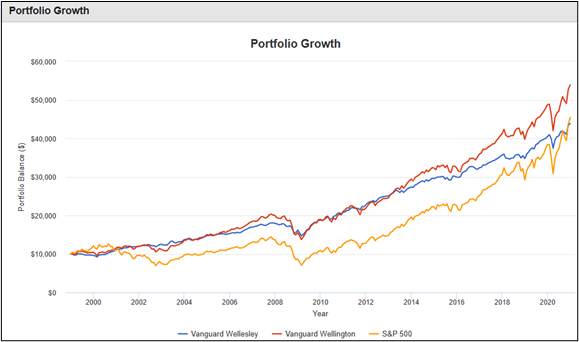
Source: Author Using Portfolio Visualizer
The coming decade is likely to have stock returns below historical trends. Valuations are currently moderately high as I described last month. Nearly 40% of revenues of the S&P 500 come from other countries, and trends of deglobalization will negatively impact some industries and tend to increase inflation. Population growth is slowing which suggests slower economic growth. High debts and deficits suggest interest rates will remain higher for longer. Unwinding Quantitative Easing will probably dampen asset prices. I favor a balanced portfolio that is diversified globally and tilted toward quality bonds.
CURRENT MARKET CONDITIONS AND 2024 OUTLOOK
Talk of a soft landing is still wishful thinking with the yield curve still inverted. Few investors recognized that extreme valuations were wishful thinking prior to the bursting of the technology bubble in 1999 or recognized the danger of “safe” tranches of subprime loans prior to the bursting of the housing bubble. Still, I like to review respectable outlooks for the coming year but put more emphasis on my own nowcast in the next section.
Vanguard released its Economic And Market Outlook For 2024, “Vanguard anticipates that the United States and other developed markets will grapple with mild recessions in coming quarters and that central banks will cut interest rates, likely in the second half of 2024, amid growth challenges and inflation falling toward the banks’ targets.” They also expect higher real interest rates for longer.
Wells Fargo’s December 2023 Outlook includes a mild recession. “…the specifics on whether or not we actually pull off the soft landing or have a mild recession is sort of less important than the fact that it’s just kind of going to be a crummy year.” Senior Economist Tim Quinlan adds that the consumer is holding up the economy but conditions are not as supportive.
Fidelity’s 2024 Outlook is that we have been in a late-cycle business expansion which is supported by a stronger consumer, improving corporate earnings, and easing inflation. They are seeing signs of moderating growth and may see slowly rising delinquencies for auto loans and credit card payments. The Fidelity fixed income managed account team has a base case that we may experience some type of mild recession, or at least a slowdown in growth, over the coming year. The corporate bond market is not pricing in a recession. They believe longer-term fixed income may be an option worth considering.
From my perspective of the economy, USA Facts is an interesting source of unbiased information. In 2021, the average middle-class family earned $59,600 and paid $18,800 in taxes. I think it is important to look at median statistics more so than just averages. The median wage in 2022 was $46,367, down 7% from 2021 when accounting for inflation. Poverty increased to 11.6% of the population in 2021. Over half of US renters and 22% of homeowners spent more than 30% of their income on housing in 2021. Food insecurity affected 1 in 10 households, and 41 million people received SNAP benefits each month of 2022, with an average benefit of $230.39 per recipient. To which, I add that pandemic-era stimulus is expiring.
According to the Associated Press, “The United States experienced a dramatic 12% increase in homelessness to its highest reported level as soaring rents and a decline in coronavirus pandemic assistance combined to put housing out of reach for more Americans.” The number 7 top article from USAFacts’ 10 most-read articles of 2023 is “How many homeless people are in the US? What does the data miss?” The Department of Housing and Urban Development (HUD) counted around 582,000 Americans experiencing homelessness in 2022.
MY ALLOCATION STRATEGY
I built my Investment Model based upon the principles discussed in the following books: Nowcasting the Business Cycle by James Picerno, Conquering the Divide by Cornehlsen and Carr, Investing with the Trend by Gregory L. Morris, Ahead of the Curve by Joseph H. Ellis, Probable Outcomes by Ed Easterling, The Era of Uncertainty by Francois Trahan and Katerine Krantz, The Research Driven Investor by Timothy Hayes, Beating the Market 3 Months at a Time by Gerald Appel and Marvin Appel and Morris, and Business Statistics for Competitive Advantage with Excel, (2019) by Cynthia Fraser, among others. I used over a hundred indicators most of which can be downloaded from the Federal Reserve Bank of St. Louis FRED Database that have a high correlation to the stock market six months into the future. I added other indicators that look for secular trends such as valuations and monetary policy.
I built my Investment Model shown in Figure #5 to optimize returns by varying allocations to reflect economic, financial, and market conditions. The model is intended to adjust slowly to market conditions and not to be used for frequent market timing. It works most efficiently with tax advantaged accounts. Minimum and Maximum allocations to stock are variables. Using a minimum allocation to stock of 35% and a maximum of 65% results in an average annual return of 9.0% with an average allocation to stock of 58%. It beat the S&P 500 until 2020 when massive stimulus inflated asset values.
Figure #5: Author’s Investment Model, Stock Allocation >= 35% <=65%
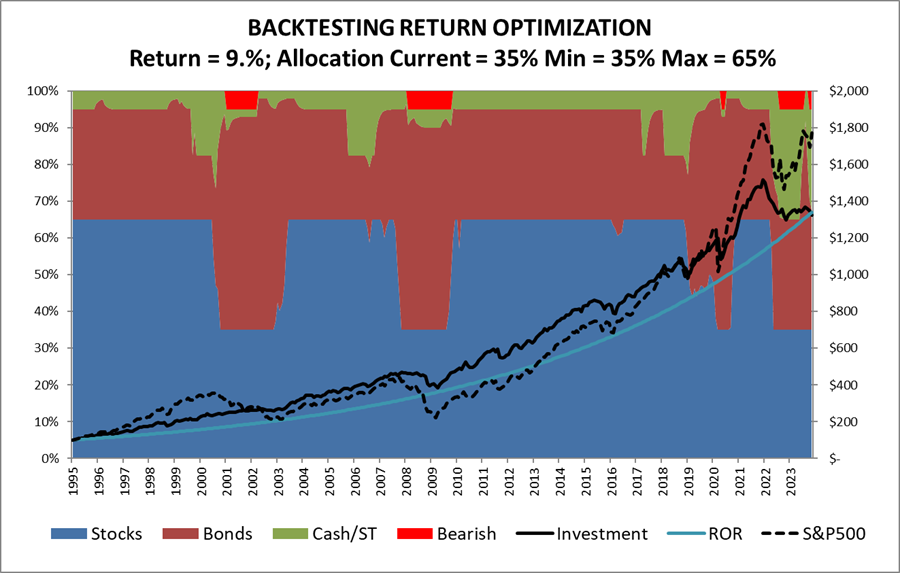
Source: Author
Increasing the minimum allocation to stock to 65% and maximum allocation to 80% does not improve returns significantly because it does not allow sufficient switching between asset classes to reduce allocations to stocks when recession risk is high and to fixed income when yields are high.
Figure #6: Author’s Investment Model, Stock Allocation >= 65% <=85%
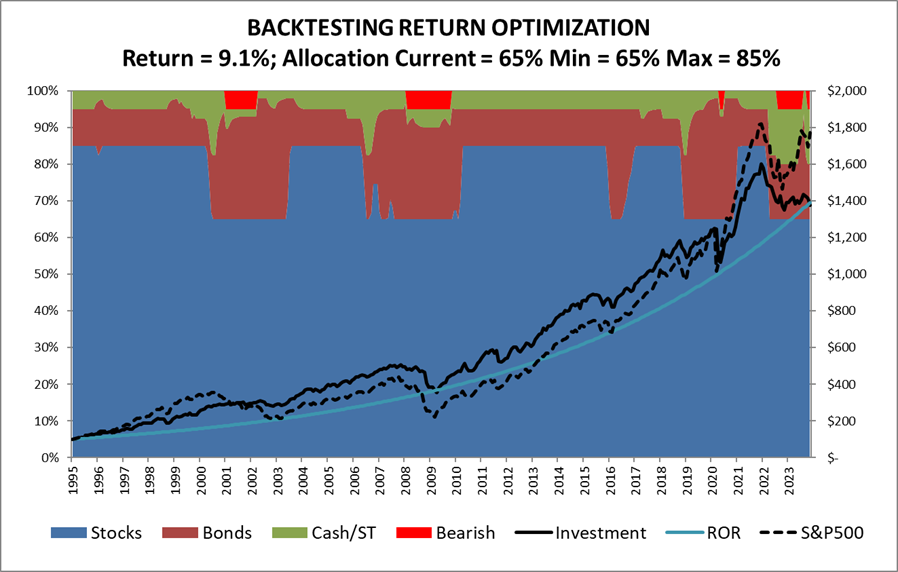
Source: Author
Following the guidelines of Warren Buffet’s mentor, Benjamin Graham, of never investing less than 25% to stocks nor more than 75% increases returns to the same as an all-stock portfolio for the past 37 years.
Figure #7: Author’s Investment Model, Stock Allocation >= 25% <=75%
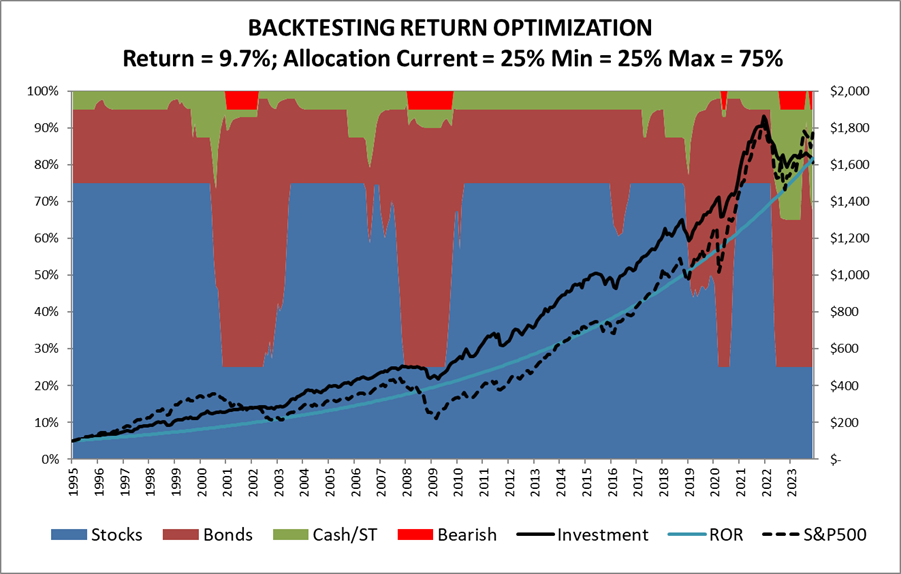
Source: Author
I built the core of the investment model during 2015 to 2017. I was overly conservative during COVID because I did not know how well the model would perform. In hindsight, I would have been better off following it. I use a narrower allocation to stocks than Benjamin Graham’s to take into account the psychological impact of the unknowns.
TRENDING LIPPER CATEGORIES AND FUNDS
Table #5 contains the top-performing Lipper Categories for the 635 funds that I currently track. I built a rating system based on momentum and money flow to measure what Lipper Categories and funds are trending with investor support. The first group of funds is short-term, quality fixed income. The Ulcer Index measures the depth and duration of drawdowns over the past two years, while the Martin Ratio measures the risk-adjusted performance over the past two years. The second group is the one that interests me the most and consists mostly of fixed-income funds with intermediate durations. Notice that Global and International funds are included.
Table #5: Trending Lipper Categories – Ulcer & Martin Stats – Two Years
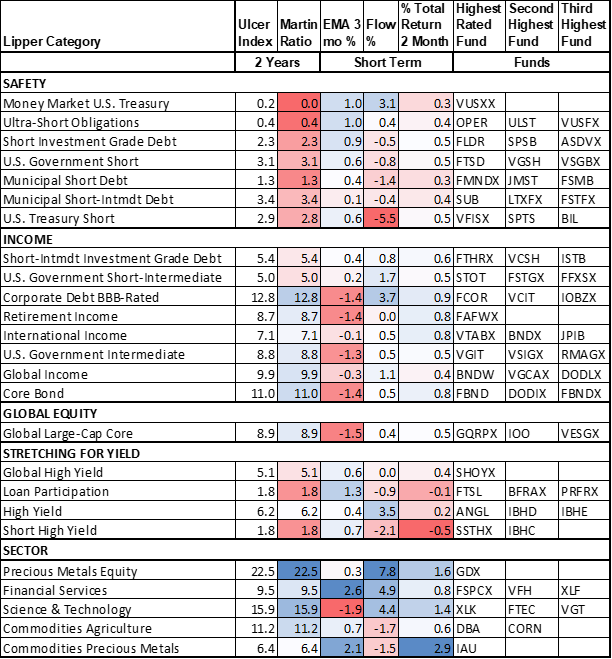
Source: Author Using Mutual Fund Observer
CLOSING THOUGHTS
With the evolution of tax laws and savings incentives, like many investors, I own traditional and Roth IRAs and tax-managed accounts for a two-income household. Pensions and Social Security Benefits largely insulate us from market downturns. We follow the bucket approach with two to three years of living expenses in Bucket #1 (tax-efficient municipal money markets and bonds). I believe in both the Vanguard long-term strategy and the Fidelity Business Cycle strategies to investing and use both to manage accounts in Bucket #3 (more risk in Roth IRAs where taxes have been paid) for long-term investments. I use Bucket #2 to adjust to my view of the investment environment. My current allocation is just over 40% to domestic and international stocks and over 40% to intermediate bond funds and ladders. The rest is mostly in ladders of short-term fixed-income and money markets. As these mature, I will decide whether I want to increase my allocation to stocks or bonds with a preference for diversifying internationally.
With regard to the Discussion in the first section, in my opinion, there are three groups that benefit from higher allocations to stocks: 1) those in the accumulation stage with a long-time horizon; 2) those with guaranteed income to cover expenses; and 3) the wealthy with enough in short-term savings that they can withstand more volatility. For the majority of people, the bucket approach, controlling spending, and variable withdrawal rates are appropriate.
For most investors, I advise consulting with a Financial Planner. In the MFO June 2023 newsletter, Helping a Friend Get Started with Financial Planning, I described helping a friend select a Financial Planner. She interviewed one from both Fidelity and Vanguard and is finalizing her selection. I assisted her in setting up a self-directed low-risk, tax-efficient brokerage account investing mostly in municipal bond funds of varying durations. She has benefited well from falling rates.