


About a year ago we identified emerging markets value funds as one of the market’s few bright spots, at least if valuations are important. (And they are.) Since we published that story, three things occur to us.
- Some emerging markets value funds have, indeed, done well.
- The long-term case for emerging market value remains strong.
- The options for prospective EM value investors have become clearer
Download a the .pdf version of this story.
The performance of EM value
There are about 40 EM value vehicles available for retail investors. Year-to-date performance ranges from 15.5% for Seafarer Overseas Value down to (1.4%) for Advisory Research Emerging Markets Opportunities (ADVMX, soon-to-be Vaughan Nelson EM Opportunities). As a group, the EM value funds and ETFs have returned about 5% YTD while EM funds overall have earned 7.8%.
The long term case for emerging market value remains strong.
Investors worry a lot about the threat posed to their portfolios by “bubbles.” The problem is that bubbles are hard to spot (everything’s a bubble when you’re panicky) and their resolution is hard to game (sometimes they simply sag, other times they persist for years). Rob Arnott and his colleagues at Research Affiliates argue that it might be more profitable to invest in “anti-bubbles.” At base, they argue that “bubbles” are marked by asset classes where every conceivable thing must go right simultaneously to justify investors’ current optimism toward them. “Anti-bubbles” are asset classes where every conceivable thing must go wrong simultaneously to justify investors’ current pessimism toward them.
American stocks, they argue, are in a bubble. Emerging markets stocks, and particularly smart beta value stocks, are in an anti-bubble. They believe that’s implausible in the short-term, and that that pessimism has driven EM valuations to historic lows.
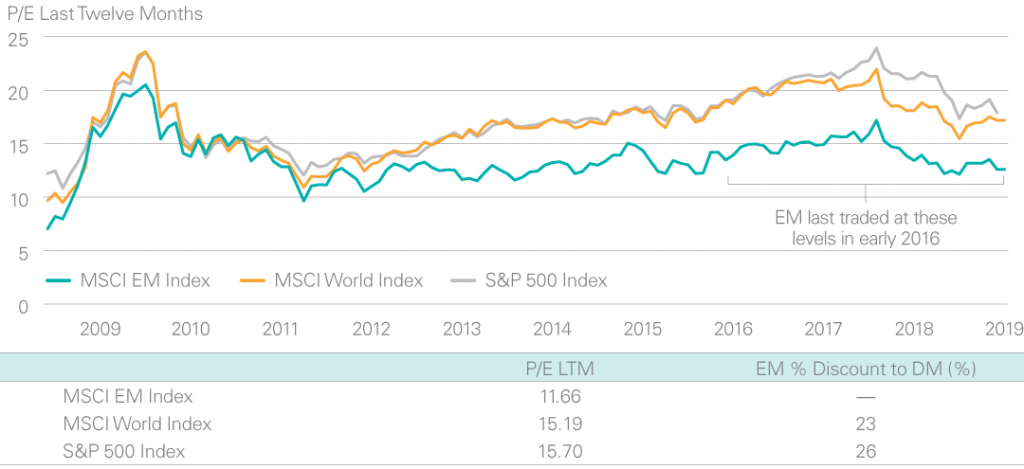
The folks at Lazard illustrate the magnitude of the difference that investors are willing to pay for EM stocks versus stocks in the developed world or the S&P 500. At base, the discount now offered by EM stocks is far higher than it’s been in years.
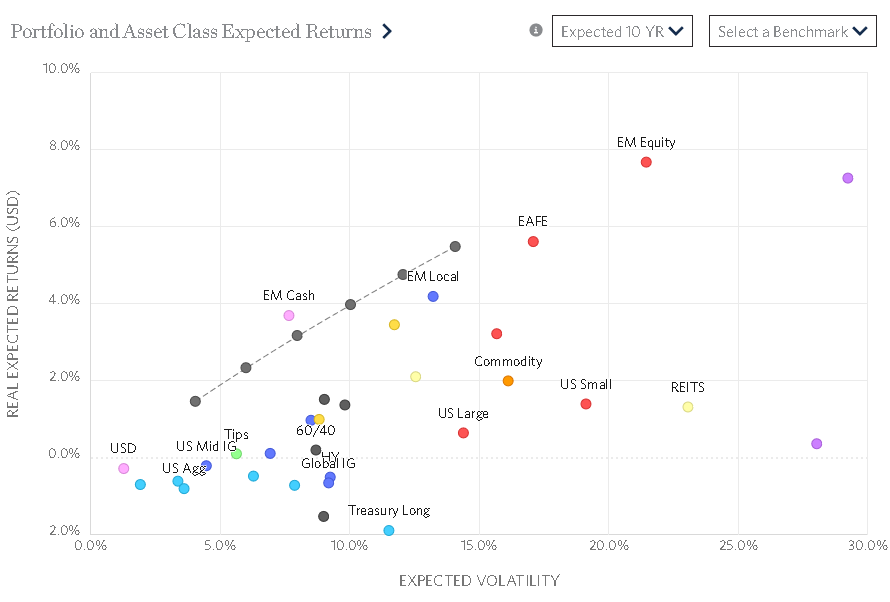
Research Affiliates uses that valuation disconnect to help explain their conclusion that, over the next 10 years, EM stocks are apt to be the highest performing asset class.
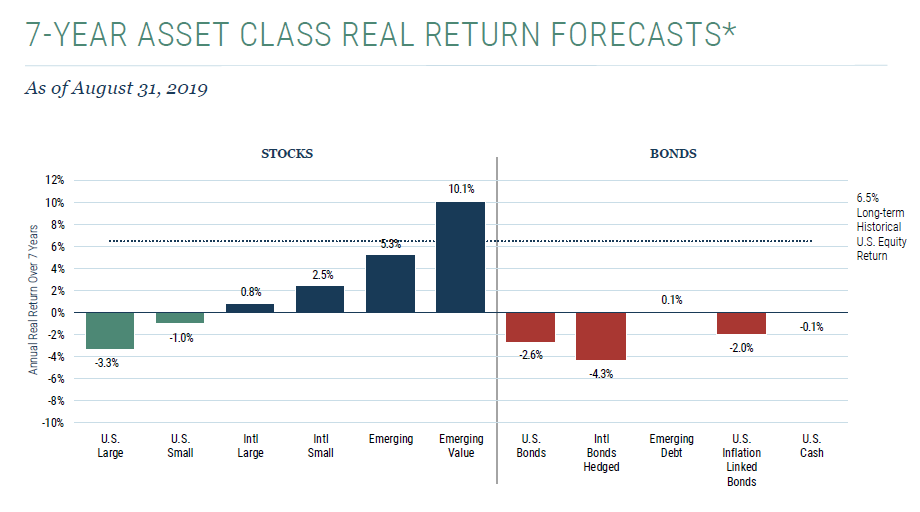
GMO, whose asset class predictions tend to be pretty reliable over the long term (that is, like the rest of us they’re horrible at predicting next year but, unlike the rest of us, decent at predicting the next decade), contend that EM value stocks are the only asset class accessible to retail investors with even the prospect of double-digit returns.
The options for prospective EM value investors have become clearer
The table below represents all of the EM value funds and ETFs with a record of three or more years. While there is no formal EM value category in either Lipper or Morningstar, these funds are categorized as Emerging Markets Equities funds, and Morningstar assigns their portfolios to the “value” style box.
Using the performance of the MSCI Emerging Markets Value Index as a benchmark wherever possible, we highlight (in green) funds with superior three-year records. APR, or annual percentage return, shows the average annual returns for the funds for the three years ending 8/30/2019. Maximum drawdown and standard deviation give an indication of the funds’ riskiness. The remaining three columns offer risk-return balances.
For APR, standard deviation and Sharpe ratio, we highlighted funds that outperformed their benchmark index. For the other values, which aren’t available for the index, we highlighted the three or four top performers.
Emerging Markets Value funds, sorted by three-year Sharpe ratio
| APR | MAX DD | Std Dev | Ulcer Index | Sharpe Ratio | Martin Ratio | ||
| Cambria Emerging Shareholder Yield ETF | EYLD | 9.5 | -19.8 | 14.1 | 8.7 | 0.57 | 0.92 |
| Seafarer Overseas Value | SFVLX | 6.9 | -17.5 | 10.4 | 6.8 | 0.52 | 0.79 |
| Schwab Fundamental Emerging Markets Large Company Index | SFENX | 7.7 | -17.9 | 13.9 | 8.5 | 0.45 | 0.74 |
| T Rowe Price Emerging Markets Discovery Stock | PRIJX | 7.8 | -18 | 13.9 | 8.3 | 0.45 | 0.76 |
| AllianzGI Emerging Markets Small-Cap | ALMMX | 6.5 | -21.2 | 12.1 | 9 | 0.41 | 0.55 |
| Invesco FTSE RAFI Emerging Markets ETF | PXH | 7.2 | -17.4 | 14.6 | 9.0 | 0.39 | 0.63 |
| American Beacon Acadian Emerging Markets Managed Volatility | ACDPX | 5.1 | -13 | 10.3 | 5.6 | 0.35 | 0.64 |
| BNY Mellon Strategic Beta Emerging Markets Equity I | DOFIX | 5.2 | -18.7 | 13.7 | 9.5 | 0.27 | 0.39 |
| MSCI Emerging Markets Value Index (USD) | 4.31 | 13.4 | 0.26 | ||||
| PIMCO RAE Emerging Markets | PEAFX | 5.2 | -21.3 | 14.7 | 11.2 | 0.25 | 0.33 |
| Segall Bryant & Hamill Emerging Markets A | SBHEX | 5.1 | -24.5 | 14.1 | 12 | 0.25 | 0.3 |
| Pzena Emerging Markets Value | PZVEX | 4.8 | -19.4 | 13.3 | 9 | 0.25 | 0.36 |
| Causeway Emerging Markets | CEMVX | 4.1 | -24.3 | 14.6 | 12.8 | 0.18 | 0.21 |
| Acadian Emerging Markets Portfolio | AEMGX | 4 | -24.8 | 14.8 | 13 | 0.17 | 0.19 |
| Brandes Emerging Markets Value | BEMAX | 3.6 | -20.8 | 13.9 | 10.5 | 0.15 | 0.2 |
| FlexShares Morningstar Emerging Markets Factor Tilt Index | TLTE | 3.4 | -23.3 | 13.5 | 11.5 | 0.14 | 0.17 |
| JPMorgan Emerging Economies | JEEAX | 3.4 | -25.8 | 14.6 | 13.5 | 0.13 | 0.14 |
| Mainstay MacKay Emerging Markets Equity | MEOVX | 3.4 | -25.2 | 14.8 | 13.1 | 0.13 | 0.15 |
| State Street Defensive Emerging Markets Equity | SSEMX | 2.7 | -14.9 | 10 | 7.9 | 0.12 | 0.15 |
| Wells Fargo Emerging Markets Equity Income | EQIAX | 2.9 | -19.3 | 13.1 | 9.8 | 0.11 | 0.14 |
| AB Emerging Markets Multi-Asset Portfolio | ABAEX | 2.6 | -20 | 12.1 | 9.7 | 0.09 | 0.11 |
| Cullen Emerging Markets High Dividend | CEMDX | 2.6 | -22.4 | 12.8 | 10.9 | 0.08 | 0.1 |
| Timothy Plan Emerging Markets | TPEMX | 2.6 | -21.5 | 13.5 | 10.7 | 0.08 | 0.1 |
| Lazard Emerging Markets Equity Portfolio | LZOEX | 2 | -24.5 | 14.6 | 13.2 | 0.04 | 0.04 |
| Invesco Low Volatility Emerging Markets | LVLAX | 0 | -25.5 | 12.5 | 13.4 | -0.12 | -0.11 |
| Advisory Research Emerging Markets Opportunities | ADVMX | -0.9 | -24.8 | 11.5 | 13.2 | -0.21 | -0.18 |
The clear winner is Seafarer Overseas Value (SFVLX/SIVLX), which led its benchmark and peer group in every single measure of return, risk, and risk-adjusted return. The fund recently passed its third anniversary and earned a four-star rating from Morningstar and a Great Owl designation from MFO. The fund has also outperformed its famous larger sibling, Seafarer Overseas Growth and Income (SFGIX). Interested readers might want to review our Elevator Talk: Paul Espinosa, Seafarer Overseas Value to get a sense of his (and Seafarer’s) approach to the asset class.
The strongest raw returns were posted by Cambria Emerging Shareholder Yield ETF (EYLD), a $28 million passive ETF which invests in 100 companies with the best combined rank for dividend payments and net stock buybacks, with an additional screen for quality and diversification. It’s a five-star fund with a pretty broadly diversified portfolio, although one might want to approach “net stock buybacks” with some caution if you’re looking for a long term metric.
The Schwab Fundamental Emerging Markets Large Company Index Fund (SFENX) tracks a different sort of index. Rather than weighting stocks on their market capitalization, they weight them on company fundamentals: sales, cash flows and dividends + buybacks. That index was constructed by Research Affiliates, the group bullish on EM value to begin with. While not a “value” index per se, the emphasis on real companies with real profits and real dividends biases the portfolio toward value stocks.
Finally, one new option is the LSV Emerging Markets Fund (LVAZX) which launched January 17, 2019. LSV famously attempts to exploit the psychological quirks of other investors, and its principals include several renowned economists who helped found the discipline of behavioral finance. LSV has managed this strategy for more than 10 years in a series of separate accounts and European investment vehicles. Over that decade, their separate account composite, net of fees, returned 7.1%, the MSCI EM index returned 5.8% and the MSCI EM Value index made 4.6%. The performance of LSV’s other funds has been inconsistent, but it bears watching.
Bottom Line:
It’s easy to allow our short-term travails –apocalyptic headlines abound – to blind us to long-term opportunities. Indeed, asset classes become long-term opportunities precisely because so many of us become anxious and blinded. While a conservative asset allocation might make all the sense in the world just now, considering EM value for a portion of your equity allocation might well be the most profitable path you’ve got.
Fortunately, in Seafarer and a small handful of others, you’ve got better choices than every before.