Category Archives: Stars in the shadows

Small funds of exceptional merit

iMGP Alternative Strategies Fund (formerly Litman Gregory Masters Alternative Strategies), (MASFX/MASNX), April 2017

By Charles Boccadoro

At the time of publication, this fund was named Litman Gregory Masters Alternative Strategies.

Objective and Strategy

The Litman Gregory Masters Alternative Strategies Fund seeks to provide attractive “all-weather” returns relative to conservative benchmarks, but with lower volatility than the stock market. It seeks this objective through a combination of skilled active managers, high conviction “best ideas,” hedge fund strategies, low beta, and low correlation to stock and bond market indices.

The fund’s risk-averse managers, asset allocations, and hedging strategies position it as an alternative to traditional 80/20% or 60/40% bond/stock portfolios for conservative or Continue reading →

Grandeur Peak Global Stalwarts/Grandeur Peak International Stalwarts (GGSYX/GISYX), April 2017

By Samuel Lee

Objective and strategy

Grandeur Peak calls fast-growing, high-quality stocks with market capitalizations above $1.5 billion “stalwarts”. They are too big for Grandeur Peak’s small- and micro-cap funds, but too good to let go, so Grandeur Peak rolled out two funds to hold them.

It is a little appreciated fact that most of the gains in the stock market are driven by a handful of runaway winners; most stocks earn sub-par returns. Grandeur Peak’s strategy is to try to find them when they’re small—the tinier, the better—and ride them up. Founder Robert T. Gardiner made an ungodly sum of money applying this strategy for the lucky shareholders of Wasatch Micro Cap (WMICX) from 1995 to 2006. Continue reading →

Homestead Growth (HNASX), March 2017

By David Snowball

Objective and strategy

The fund seeks long-term capital appreciation by investing, primarily, in domestic large cap growth stocks. The portfolio is diversified (typically 60-75 names) but not sprawling. Direct foreign investment is currently about 5.6%, which is modest but also above-average for its Morningstar peer group.

In general, the fund’s subadvisor T. Rowe Price targets:

  • companies with characteristics that support sustainable double-digit earnings growth and
  • high-quality earnings, strong free cash flow growth, shareholder-oriented management, and rational competitive environments

Their preference is for firms with a lucrative and defensible niche which allows them to Continue reading →

Pin Oak Equity (POGSX), March 2017

By David Snowball

Objective and strategy

Pin Oak is a concentrated, all-cap fund. The portfolio currently holds 35 securities with much more exposure to small- and mid-cap stocks than its peers Portfolio construction begins with macro-level assessments of the economy, proceeds to analyses of industries and sectors, and then ends by buying and holding the most attractive stocks in the most attractive sectors. Oak Associates has a long and adamant tradition in favor of buying-and-holding just a few best-of-class stocks, so turnover is generally below 20%. Half of the portfolio’s 35 current stocks have been there for between five and 15 years.

Adviser

Oak Associates, ltd. Founded in 1985 and headquartered in Continue reading →

AMG GW&K Global Allocation Fund (formerly AMG Chicago Equity Partners Balanced), (MBEAX), February 2017

By David Snowball

At the time of publication, this fund was named AMG Chicago Equity Partners Balanced.

Objective and strategy

The managers aim to provide “high total investment return, consistent with the preservation of capital and prudent economic risk.” The fund normally holds 50-75% in equities with the remainder in bonds and cash. The equity sleeve is mostly mid- to large-cap US stocks; direct foreign investment is minimal. The income sleeve is mostly high quality, intermediate-term bonds. The managers have the freedom to invest up to 25% in high-yield securities or in longer maturity bonds but, mostly, don’t.

Adviser

AMG (Affiliated Managers Group) advises Continue reading →

T. Rowe Price Global Multi-Sector Bond (PRSNX), February 2017

By David Snowball

Objective and strategy

The fund seeks “high income with the potential for some capital appreciation.” Their target is to maximize total return on a risk adjusted basis through a blend of high yield and global fixed income securities. They hope to achieve that end by investing primarily in income-producing instruments including:

  • US, international and emerging country sovereign debt
  • US, international and emerging market corporate debt
  • Mortgage- and asset-backed securities
  • Bank loans
  • Convertible securities and preferred stocks.

The fund may invest entirely in dollar-denominated foreign securities; other than that, the restrictions in the prospectus come down Continue reading →

Tributary Small Company (FOSCX), December 2016

By David Snowball

Objective and strategy

The fund pursues long-term capital appreciation. They invest in a portfolio of 60-70 small-cap stocks, mostly domiciled in the U.S. Their fundamental approach is value-oriented and broadly diversified across economic sectors. In general, each position in the portfolio starts out about equally weighted; 50 of the 65 current holdings are each between 1-2% of the portfolio. They hold minimal cash, currently about 4%. Portfolio turnover is in the range of 25-35%, far below the small cap average.   Continue reading →

Sunbridge Capital Emerging Markets (formerly Fiera Capital Emerging Markets Fund), (RIMIX, CNRYX), October 2016

By Dennis Baran

At the time of publication, this fund was named City National Rochdale Emerging Markets Fund.
This fund was formerly named Fiera Capital Emerging Markets Fund.

This fund has been liquidated as of February 10, 2023.

Objective and strategy

The fund seeks to provide long-term capital appreciation primarily by investing in locally listed large, medium, and small quality companies broadly accessible to U.S. investors within Asian Emerging Markets. The Adviser conducts on-the-ground research to provide direct insight into these companies using its domain expertise in the region, and while it may invest in companies from any emerging market country, it expects to focus its investments in Asia.

The fund is intended for long-term investors who have a time horizon of at least 5 years but preferably 7-10. It was first mentioned in the April 2015 edition of MFO as Continue reading →

Mairs and Power Small Cap Fund (MSCFX), September 2016

By David Snowball

Objective and strategy

The fund seeks “above-average” long-term capital appreciation by investing in 40-45 small cap stocks. For their purposes, “small caps” have a market capitalization under $3.4 billion at the time of purchase. The manager is authorized to invest up to 25% of the portfolio in foreign stocks and to invest, without limit, in convertible securities (but he plans to do neither). Across all their portfolios, Mairs & Power invests in “carefully selected, quality growth stocks” purchased “at reasonable valuation levels.” Continue reading →

Ariel Global (AGLOX), August 2016

By David Snowball

Objective and strategy

Ariel Global Fund’s fundamental objective is long-term capital appreciation. The manager pursues an all-cap global portfolio. The fund is, in general, currency hedged so that the returns you see are driven by stock selection rather than currency fluctuation. The manager pursues a “bottom up” discipline which starts by weeding out as much trash as humanly possible before proceeding to a meticulous investment in both the fundamentals of the remaining businesses and their intrinsic value. The fund is diversified and will generally hold 50-150 positions. As of July 2016, there are 84. Continue reading →

Catalyst/MAP Global Balanced (TRXAX, TRXIX), August 2016

By David Snowball

At the time of publication, this fund was named Catalyst/MAP Global Total Return Income.

Objective and strategy

The manager attempts to preserve capital while generating a combination of current income and moderate long-term capital gains. The portfolio has four sleeves:

  • 40-65 global equity positions constituting 30-70% of the portfolio depending on market conditions. Over the past five years, the range has been 54-62%.
  • Income-generating covered calls which might be sold on 0-30% of the portfolio. Of late option premiums have not justified writing.
  • Short/intermediate-term bonds, generally rated B+ or better and generally with an average maturity of approximately a year.
  • Cash, which has traditionally been 5-15% of the portfolio.

The portfolio is unconstrained by geography, credit quality or market cap. The manager is risk conscious, looking for securities that combine undervaluation with a definable catalyst which will lead the market to recognize its intrinsic value. Continue reading →

Intrepid Endurance (ICMAX), April 2016

By David Snowball

Objective and strategy

The fund pursues long-term capital appreciation by investing in high quality small cap equities, which they’ll only buy and hold when they’re undervalued. “Small stocks” are stocks comparable in size to those in common indexes like the Russell 2000; currently, that means a maximum cap of $6.5 billion. The fund can hold domestic and international common stocks, preferred stocks, convertible preferred stocks, warrants, and options. They typically hold 15-50 securities. High quality businesses, typically, are “internally financed companies generating cash in excess of their business needs, with predictable revenue streams, and in industries with high barriers to entry.” The managers calculate the intrinsic value of a lot of small companies, though very few are currently selling at an acceptable discount to those values. As a result, the fund has about two-thirds of its portfolio in cash (as of March 2016). When opportunities present themselves, though, the managers deploy their cash quickly; in 2011, the fund moved from 40% cash down to 20% in the space of two weeks.  

Adviser

Intrepid Capital Management. Intrepid was founded in 1994 by the father and son team of Forrest and Mark Travis. It’s headquartered in Jacksonville, Florida; the location is part of a conscious strategy to distance themselves from Wall Street’s groupthink. Rather distinctively, their self-description stresses the importance of the fact that their managers have rich, active lives (“some of us surf … others spend weekends at kids’ football games”) outside of work. That focus “makes us a better company and better managers.” They are responsible for “approximately $800 million for individuals and institutional investors through a combination of separately managed accounts, no-load mutual funds, and a long/short hedge fund.” They advise six mutual funds.

Manager

Jayme Wiggins, Mark Travis and Greg Estes. Mr. Wiggins, whose first name is pronounced “Jay Mee,” is the lead manager and the guy responsible for the fund’s day-to-day operations. His career is just a bit complex: right after college, he joined Intrepid in 2002 where he worked as an analyst on the strategy before it even became a fund. In 2005 Jayme took over the high-yield bond strategy which, in 2007, was embodied in the new Intrepid Income Fund (ICMUX). In 2008, he left to pursue his MBA at Columbia. While he was away, Endurance’s lead manager Eric Cinnamond left to join River Road Asset Management. Upon his return in September 2010, Jayme became lead manager here. Mr. Travis is one of Intrepid’s founders and the lead manager on Intrepid Capital (ICMBX). Mr. Estes, who joined the firm in 2000, is lead manager of Intrepid Disciplined Value (ICMCX). Each member of the team contributes to each of the firm’s other funds.

Strategy capacity and closure

The managers would likely begin discussions about the fund’s assets when it approaches the $1 billion level, but there’s no firm trigger level. What they learned from the past was that too great a fraction of the fund’s assets represented “hot money,” people who got excited about the fund’s returns without ever becoming educated about the fund’s distinctive strategy. When the short-term returns didn’t thrill them, they fled. The managers are engaged now in discussions about how to attract more people who “get it.” Their assessment of the type of fund flows, as much as their amount, will influence their judgment of how and when to act.

Management’s stake in the fund

All of the fund’s managers have personal investments in it. Messrs. Travis and Wiggins have between $100,000 and $500,000 while Mr. Estes has between $10,000 and $50,000. The fund’s three independent directors also all have investments in the fund; it’s the only Intrepid fund where every director has a personal stake.

Opening date

The underlying small cap strategy launched in October, 1998; the mutual fund was opened on October 3, 2005.

Minimum investment

$2,500 for Investor shares, $250,000 for Institutional (ICMZX) shares.

Expense ratio

1.30%(Investor class) or 1.15%(Institutional class) on assets of approximately $53.3 million, as of July 2023.

Comments

Start with two investing premises that seem uncontroversial:

  1. You should not buy businesses that you’ll regret owning. At base, you wouldn’t want to own a mismanaged, debt-ridden firm in a dying industry.
  2. You should not pay prices that you’ll regret paying. If a company is making a million dollars a year, no matter how attractive it is, it would be unwise to pay $100 million for it.

If those strike you as sensible premises, then two conclusions flow from them:

  1. You should not buy funds that invest in businesses regardless of their quality or price. Don’t buy trash, don’t pay ridiculous amounts even for quality goods.
  2. You should buy funds that act responsibly in allocating money based on the availability of quality businesses at low prices. Identify high quality goods that you’d like to own, but keep your money in your wallet until they’re on a reasonable sale.

The average investor, individual and professional, consistently disregards those two principles. Cap-weighted index funds, by their very nature, are designed to throw your money at whatever’s been working recently, regardless of price or quality. If Stock A has doubled in value, its weighting in the index doubles and the amount of money subsequently devoted to it by index investors doubles. Conversely, if Stock B halves in value, its weighting is cut in half and so is the money devoted to it by index funds.

Most professional investors, scared to death of losing their jobs because they underperformed an index, position their “actively managed” funds as close to their index as they think they can get away with. Both the indexes and the closet indexers are playing a dangerous game.

How dangerous? The folks at Intrepid offer this breakdown of some of the hot stocks in the S&P 500:

Four S&P tech stocks—Facebook, Amazon, Netflix, and Google (the “FANGs”)—accounted for $450 billion of growth in market cap in 2015, while the 496 other stocks in the S&P collectively lost $938 billion in capitalization. Amazon’s market capitalization is $317 billion, which is bigger than the combined market values of Walmart, Target, and Costco. These three old economy retailers reported trailing twelve month GAAP net income of nearly $17 billion, while Amazon’s net income was $328 million.

As of late March, 2016, Amazon trades at 474 times earnings. The other FANG stocks sell for multiples of 77, 330 and 32. Why are people buying such crazy expensive stocks? Because everyone else is buying them.

That’s not going to end well.

The situation among small cap stocks is worse. As of April 1, 2016, the aggregate price/earnings ratio for stocks in the small cap Russell 2000 index is “nil.” It means, taken as a whole, those 2000 stocks had no earnings over the past 12 months. A year ago, the p/e was 68.4. In late 2015, the p/e ratios for the pharma, biotech, software, internet and energy sectors of the Russell 2000 were incalculable because those sectors – four of five are very popular sectors – have negative earnings.

“Small cap valuations,” Mr. Wiggins notes, “are pretty obscene. In historical terms, valuations are in the upper tier of lunacy. When that corrects, it’s going to get really bad for everybody and small caps are going to be ground zero.”

At the moment, just 50 of 2050 active U.S. equity mutual funds are holding significant cash (that is, 20% or more of total assets). Only nine small cap funds are holding out. That includes Intrepid Endurance whose portfolio is 67% cash.

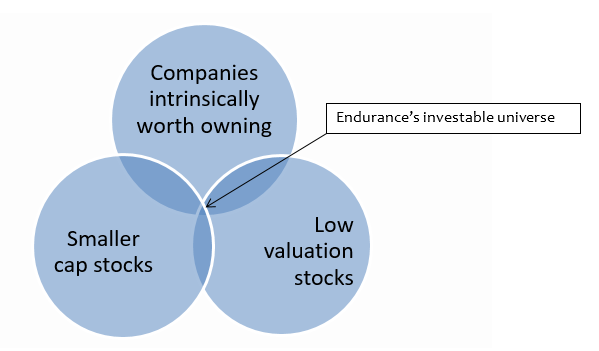
Endurance looks for 30-40 high-quality companies, typically small cap names, whose prices are low enough to create a reasonable margin of safety. Mr. Wiggins is not willing to lower his standards – for example, he doesn’t want to buy debt-ridden companies just because they’re dirt cheap – just for the sake of buying something. You’ll see the challenge he faces as you consider the Observer’s diagram of the market’s current state and Endurance’s place in it.

venn

It wasn’t always that way. By his standards, “that small cap market was really cheap in ‘09 to fairly-priced in 2011 but since then it’s just become ridiculously expensive.”

For now, Mr. Wiggins is doing what he needs to do to protect his investors in the short term and enrich them in the longer term. He’s got 12 securities in the portfolio, in addition to the large cash reserve. He’s been looking further afield than usual because he’d prefer being invested to the alternative. Among his recent purchases are the common stock of Corus Entertainment, a small Canadian firm that’s Canada’s largest owner of women’s and children’s television networks, and convertible shares in EZcorp, an oddly-structured (hence mispriced) pawn shop operator in the US and Mexico.

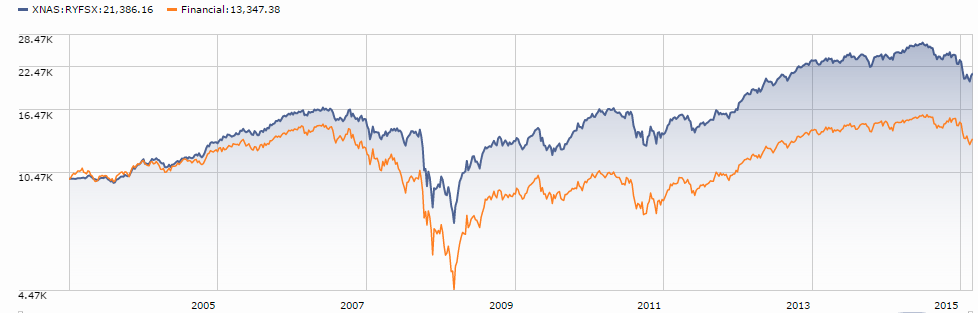
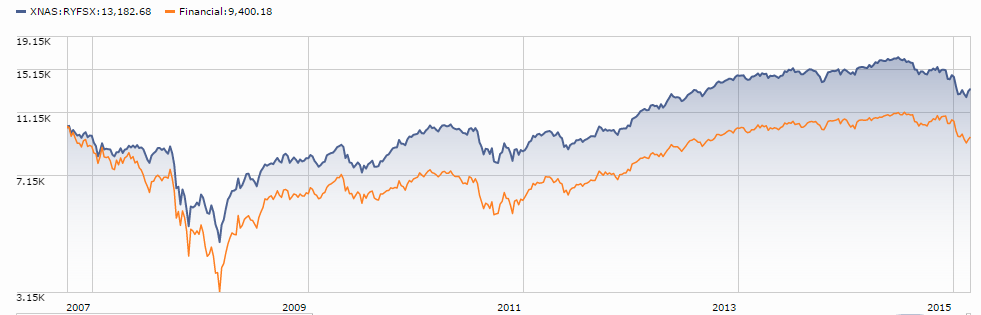
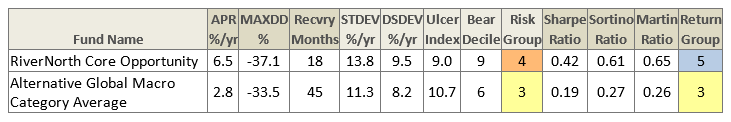
While you might be skeptical of a fund that’s holding so much cash, it’s indisputable that Intrepid Endurance has been the single best steward of its shareholders’ money over the full market cycle that began in the fall of 2007. We track three sophisticated measures of a fund’s risk-return tradeoff: its Sharpe ratio, Sortino ratio and Martin ratio.

Endurance has the highest score on all three risk-return ratios among all small cap funds – domestic, global, and international, value, core and growth.  

We track short-term pain by looking at a fund’s maximum drawdown, its Ulcer index which measures the depth and duration of a drawdown, its standard deviation and downside deviation.

Endurance has the best or second best record, among all small cap funds, on all of those risk measures. It also has the best performance during bear market months.

And it has substantially outperformed its peers. Over the full cycle, Endurance has returned 3.6% more annually than the average small-value fund. Morningstar’s Katie Reichart, writing in December 2010, reported that “the fund’s annualized 12% gain during [the past five years] trounced nearly all equity funds, thanks to the fund’s stellar relative performance during the market downturn.”

Bottom Line

Endurance is not a fund for the impatient or impetuous. It’s not a fund for folks who love the thrill of a rushing, roaring bull market. It is a fund for people who know their limits, control their greed and ask questions like “if I wanted to find a fund that I could trust to handle the next seven to ten years while I’m trying to enjoy my life, which would it be?” Indeed, if your preferred holding period for a fund is measured in weeks or months, the Intrepid folks would suggest you go find some nice ETF to speculate with. If you’re looking for a way to get ahead of the inevitable crash and profit from the following rebound, you owe it to yourself to spend some time reading Mr. Wiggins’ essays and doing your due diligence on his fund.

Fund website

Intrepid Endurance Fund

© Mutual Fund Observer, 2016. All rights reserved. The information here reflects publicly available information current at the time of publication. For reprint/e-rights contact us.

Royce Global Financial Services (RYFSX), March 2016

By David Snowball

Objective and strategy

The fund seeks long-term capital appreciation by investing in micro-, small- and mid-cap financial services stocks with market caps up to $5 billion. The financial services industry includes banks, savings & loans, insurance, investment managers, brokers, and the folks who support them. The managers anticipate having 40% of the portfolio in non-U.S. stocks with up to 10% in the developing markets. The fund holds about 100 stocks. The managers look for companies with excellent business strengths, high internal rates of return, and low leverage. They buy when the stocks are trading at a significant discount.

Adviser

Royce & Associates, LLC, is owned by Legg Mason, though it retains autonomy over its investment process and day-to-day operations. Royce is a small-company specialist with 18 open-end funds, three closed-end funds, two variable annuity accounts, and a several separately managed accounts. It was founded by Mr. Royce in 1972 and now employs more than 100 people, including 30 investment professionals. As of 12/31/2015, Royce had $18.5 billion in assets under management. $111 million of that amount was personal investments by their staff. When we published our 2008 profile, Royce had 27 funds and $30 billion and slightly-higher internal investment.

Managers

Charles Royce and Chris Flynn. Mr. Royce is the adviser’s founder, CEO and senior portfolio manager. He often wears a bowtie, and manages or co-manages six other Royce funds. Mr. Flynn serves as assistant portfolio manager and analyst here and on three other funds. They’ve overseen the fund since inception.

Strategy capacity and closure

Royce estimates the strategy could handle $2 billion or so, and notes that they haven’t been hesitant to close funds when asset flows become disruptive.

Management’s stake in the fund

Mr. Royce has over $1,000,000 directly invested in the fund. Mr. Flynn has invested between $50,000 – 100,000. All told, insiders owned 5.70% of the fund’s shares as of November 30, 2015.

Opening date

December 31, 2003

Minimum investment

$2,000 for regular accounts, $1000 for IRAs.

Expense ratio

1.53% on an asset base of $26 million, as of July 2023, with a 1% redemption fee on shares held less than 30 days.

Comments

Royce Global Financial Services Fund is a financial sector fund unlike any other. First, it invests in smaller firms. The fund’s average market cap is about $2 billion while its average peer’s is $27 billion. Over 20% of the portfolio is invested in microcap stocks, against a norm of 2%. Second, it invests internationally. About 32% of the portfolio is invested internationally, which that rising steadily toward the 40% threshold required by the “global” name. For the average financial services fund, it’s 5%. Third, it pursues value investing. That’s part of the Royce DNA. Financial services firmly are famously tricky to value but, measured by things like price/cash flow, price/sales or dividend yield, the portfolio trades at about half the price of its average peer. And fourth, it doesn’t focus on banks and REITs. Just 11% of the fund is invested in banks, mostly smaller and regional, and real estate is nearly invisible. By contrast, bank stocks constitute 34% of the S&P Financial Sector Index and REITs add 18% more.

In short: it’s way different. The question is, should you make room for it in your portfolio? The answer to that question is driven by your answer to two others: (1) should you overweight the financial sector? And (2) if so, are there better options available?

On investing in the financial services sector.

Two wise men make the case. Illegal withdrawals specialist Willie Sutton is supposed to have answered the question “why do you rob banks?” with “because that’s where the money is.” And remember all that advice from Baron Rothschild that you swore you were going to take next time? The stuff about buying “when there’s blood in the streets” and the advice to “buy on the sound of cannons and to sell on the sound of trumpets”? Well, here’s your chance, little bubba!

Over the 100 months of the latest market cycle, the financial services sector has returned less than zero. From November 2007 to January 2016, funds in this category have lost 0.3% annually while the Total Stock Market gained 5.0%. If you had to guess what sector had suffered the worst losses in the six months from last July to January, you’d probably guess energy. And you’d be wrong: financials lost more, though by just a bit. In the first two months of 2016, the sector dropped another 10%.

That stock stagnation has occurred at the same time that the underlying corporations have been getting fundamentally stronger. The analysts at Charles Schwab (2016) highlight a bunch of positive developments:

Growing financial strength: Most financial institutions have paid back government loans and some are increasing share buybacks and dividend payments, illustrating their growing health and stability.

Improving consumer finances: Recent delinquent loan estimates have decreased among credit card companies, indicating improving balance sheets.

… the pace at which new rules and restrictions have been imposed is leveling off. With balance sheets solidified, financial companies are now being freed from some regulatory restrictions. This should allow them to make better business decisions, as well as raise dividend payments and increase share-buyback programs, which could help bolster share prices.

The combination of falling prices and strengthening fundamentals means that the sector as a whole is selling at huge discount. In mid-February, the sector was priced at 72% of fair value by Morningstar’s calculation. That’s comparable to discounts at the end of the 2000-02 bear and during the summer 2011 panic; the only deeper discounts this century occurred for a few weeks in the depths of the 2007-09 meltdown. PwC, formerly Price Waterhouse Coopers, looks at different metrics and reaches the same general conclusion. Valuations are even lower in Europe. The cheapest quintile in the Euro Stoxx 50 are almost all financial firms. Luca Paolini, chief strategist for Pictet Asset Management in London, worried that “There is some exaggerated concern about the systemic risk in the banking sector. The valuations seem extreme. The gap must close at some point this year.”

Are valuations really low, here and abroad? Yes, definitely. Has the industry suffered carnage? Yes, definitely. Could things in the financial sector get worse? Yes, definitely. Does all of that raise the prospect of abnormal returns? Again yes, definitely.

On investing with Royce

There are two things to note here.

First, the Royce portfolio is structurally distinctive. Royce is a financial services firm and they believe they have an intimate understanding of their part of the industry. Rather than focusing on huge multinationals, they target the leaders in a whole series of niche markets, such as asset management, that they understand really well. They invest in WisdomTree (WETF), the only publicly-traded pure-play ETF firm. They own Morningstar (MORN), the folks who rate funds and ETFs, a half dozen stock exchanges and Charles Schwab (SCHW) where they’re traded, and MSCI (MSCI), the ones who provide investable indexes to them. When they do own banks, they’re more likely to own Umpqua Holdings (UMPQ) than Wells Fargo. Steve Lipper, a principal at Royce whose career also covers long stints with Lipper Analytics and Lord, Abbett, says, “Basically what we do is give capital to really bright people in good businesses that are undergoing temporary difficulties, and we do it in an area where we practice every day.”

These firms are far more attractive than most. They’re less capital-intense. They’re less reliant on leverage. They less closely regulated. And they’re more likely to have a distinct and defensible niche, which means they operate with higher returns on equity. Mr. Lipper describes them as “companies that could have 20% ROE perpetually but often overlooked.”

Second, Royce has done well. The data on the fund’s homepage makes a pretty compelling case for it. It’s beaten the Russell 2500 Financials index over the past decade and since inception. It’s earned more than 5% annually in 100% of the past rolling 10-year periods. It’s got below average volatility and has outperformed its benchmark in all 11 major (i.e., greater than 7.5%) drawdowns in its history. It’s got a lower standard deviation, smaller downside capture and higher Sharpe ratio than its peers.

Here are two ways of looking at Royce’s returns. First, the returns on $10,000 invested at the inception of RYFSX compared to its peers.

ryfsx since inception

Second, those same returns during the current market cycle which began in October 2007, just before the crash.

ryfsx current cycle

The wildcard here is Mr. Royce’s personal future. He’s the lead manager and he’s 74 years old. Mr. Lipper explains that the firm is well aware of the challenge and is midway through a still-evolving succession plan. He’s the CEO but he’s no longer than CIO, a role now split among several colleagues. In the foreseeable future, he’s step away from the CEO role to focus on investment management. And Royce has reduced, and will continue to reduce, the number of funds for which Mr. Royce is responsible. And, firm wide, there’s been “a major rationalization” of the fund lineup to eliminate funds that lacked distinct identities or missions.

Bottom Line

There’s little question that Royce Global Financial will be a profitable investment in time. The two questions that you’ll need to answer are (1) whether you want a dedicated financial specialist and (2) whether you want to begin accumulating shares during a weak-to-wretched market. If you do, Royce is one of a very small handful of financial services funds with the distinct profile, experienced management and long record which warrant your attention.

Fund website

Royce Global Financial Services Fund. The fund’s factsheet is exceptionally solid, in a wonky sort of way, and the fund’s homepage is one of the best out there for providing useful performance analytics.

© Mutual Fund Observer, 2016. All rights reserved. The information here reflects publicly available information current at the time of publication. For reprint/e-rights contact us.

AXS Market Neutral (formerly Cognios Market Neutral), (COGMX), February 2016

By David Snowball

At the time of publication, this fund was named Cognios Market Neutral.

Objective and strategy

The fund seeks long-term growth of capital independent of stock market direction. The managers balance long and short positions in domestic large cap stocks within the S&P 500 universe. They calculate a company’s Return on Tangible Assets (ROTA) and Return on Market Value of Equity (ROME). The former is a measure of a firm’s value; the latter measures its stock valuation. They buy good businesses as measured by ROTA and significantly undervalued firms as measured by ROME. Their short positions are made up of poor businesses that are significantly overvalued. As a risk-management measure and to achieve beta neutrality, their individual short positions are generally a lower dollar amount, but constitute more names than the long portfolio.

Adviser

Cognios Capital LLC. Cognios, headquartered near Kansas City was founded in 2008. It’s an independent quantitative investment management firm that pursues both long-only and hedged strategies. As of December 31, 2015, they had $388 million in assets under management. They manage a hedge fund and accounts for individual and institutional clients as well as the mutual fund. The senior folks at Cognios are deeply involved with charitable organizations in the Kansas City area.

Manager

Jonathan Angrist, Brian Machtley and Francisco Bido. Mr. Angrist, Cognios’s cofounder, president and chief investment officer, has co-managed the fund since its inception. He co-owned and was a portfolio manager at Helzberg Angrist Capital, an alternative asset manager that was the predecessor firm to Cognios. He helped launch, and briefly managed, Buffalo Micro Cap fund. Mr. Machtley, Cognios’ chief operating officer, has co-managed the fund since its inception. Previously, Mr. Machtley served as an associate portfolio manager at a Chicago-based hedge fund manager focused on micro-capitalization equities. Mr. Bido is Cognios’ head of quantitative research. Prior to joining Cognios in 2013, Mr. Bido was a senior quantitative researcher with American Century Investments.

Strategy capacity and closure

At $3 billion, the managers would need to consider closing the fund. The strategy capacity is limited primarily by its short portfolio, which has more numerous but smaller positions than the long portfolio.

Management’s stake in the fund

Messrs. Angrist and Machtley have between $100,000 – 500,000 each in the fund. Mr. Bido has between $10,000 – 50,000.  One of the fund’s trustees has an investment of $10,000 – $50,000 in the fund. The vast majority of the fund’s shares – 98% of investor shares and 64% of institutional ones, as of the last Statement of Additional Information – were owned by the A. Joseph Brandmeyer Trust. Mr. Brandmeyer founded the medical supplies company Enturia and is the father of one of the Cognios founders.

Opening date

31 December 2012

Minimum investment

$1,000 for the investor shares (COGMX) and $100,000 for the institutional shares (COGIX).

Expense ratio

The net expense ratio is 3.88% which includes all the dividend expense on securities sold short, borrowing costs and brokerage expenses totaling 2.18%. The AUM is $20.6 million, as of June 2023. 

Comments

Market neutral funds, mostly, are a waste of time. In general, they invest $1 long in what they consider to be a great stock and $1 short in what they consider to be an awful one. Because there are equal long and short positions, the general movement of the stock market should be neutralized. At that point, the fund’s return is driven by the difference in performance between a great stock and an awful one: if the great stock goes up 10% and the awful one goes up 5%, the fund makes 5%. If the great stock drops 5% and the awful one drops 10%, the fund makes 5%.

Sadly, practice badly lags the theory. The average market neutral fund has made barely 1% annually over the past three and five year periods. On average, they lost money in the turbulent January 2016 with about 60% of the category in the red. Only two market neutral funds have managed to earn 5% or more over the past five years while two others have lost 5% or more. No matter how low you set the bar, the great majority of market neutral funds cannot clear it. In short, they charge hedge fund-like fees for the prospect of cash-like returns.

Why bother?

The short answer is, because we need risk mitigation and our traditional tool for it – investing in bonds – is likely to fail us. Bonds are generating very little income, with interest rates at or near zero there’s very little room for price appreciation (the price of bonds rise when interest rates fall), there are looming questions about liquidity in the bond market and central bankers have few resources left to boost markets.

Fortunately, a few market neutral funds seem to have gotten the discipline right. Cognios is one of them. The fund has returned 7.6% annually over the three years of its existence, while its peers made 1.2%. In January 2016, the fund returned 4.3% while the stock market dropped 5% and its peers lost a fraction of a percent. That record places it in the top 4% of its peer group in the company of two titans: BlackRock and Vanguard.

What has Cognios gotten right?

  1. Their portfolio is beta neutral, rather than dollar neutral. In a typical dollar-neutral portfolio, there’s $1 long for $1 short. That can be a serious problem if the beta characteristics of the short portfolio don’t match those of the long portfolio; a bunch of high beta shorts paired with low beta long positions is a recipe for instability and under-performance. Cognios focuses on keeping the portfolio beta-neutral: if the beta of the short portfolio is high relative to the long, they reduce the size of the short portfolio. That more completely cancels the effects of market movements on the fund’s return.
  2. Their long positions are in high-quality value stocks, rather than growth ones. They use a quantitative screen called ROTA/ROME ™. ROTA (Return on Tangible Assets) is a way of identifying high-quality businesses. At base, it measures a sort of capital efficiency: a company that generates $300 million in returns on a $1 billion in assets is doing better than a company that generates $150 million in returns on those same assets. Cognios research shows ROTA to be a stable identifier of high quality firms; that is, firms that use capital well in one period tend to continue doing so in the future. As Mr. Buffett has said, “A good business is one that earns high return on tangible assets. That’s pretty simple. The very best businesses are the ones that earn a high return on tangible assets and grow.” The combined quality and value screens skew the portfolio toward value. They also only invest in S&P 500 stocks – no use of derivatives, futures or swaps.
  3. They target equity-like returns. Most market neutral managers strive for returns in the low single-digits, to which Mr. Angrist echoes the question: “why bother?” He believes that with a more concentrated portfolio – perhaps 50 long positions and 100 short ones – he’s able to find and exploit enough mispriced securities to generate substantially better returns.
  4. They don’t second-guess their decisions. Their strategy is mechanical and repeatable. They don’t make top-down calls about what sectors are attractive, nor do they worry about the direction of the market, terrorism, interest rates, oil prices or the Chinese banking system. If they’ve managed to neutralize the effect of market movements on the portfolio, they’ve also made fretting about such things irrelevant. So they don’t.
  5. They focus. This is their flagship product and their only mutual fund.

Bottom Line

A market neutral strategy isn’t designed to thrive in a bull market, where even bad companies are assigned ever-rising prices. These funds are designed to serve you in uncertain or falling markets. It’s unclear, with the prospect that both stocks and bonds might be volatile and falling, that traditional strategies will fully protect you. GMO’s December 2015 asset class returns suggest that a traditional 60/40 hybrid fund will lose 1.4% annually in real terms over the next five to seven years. Of the three market neutral funds with the best records (Vanguard Market Neutral VMNFX with a $250,000 minimum and BlackRock Event Driven Equity BALPX with a 5.75% load are the other two), Cognios is by far the smallest, most accessible and most interesting. You might want to learn more about it.

Fund website

AXS Market Neutral Fund

© Mutual Fund Observer, 2016. All rights reserved. The information here reflects publicly available information current at the time of publication. For reprint/e-rights contact us.

Leuthold Core Investment (LCORX), February 2016

By David Snowball

Objective and strategy

Leuthold Core pursues capital appreciation and income through the use of tactical asset allocation. Their objective is to avoid significant loss of capital and deliver positive absolute returns while assuming lower risk exposure and lower relative volatility than the S&P 500. Assets are allocated among stocks and ADRs, corporate and government bonds, REITs, commodities, an equity hedge and cash. At one time, the fund’s commodity exposure included direct ownership of physical commodities. Portfolio asset class weightings change as conditions do; exposure is driven by models that determine each asset class’s relative and absolute attractiveness. Equity and fixed-income exposure each range from 30-70% of the portfolio. At the end of 2013, equities comprised 67% of the portfolio. At the end of 2015, 55% of the portfolio was invested in “long” equity positions and 17% was short, for a net exposure under 40%.

Adviser

Leuthold Weeden Capital Management (LWCM). The Leuthold Group began in 1981 as an institutional investment research firm. Their quantitative analyses eventually came to track several hundred factors, some with data dating back to the Great Depression. In 1987, they founded LWCM to direct investment portfolios using the firm’s financial analyses. They manage $1.6 billion through five mutual funds, separate accounts and limited partnerships.

Manager

Doug Ramsey, Chun Wang, Jun Zhu and Greg Swenson. Mr. Ramsey joined Leuthold in 2005 and is their chief investment officer. Mr. Swenson joined Leuthold in 2006 from FactSet Research. Ms. Zhu came to Leuthold in 2008 after earning an MBA from the Applied Security Analysis Program at the University of Wisconsin-Madison. While there, she co-managed a $60 million university endowment fund run by students at the program. Mr. Wang joined in 2009 after a stint with a Hong Kong-based hedge fund and serving as director of research for Ned Davis Research. Collectively the team shares responsibility for testing and refining the firm’s quantitative models and for managing four of their five funds, Grizzly Short (GRZZX) excepted.

Strategy capacity and closure

About $5 billion. Core was hard-closed in 2006 when it reached $2 billion in assets. That decision was driven by limits imposed by the manager’s ability to take a meaningful position in the smallest of the 155 industry groups (e.g. industrial gases) that they then targeted. Following Steve Leuthold’s retirement to lovely Bar Harbor, Maine, the managers studied and implemented a couple refinements to the strategy (somewhat fewer but larger industry groups, somewhat less concentration) that gave the strategy a bit more capacity.

Management’s stake in the fund

Three of the fund’s four managers have investments in the fund, ranging from Mr. Swenson’s $50,000 – 100,000 on the low end to Mr. Ramsey at over $1 million on the high end. All four of the fund’s trustees have substantial investments either directly in the fund or in a separately-managed account whose strategy mirrors the fund’s.

Opening date

November 20, 1995.

Minimum investment

$10,000, reduced to $1,000 for IRAs. The minimum for the institutional share class (LCRIX) is $1,000,000.

Expense ratio

1.16% on assets of $871 million, as of January 2016.

Comments

Leuthold Core Investment was the original tactical asset allocation fund. While other, older funds changed their traditional investment strategies to become tactical allocation funds when they came in vogue three or four years ago, Leuthold Core has pursued the same discipline for two decades.

Core exemplifies their corporate philosophy: “Our definition of long-term investment success is making money . . . and keeping it.”

It does both of those things. Here’s how:

Leuthold’s asset allocation funds construct their portfolios in two steps: (1) asset allocation and (2) security selection. They start by establishing a risk/return profile for the bond market and establishing the probability that stocks will perform better. That judgment draws on Leuthold’s vast experience with statistical analysis of the market and the underlying economies. Their “Major Trends Index,” for example, tracks over 100 variables. This judgment leads them to set the extent of stock exposure. Security selection is then driven by one of two strategies: by an assessment of attractive industries or of individually attractive stocks.

Core focuses on industry selection and its equity portfolio is mirrored in Leuthold Select Industries. Leuthold uses its quantitative screens to run through over 115 industry-specific groups composed of narrow themes, such as Airlines, Health Care Facilities, and Semiconductors to establish the most attractive of them. Core and Select Industries then invest in the most attractive of the attractive sectors. Mr. Ramsey notes that they’ll only consider investing in the most attractive 20% of industries; currently they have positions in 16 or 17 of them. Within the groups, they target attractively priced, financially sound industry leaders. Mr. Ramsay’s description is that they function as “value investors within growth groups.” They short the least attractive stocks in the least attractive industries.

Why should you care? Leuthold believes that it adds value primarily through the strength of its asset allocation and industry selection decisions. By shifting between asset classes and shorting portions of the market, it has helped investors dodge the worst of the market’s downturns. Here’s a simple comparison of Core’s risk and return performance since inception, benchmarked against the all-equity S&P 500.

  APR MaxDD Months Recover Std Dev Downside Dev Ulcer Index Bear Dev Sharpe Ratio Sortino Ratio Martin Ratio
Good if … Higher Lower Lower Lower Lower Lower Lower Higher Higher Higher
Leuthold Core 8.4 -36.5 35 11.0 7.5 8.9 6.8 0.55 0.81 0.68
S&P 500 Monthly Reinvested Index 8.2 -50.9 53 15.3 10.7 17.5 10.3 0.38 0.55 0.34
Leuthold: check check check check check check check check check check

Over time, Core has had slightly higher returns and substantially lower volatility than has the stock market. Morningstar and Lipper have, of course, different peer groups (Tactical Allocation and Flexible Portfolio, respectively) for Core. It has handily beaten both. Core’s returns are in the top 10% of its Morningstar peer groups for the past 1, 3, 5, 10 and 15 year periods.

Our Lipper data does not allow us to establish Leuthold’s percentile rank against its peer group but does show a strikingly consistent picture of higher upside and lower downside than our “flexible portfolio” funds. In the table below, Cycle 4 is the period from the dot-com crash to the start of the ’08 market crisis while Cycle 5 is from the start of the market crisis to the end of 2015. The 20-year report is the same as the “since inception” would be.

  Time period Flexible Portfolio Leuthold Core Leuthold
Annualized Percent Return 20 Year 7.1 8.4 check
10 Year 4.9 5.3 check
5 Year 4.1 5.6 check
3 Year 3.3 8.6 check
1 Year -5.2 -1.0 check
Cycle 4 7.3 11.9 check
Cycle 5 2.8 3.1 check
Maximum Drawdown 20 Year -38.6 -36.5 check
10 Year -36.5 -36.5 check
5 Year -14.9 -15.4 check
3 Year -11.1 -3.7 check
1 Year -9.4 -3.2 check
Cycle 4 -23.8 -21.8 check
Cycle 5 -36.9 -36.5 check
Recovery Time, in months 20 Year 50 35 check
10 Year 43 35 check
5 Year 18 23 X
3 Year 12 4 check
1 Year 8 7 check
Cycle 4 39 26 check
Cycle 5 43 35 check
Standard Deviation 20 Year 11.9 11.0 check
10 Year 11.7 12.0 X
5 Year 9.3 8.5 check
3 Year 8.1 7.0 check
1 Year 8.7 4.9 check
Cycle 4 9.9 10.4 X
Cycle 5 12.7 12.9 X

Modestly higher short-term volatility is possible but, in general, more upside and less downside than other similarly active funds. And, too, Leuthold costs a lot less: 1.16% with Leuthold rather than 1.42% for its Morningstar peers.

Bottom Line

At the Observer, we’re always concerned about the state of the market because we know that investors are much less risk tolerant than they think they are. The years ahead seem particularly fraught to us. Lots of managers, some utterly untested, promise to help you adjust to quickly shifting conditions. Leuthold has delivered on such promises more consistently, with more discipline, for a longer period than virtually any competitor. Investors who perceive that storms are coming, but who don’t have the time or resources to make frequent adjustments to their portfolios, should add Leuthold Core to their due-diligence list.

Investors who are impressed with Core’s discipline but would like a higher degree of international exposure should investigate Leuthold Global (GLBLX). Global applies the same discipline as Core, but starts with a universe of 5000 global stocks rather than 3000 domestic-plus-ADRs one.

Fund website

Leuthold Core Investment Fund

© Mutual Fund Observer, 2016. All rights reserved. The information here reflects publicly available information current at the time of publication. For reprint/e-rights contact us.

Fidelity Total Emerging Markets (FTEMX), December 2015

By David Snowball

Objective and strategy

FTEMX seeks income and capital growth by investing in both emerging markets equities and emerging markets debt. White their neutral weighting is 60/40 between stocks/bonds, the managers adjust the balance between equity and debt based on which universe is most attractively positioned. In practice, that has ranged between 55% – 75% in equities. Within equities, sector and regional exposure are driven by security selection; they go where they find the best opportunities. The debt portfolio is distinctive; it tends to hold US dollar-denominated debt (a conservative move) but overweight frontier and smaller emerging markets (an aggressive one).

Adviser

Fidelity Investments. Fidelity has a bewildering slug of subsidiaries spread across the globe. Collectively they manage 575 mutual funds, over half of those institutional, and $2.1 trillion in assets.

Managers

John Carlson and a five person team of EM equity folks. Mr. Carlson has managed Fidelity’s EM bond fund, New Markets Income (FNMIX), since 1995. He added Global High Income (FGHIX) in 2011. He was Morningstar’s Fixed-Income Manager of the Year in 2011. He manages $7.8 billion and is supported by a 15 person team. The equity managers are Timothy Gannon, Jim Hayes, Sam Polyak, Greg Lee and Xiaoting Zhao. Gannon, Hayes and Polyak have been with the fund since inception, Lee was added in 2012 and Zhao in 2015. These folks have been responsible since 2014 for Emerging Markets Discovery (FEDDX), a four star fund with a small- to mid-cap bias. They also help manage Fidelity Series Emerging Markets (FEMSX), a four star fund that is only available to the managers of Fidelity funds-of-funds. The equity managers are each responsible for investing in a set of industries: Hayes (financials, telecom, utilities), Polyak (consumer and materials), Lee (industrials), Gannon (health care) and Zhao (tech). They help manage between $2 – 12 billion each.

Management’s stake in the fund

Messrs. Carlson, Gannon and Hayes have each invested between $100,000 and $500,000. Mr. Lee and Mr. Polyak have no investment in the fund. None of the fund’s 10 trustees have an investment in it. While they oversee Fidelity’s entire suite of EM funds, five of the 10 have no investment in any of the EM funds.

Opening date

November 1, 2011

Minimum investment

$2,500

Expense ratio

1.12% on assets of $229.7 million (as of 7/6/2023). 

Comments

Simple, simple, simple.

The argument for considering an emerging markets fund is simple: they offer the prospect of being the world’s best performing asset class over the next 5 or 10 years. In October 2015, GMO estimated that EM stocks (4.0% real return) would be the highest returning asset class over the next 5-7 years, EM bonds (2.2%) would be second. Most other asset classes were projected to have negative real returns. At the same moment, Rob Arnott’s Research Affiliates was more optimistic, suggesting that EM stocks are priced to return 7.9% a year with high volatility compared with 1.1% in the US and 5.3% in the other developed markets. Given global demographics, it wouldn’t be surprising, give or take the wildcard effects of global warming, for them to be the best asset class over the next 50 or 100 years as well.

The argument against considering an emerging markets fund is simple: emerging markets are a mess. Their markets tend to be volatile. 30-60% drawdowns are not uncommon. National economies are overleveraged to commodity prices and their capital markets (banks, bond auctions, stock markets) can’t be relied upon; Andrew Foster, my favorite emerging markets manager and head of the Seafarer fund, argues that broken capital markets are almost a defining characteristic of the emerging markets. Investors yanked over a trillion dollars from emerging markets over the past 12 months.

The argument for investing in emerging markets through a balanced fund is simple: they combine higher returns and lower volatility than you can achieve through 100% equity exposure. The evidence here is a bit fragmentary (because the “e.m. balanced” approach is new and neither Morningstar nor Lipper have either a peer group or a benchmark) but consistent. The oldest EM balanced fund, the closed-end First Trust Aberdeen Emerging Opportunities Fund (FEO), reports that from 2006-2014 a blended benchmark returned 6.9% annually while the FTSE All World Emerging Market Equity Index returned 5.9%. From late 2011 to early 2015, Fidelity calculates that a balanced index returned 5.6% while the MSCI Emerging Markets Index returns 5.1%. Both funds have lower standard deviations and higher since-inception returns than an equity index. Simply rebalancing each year between Fidelity’s EM stock and bond funds so that you end up with a 60/40 weighting in a hypothetical balanced portfolio yields the same result for the past 10- and 15-year periods.

If balanced makes sense, does Fidelity make special sense?

Probably.

Two things stand out. First, the lead manager John Carlson is exceptionally talented and experienced. He’s been running Fidelity New Market Income (FNMIX), an emerging markets bond fund, since 1995. He’s the third longest-tenured EM bond manager and has navigated his fund through a series of crises initiated in Mexico, Asia and Russia. He earned Morningstar’s Fixed-Income Fund Manager of the Year in 2011. $10,000 entrusted to him when I took over FNMIX would have grown to $100,000 now while his average peer would be about $30,000 behind.

Second, it’s a sensible portfolio. Equity exposure has ranged from 55 – 73%. Currently it’s at the lowest in the fund’s history. Mr. Carlson says that “From an asset-allocation perspective, we believe shareholders can expect the sort of downside protection typically afforded by a balanced fund comprising both fixed-income and equity exposure.” He invests in dollar-denominated (so-called “hard currency”) EM bonds, which shields his investors from the effects of currency fluctuations. That makes the portfolio’s bond safety net extra safe. At the same time, he doesn’t hedge his stock exposure and is willing to venture into smaller emerging markets and frontier markets. At least in theory those are more likely to be mispriced than issues in larger markets, and they offer a bit more portfolio diversification. The manager says that “Based on about two decades of research, we found that frontier-markets debt performs much like EM equity.” In general the equity sub-portfolio’s returns are driven by individual security selection. It shows no unusual bias to any region, sector or market cap. “On the equity side, we take a sector-neutral approach that targets high active share, a measure of the percentage of holdings that differ from the index, which historically has offered greater potential for outperformance.”

Since inception in 2011, the strategy has worked. The fund has returned 2.9% a year in very rocky times while its all-equity peers lost money. Both measures of volatility, standard deviation and downside deviation, are noticeably lower than an EM equity fund’s.

ftemx

Bottom Line

I am biased in favor of EM investing. Despite substantial turmoil, it makes sense to me but only if you have a strategy for coping with volatility. Mr. Carlson has done a good job of it, making this the most attractive of the EM balanced funds on the market. There are other risk-conscious EM funds (most notable Seafarer Overseas Growth & Income SFGIX and the hedged Driehaus Emerging Markets Small Cap DRESX) but folks wanting even more of a buffer might reasonably start by looking here.

Fund website

Fidelity Total Emerging Markets

Disclosure: I own shares of FTEMX through my college’s 403b retirement plan and shares of SFGIX in my non-retirement portfolio.

RiverNorth Core Opportunity (RNCOX/RNCIX), November 2015

By David Snowball

THIS IS AN UPDATE OF THE FUND PROFILE ORIGINALLY PUBLISHED IN June 2011. YOU CAN FIND THAT ORIGINAL PROFILE HERE.

Objective and strategy

The fund seeks long-term capital appreciation and income, while trying to maintain a sense of “prudent investment risk over the long-term.” RNCOX is a “balanced” fund with several twists. First, it adjusts its long-term asset allocation in order to take advantage of tactical allocation opportunities. Second, it invests primarily in a mix of closed-end mutual funds and ETFs. Lipper’s designation, as a Global Macro Allocation fund, provides a more realistic comparison than Morningstar’s Moderate Allocation assignment.

Adviser

RiverNorth Capital Management. RiverNorth is a Chicago-based firm, founded in 2000 with a distinctive focus on closed-end fund arbitrage. They have since expanded their competence into other “under-followed, niche markets where the potential to exploit inefficiencies is greatest.” RiverNorth advises three limited partnerships and the four RiverNorth funds: RiverNorth/Oaktree High Income (RNOTX), Equity Opportunity (RNEOX), RiverNorth/DoubleLine Strategic Income (RNDLX) and this one. They manage about $3.0 billion through limited partnerships, mutual funds and employee benefit plans.

Managers

Patrick Galley and Stephen O’Neill. Mr. Galley is RiverNorth’s President, Chairman and Chief Investment Officer. He also manages all or parts of three RiverNorth funds with Mr. O’Neill. Before joining RiverNorth Capital in 2004, he was a Vice President at Bank of America in the Global Investment Bank’s Portfolio Management group. Mr. O’Neill specializes in qualitative and quantitative analysis of closed-end funds and their respective asset classes. Prior to joining RiverNorth in 2007, he was an Assistant Vice President at Bank of America in the Global Investment Bank’s Portfolio Management group. Messrs Galley and O’Neill manage about $1.7 billion in other pooled assets.

Strategy capacity and closure

The fund holds almost as much money as it did when it closed to new investors. The managers describe themselves as “comfortable now” with the assets in the fund. Three factors would affect their decision to close it again. First, market volatility makes them predisposed to stay open. That volatility feeds the CEF discounts which help drive market neutral alpha. Second, strong relative performance will draw “hot money” again, which they’d prefer to avoid dealing with. Finally, they prefer a soft close which would leave “a runway” for advisors to allocate to their clients.

Active share

“Active share” measures the degree to which a fund’s portfolio differs from the holdings of its benchmark portfolio. High active share indicates management which is providing a portfolio that is substantially different from, and independent of, the index. An active share of zero indicates perfect overlap with the index, 100 indicates perfect independence. RiverNorth does not calculate active share, though the distinctiveness of its portfolio implies a very high level of activity.

Management’s stake in the fund

Messrs. Galley and O’Neill each have between $100,000 – 500,000 in the fund. Three of the four independent trustees have relatively modest ($10,000-100,000) investments in the fund while one has no investments with RiverNorth.

Opening date

December 27, 2006. The fund added an institutional share class (RNCIX) on August 11, 2014.

Minimum investment

$5,000, reduced to $1,000 for IRAs.

Expense ratio

3.56% on assets of $45.2 million, as of July 2023. The expense ratio is heavily influenced by the pass-through expense from the closed-end funds in which it invests. 

Comments

Normally the phrase “balanced fund” causes investor’s eyes to grow heavy and their heads to nod. Traditional balanced funds make a good living by being deadly dull. They have a predictable asset allocation, 60% equities and 40% bonds. And they execute that allocation with predictable investments in blue-chip domestic companies and investment grade bonds. Their returns are driven more by expenses and avoiding mistakes than any great talent.

Morningstar places RiverNorth Core Opportunity there. They don’t belong. Benchmarking them against the “moderate allocation” group is far more likely to mislead than inform.

RiverNorth’s strategy involves pursuing both long- and short-term opportunities. They set an asset allocation then ask whether they see more opportunities in executing the strategy through closed-end funds (CEFs) or low-cost ETFs.  While both CEFs and ETFs trade like stocks, CEFs are more like active mutual funds. Because their price is set by investor demands, a share of a CEF might trade for more than the value of its holdings when greed seizes the market or far less than the value of its holdings when fear does. The managers’ implement their asset allocation with CEFs when they’re available at irrational discounts; otherwise, they use low-cost ETFs.

In general, the portfolio is 50-70% CEFs. Mr. Galley says that it’s rare to go over 70% but they did invest 98% in CEFs toward the end of during the market crisis. That move primed their rocket-like rise in 2009: their 49% gain more than doubled their peer group’s and was nearly double the S&P 500’s 26%. It’s particularly impressive that the fund’s loss in 2008 was no greater than its meek counterparts.

That illustrates an essential point: this isn’t your father’s Buick. It’s distinctive and more opportunistic. Over the fund’s life, it’s handsomely rewarded its investors with outsized returns and quick bounce backs from its declines. Here’s RiverNorth’s performance against the best passive and active options at Vanguard.

rivernorth vs vanguard

The comparison against Rivernorth’s more opportunistic peer group shows an even more stark advantage.

rivernorth

The fund is underwater by 3.4% in 2015, through October 30, after a ferocious October rally. That places them about 3.5% behind their Morningstar peer group. The short-term question for investors is whether that lag represents a failure of RiverNorth’s strategy or another example of the portfolio-as-compressed-spring? The managers observe that CEF discounts widen to levels not seen since the financial crisis. That’s led them to place 76% of the portfolio in CEFs, many that use leverage in their own portfolios. That’s well above their historic norms and implies a considerable confidence on their part.

Bottom Line

Core Opportunity offers unique opportunity, more suited to investors comfortable with an aggressive strategy than a passive one. Since inception, the fund has outperformed the S&P 500 with far less volatility (beta = 76) and has whomped similarly-aggressive funds. That long-term strength comes at the price of being out of step with, and more volatile than, traditional 60/40 funds. That’s making them look weak now. If history is any guide, that judgment is subject to a dramatic and sudden reversal. It’s well worth investigating.

Fund website

RiverNorth Core Opportunity.

© Mutual Fund Observer, 2015. All rights reserved. The information here reflects publicly available information current at the time of publication. For reprint/e-rights contact us.

Manning & Napier Pro-Blend Conservative (EXDAX), September 2015

By David Snowball

Objective and strategy

The fund’s first objective is to provide preservation of capital. Its secondary concerns are to provide income and long-term growth of capital. The fund invests primarily in fixed-income securities. It tilts toward shorter-term, investment grade issues while having the ability to go elsewhere when the opportunities are compelling. It also invests in foreign and domestic stocks, with a preference for dividend-paying equities. Finally, it may invest a bit in a managed futures strategy as a hedge. In general, though, bonds are 55-85% of the portfolio. In the past five years, stocks have accounted for 25-35% of the portfolio though they might be about 10% higher or lower if conditions warrant.

Adviser

Manning & Napier. Manning & Napier was founded in 1970 by Bill Manning and Bill Napier. They’re headquartered near Rochester, NY, with offices in Columbus, OH, Chicago and St. Petersburg. They serve a diversified client base of high-net-worth individuals and institutions, including 401(k) plans, pension plans, Taft-Hartley plans, endowments and foundations. It’s a publicly-traded company (symbol: MN) with $43 billion in assets under management. Of that, about $18 billion are in their team-managed mutual funds and the remainder in a series of separately-managed accounts.

Manager

The fund is managed by a seven-person team, headed by Jeffrey Herrmann and Marc Tommasi. Both of them have been with the fund since its launch. The same team manages all of Manning & Napier’s Pro-Blend and Target Date funds.

Management’s stake in the fund

We generally look for funds where the managers have placed a lot of their own money to work beside yours.  The managers work as a team on about 10 funds. While few of them have any investment in this particular fund, virtually all have large investments between the various Pro-Blend and Lifestyle funds.

Opening date

November 1, 1995.

Minimum investment

$2,000. That is reduced to $25 if you sign up for an automatic monthly investing plan.

Expense ratio

0.88% on $384.1 million in assets, as of July 2023.

Comments

Pro-Blend Conservative offers many of the same attractions as Vanguard STAR (VGSTX) but does so with a more conservative asset allocation. Here are three arguments on its behalf.

First, the fund invests in a way that is broadly diversified and pretty conservative. The portfolio holds something like 200 stocks and 500 bonds, plus a few dozen other holdings. Collectively those represent perhaps 25 different asset classes. No stock position occupies as much as 1% of the portfolio and it currently has much less direct foreign investment than its peers.

Second, Manning & Napier is very good. The firm does lots of things right, and they’ve been doing it right for a long while. Their funds are all team-managed, which tends to produce more consistent, risk-conscious decisions. Their staff’s bonuses are tied to the firm’s goal of absolute returns, so if investors lose money, the analysts suffer, too. The management teams are long-tenured – as with this fund, 20 year stints are not uncommon – and most managers have substantial investments alongside yours.

Third, Pro-Blend Conservative works. Their strategy is to make money by not losing money. That helps explain a paradoxical finding: they might make only half as much as the stock market in a good year but they managed to outperform the stock market over the past 15. Why? Because they haven’t had to dig themselves out of deep holes first. The longer a bull market goes on, the less obvious that advantage is. But once the market turns choppy, it reasserts itself.

At the same time, the fund has the ability to become more aggressive when conditions warrant.  It just does so carefully. Chris Petrosino, one of the Managing Directors at Manning, explained it this way:

We have the ability to be more aggressive. For us, that’s based on current market conditions, fundamentals, pricing and valuations. It may appear contrarian, but valuations dictate our actions. We use those valuations that we see in various asset classes (not only in equities), as our road map. We use our flexibility to invest where we see opportunities, which means that our portfolio often looks very different than the benchmark.

Bottom Line

Pro-Blend Conservative has been a fine performer since launch. It has returned over 6% since launch and 5.4% annually over the past 15 years. That’s about 1% per year better than either the Total Stock Market or its conservative peers. In general, the fund has managed to make between 4-5% each year; more importantly, it has made money for its investors in 19 of the past 20 years. It is an outstanding first choice for cautious investors.

Fund website

Manning & Napier Pro-Blend Conservative homepage. 

Fact Sheet

© Mutual Fund Observer, 2015. All rights reserved. The information here reflects publicly available information current at the time of publication. For reprint/e-rights contact us.

Vanguard STAR (VGSTX), August 2015

By David Snowball

Objective and strategy

This fund of funds seeks to provide long-term capital appreciation and income. As a fund of funds, Vanguard STAR invests in other Vanguard mutual funds.  It places 60% to 70% of its assets in common stocks through eight stock funds; 20% to 30% of its assets in bonds through two bond funds; and 10% to 20% of its assets in short-term investments through a short-term bond fund. The stock funds emphasize larger, well-established companies and the bond funds focus on securities issued by highly-rated borrowers. Vanguard calls it their “one fund option for investors looking for broad diversification across asset classes who can tolerate moderate market risk that comes from the volatility of the stock and bond markets.”

Adviser

The Vanguard Group, Inc. The Japanese bestow the designation “Living National Treasure” on individuals of incomparable skill who work to preserve precious elements of the culture. If the US had such as designation, Vanguard founder Jack Bogle would certainly qualify for it. He founded Vanguard in May, 1975 as the industry’s only non-profit, investor-owned fund complex; in the succeeding decades he has been consistently, successfully critical of marketing-driven investing fads and high expenses. Vanguard advertises “at cost” investing and their investor expenses are consistently the industry’s lowest. They advise 160 U.S. funds (including variable annuity portfolios) and about 120 funds for non-U.S. investors. In total they have 20 million investors and are responsible for more than $3 trillion in assets.

Managers

Michael Buek, William Coleman and Walter Nejman. The guys are mostly responsible for which of the portfolio’s funds get a bit more money and which get a bit less. The list of which funds they use hasn’t changed since 2001 and the fund’s asset allocation wobbles just a little. Their responsibilities are so administrative that from 1985 to 2009, the fund listed itself as having “no manager.”

Management’s stake in the fund

In general, you should look for funds whose managers invest a lot of their own money alongside your money. In this case, the managers have almost no investment in the fund but that’s not very important since their responsibilities are so limited.

Opening date

March 29, 1985

Minimum investment

$1,000. While Vanguard offers an automatic investing plan option, they don’t reduce the minimum for such accounts. That said, the STAR minimum is one-third of what Vanguard normally expects and the monthly minimum once you’ve opened an account is $1.

Expense ratio

0.34% on assets of $22.7 billion, as of July 2023.

Comments

Why invest in Vanguard STAR? There are three reasons to consider it.

First, the fund invests in a way that is broadly diversified and reasonably cautious. 60-70% of its money is invested in stocks, 20-30% in bonds and 10-20% in conservative short-term investments. Its stock portfolio mostly focuses on large, well-established companies and it gives you more exposure to the world beyond the U.S. than most of its peers do. International stocks constitute 21% of the portfolio but are only 13% for its average peer. That means investors are being given access to some additional sources of gain that most comparable funds skip.

Second, Vanguard is very good. There are two sorts of funds, those which simply buy all of the stocks or bonds in a particular index without trying to judge whether they’re good or bad (these are called “passive” funds) and those whose managers try to invest in only the best stocks or bonds (called “active” funds). Vanguard typically hires outside firms to manage their active funds and they do a very good job of finding and overseeing good managers. Vanguard and its funds operate with far lower expenses than its peers, on average, 0.19% per year for funds investing primarily in U.S. stocks. Even Vanguard’s most expensive funds charge less than half as much as their industry peers. Every dollar not spent on running the fund is a dollar that remains in your account.

Third, STAR is the most accessible way to build a Vanguard portfolio. STAR builds its portfolio around 11 actively-managed Vanguard funds.  They are:

  Which invests primarily in …
Windsor II Large U.S. companies whose stock is temporarily out of favor
Windsor The same sorts of stocks as Windsor II, but somewhat more aggressively
U.S. Growth well-known blue-chip stocks
Morgan Growth large- and mid-sized U.S. companies
PRIMECAP large- and mid-sized fast growing U.S. companies
International Growth non-U.S. companies with high growth potential
International Value non-U.S. companies from developed and emerging markets around the world that are temporarily undervalued
Explorer small U.S. companies with growth potential
Long-Term Investment-Grade medium-and high-quality investment-grade corporate bonds
GNMA GNMA is a government-owned corporation that backs mortgage loans made by the Veterans Administration and Federal Housing Authority; this fund invests in government mortgage-backed securities issued by GNMA.
Short-Term Investment-Grade Bond high- and medium-quality, investment-grade bonds with short-term maturities.

If you wanted to buy that same collection of funds one-by-one, you’d need to have $33,000 to invest. Dan Wiener, publisher of the well-respected Independent Advisor for Vanguard Investors newsletter, suggests eight funds in a model portfolio akin to STAR. That would require $24,000 upfront and you’d have to deal with the fact that PRIMECAP is no longer accepting new investors.

Bottom Line

STAR has been around for 30 years and has been a quiet, reliable performer. Its portfolio represents a cautious approach to some investment types (for example, stocks in the emerging markets) that its peers mostly avoid. Coupled with its substantial cost advantage over its peers, STAR has been able to outperform three-quarters of its peers. It has returned about 7% per year over the past decade, about 1% per year above the competition, but has been a little less risky. It’s a great all-around fund designed to do well year after year rather than post eye-popping returns over the short term.

Fund website

Vanguard STAR profile. You can keep track of your account by downloading the Vanguard app which works with iPhones, Android and Kindle. When you go to Vanguard’s “invest with us” page, here’s what you’ll see:

vanguard account

So you’ll need just seven pieces of information (eight if you include “your name”) to get started. When you’re asked what you’d like done with your dividends and capital gains, choose “reinvest them” so that the money stays in your account and keeps growing. Otherwise you’ll get them deducted from your account and mailed to you as a check.

© Mutual Fund Observer, 2015. All rights reserved. The information here reflects publicly available information current at the time of publication. For reprint/e-rights contact us.

TIAA-CREF Lifestyle Conservative (TSCLX), August 2015

By David Snowball

Objective and strategy

The fund seeks long-term total return, consisting of both current income and capital appreciation. It is a “fund of funds” that invests in the low-cost Institutional Class shares of other TIAA-CREF funds. It is designed for investors targeting a conservative risk-return profile. In general, 40% of the fund’s assets are invested in stocks and 60% in bonds. The managers can change those allocations by as much as 10% up or down depending upon current market conditions and outlook.

Adviser

TIAA-CREF. It stands for “Teachers Insurance and Annuity Association – College Retirement Equities Fund,” which tells you a lot about them. They were founded in 1918 to help secure the retirements of college teachers; their original backers were Andrew Carnegie and his Carnegie Foundation. Their mission eventually broadened to serving people who work in the academic, research, medical and cultural fields. More recently, their funds became available to the general public. TIAA-CREF manages almost $900 billion dollars for its five million investors. Because so much of their business is with highly-educated professionals concerned about their retirement, TIAA-CREF focuses on fundamentally sound strategies with little trendiness or flash and on keeping expenses as lower as possible. 70% of their investment products have earned four- or five-star ratings from Morningstar and the company is consistently rated as one of America’s best employers.

Manager

John Cunniff and Hans Erickson, who have managed the fund since its inception.

Management’s stake in the fund

We generally look for funds where the managers have placed a lot of their own money to work beside yours. Mssrs. Cunniff and Erickson each have $500,001 – $1,000,000 invested in the fund, which qualifies as “a lot.”

Opening date

December 9, 2011. Many of the funds in which the managers invest are much older than that.

Minimum investment

$2,500. That is reduced to $100 if you sign up for an automatic investing plan.

Expense ratio

0.76% on $310 million in assets, as of July 2023. 

Comments

Lifestyle Conservative offers many of the same attractions as Vanguard STAR (VGSTX) but does so with a more conservative asset allocation. Here are three arguments on its behalf.

First, the fund invests in a way that is broadly diversified and pretty conservative. 40% of its money is invested in stocks, 40% in high-quality bonds and the last 20% in short-term bonds. That’s admirably cautious. They then take measured risks within their various investments (for example, their stock portfolio is more tilted toward international stocks and emerging markets stocks than are their peers) to help boost returns.

Second, TIAA-CREF is very good. There are two sorts of funds, those which simply buy all of the stocks or bonds in a particular index without trying to judge whether they’re good or bad (these are called “passive” funds) and those whose managers try to invest in only the best stocks or bonds (called “active” funds). TSCLX invests in a mix of the two with active funds receiving about 90% of the cash. CREF’s management teams tend to be pretty stable (the average tenure is close to nine years); most managers handle just one or two funds and most invest heavily (north of $100,000 per manager per fund) in their funds. CREF and its funds operate with far lower expenses than its peers, on average, 0.43% per year for funds investing primarily in U.S. stocks. Even their most expensive fund charges 40% less than their industry peers. Every dollar not spent on running the fund is a dollar that remains in your account.

Third, Lifestyle Conservative is a very easy way to build a very well-diversified portfolio.  Lifestyle Conservative builds its portfolio around 15 actively-managed and three passively-managed TIAA-CREF funds.  They are:

  Which invests in
Large-Cap Growth   large companies in new and emerging areas of the economy that appear poised for growth
Large-Cap Value   Large companies, mostly in the US, whose stock is undervalued based on an evaluation of their potential worth
Enhanced Large-Cap Growth Index   Quantitative models try to help it put extra money into the most attractive stocks in the US Large Cap Growth index; it tries to sort of “tilt” a traditional index
Enhanced Large-Cap Value Index   Quantitative models try to help it put extra money into the most attractive stocks in the US Large Cap Value index
Mid-Cap Growth   Medium-sized US companies with strong earnings growth
Mid-Cap Value   Temporarily undervalued mid-sized companies
Growth & Income   Large US companies which are paying healthy dividends or buying back their stock
Small-Cap Equity   smaller domestic companies across a wide range of sectors, growth rates and valuations
International Equity   Stocks of stable and growing non-US companies
International Opportunities   Stocks of foreign firms that might have great potential but a limited track record
Emerging Markets Equity   Stocks of firms located in emerging markets such as India and China
Enhanced International Equity Index Quantitative models try to help it put extra money into the most attractive stocks in the International Equity index
Global Natural Resources   Firms around the world involved in energy, metals, agriculture and other commodities
Bond   High quality US bonds
Bond Plus   70% investment grade bonds and 30% spicier fare, such as emerging markets bonds or high-yield debt
High-Yield   Mostly somewhat riskier, higher-yielding bonds for US and foreign corporations
Short-Term Bond   Short-term, investment grade US government and corporate bonds
Money Market   Ultra-safe, lower-returning CDs and such

Bottom Line

Lifestyle Conservative has been a fine performer since launch. It has returned 7.5% annually over the past three years. That’s about 2% per year better than average, which places it in the top 20% of all conservative hybrid funds. While it trails more venturesome funds such as Vanguard STAR in good markets, it holds up substantially better than they do in falling markets.  That combination led Morningstar to award it four stars, their second-highest rating.

Fund website

TIAA-CREF Lifestyle Conservative homepage there is also another website from which you can download the fact sheet which gives you updated information on what the fund has been investing in and how it’s doing. From there it’s easy to open a mutual fund account and set up your AIP.

If you’ve got an iPhone, you can manage your account with their TIAA-CREF Savings Simplifier app. If instead, you sport an Android device (all the cool kids do!), head over to the Play store and check out the TIAA-CREF app there. It doesn’t offer all the functionality of the iOS app, but it does come with much higher customer ratings.

© Mutual Fund Observer, 2015. All rights reserved. The information here reflects publicly available information current at the time of publication. For reprint/e-rights contact us.