


“Maybe the mind’s best trick of all was to lead its owner to a feeling of certainty about inherently uncertain things.”
Michael Lewis’ The Undoing Project
Took a while, but we’ve finally added rolling average analysis to the MFO Premium site.
The new Rolling Averages tool provides insight into how returns vary for selected rolling periods of interest. Each period overlaps the next, separated by one month, across the life of the fund. This insight is especially important when establishing expectations based on an investor’s risk tolerance and time-line, as it reveals best and worst performance history.
For example, the venerable Dodge & Cox Stock Fund (DODGX) has an outstanding long-term annualized return of more than 11%/yr from its inception more than 50 years ago through August 2017. But it’s incurred stretches of 3-year periods where the annualized return was a gut-wrenching -20%/yr (that’s per year!) and even 5-year periods where the annualized return was a discouraging -8%/yr. That said, the fund has never returned less than 1.2%/yr in any 10-year period. (For more insight on DODGX and rolling average analysis in general, see A Look Back at Dodge & Cox Stock Fund).
The rolling periods are 1, 3, 5, 10 and 20 years, as applicable, based on age of fund and selected display period.
For each rolling period, the table provides:
- cnt – short for “Count”, which is number of rolling periods evaluated for display period selected.
- min – short for “Minimum”, which is lowest annualized percent return (APR, %/yr) of all rolling periods evaluated.
- max – short for “Maximum”, which is highest APR of all rolling periods evaluated.
- avg – short for “Average”, which is average APR of all rolling periods evaluated.
- std – short for “Standard Deviation”, which is the typical variation in rolling average APR.
Display period defaults to Life (ie., performance since fund inception, or at least back to January 1960 … the limit of our Lipper database), but can also be selected for the past 20, 10, 5, or 3 years. The latter options are helpful when making direct fund-to-fund comparisons.
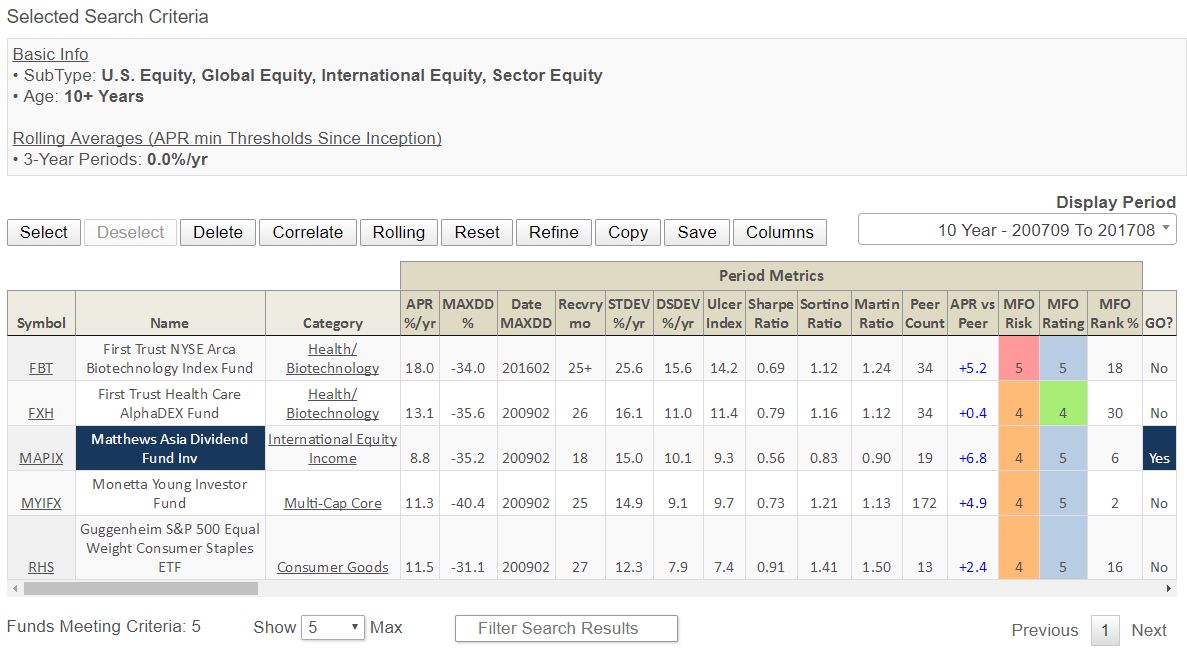
Using MultiSearch to screen for equity funds that are older than 10 years and never incurred a negative return over any 3 year period, only five of nearly 5,400 funds in our database pop-up: First Trust NYSE Arca Biotechnology Index Fund (FBT), First Trust Health Care AlphaDEX Fund (FXH), Matthews Asia Dividend Fund Inv (MAPIX), Monetta Young Investor Fund (MYIFX) and Guggenheim S&P 500 Equal Weight Consumer Staples ETF (RHS).
Here are their 10-year risk and return metrics (click table to enlarge):
Then, performing rolling analysis results in the following (click table to enlarge):
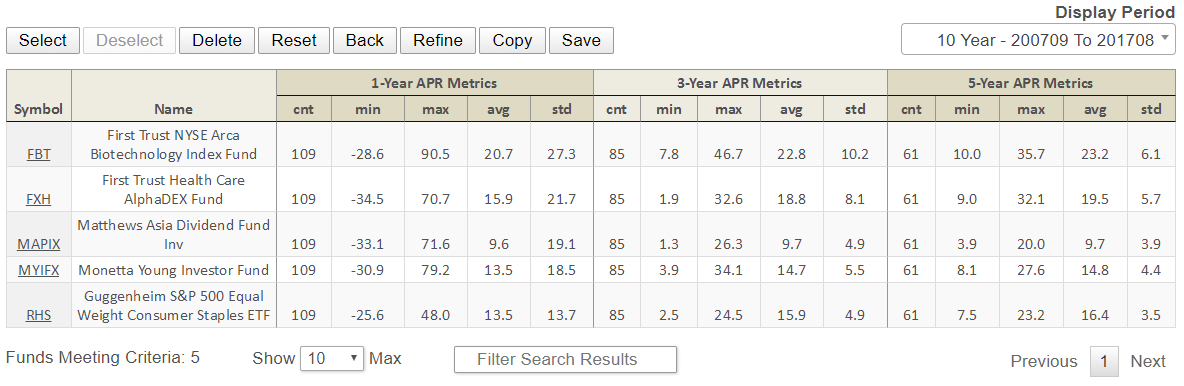
What does that tell us? Using RHS as the focus of our discussion:
- 1-Year APR Metrics: RHS has lost as much as 25.6% in a single year, and has also gained as much as 48%. It has averaged about 13.5% annually.
- 3-Year APR Metrics: If you look at all the three-year periods in RHS’s history (there are 85 such periods since we start 12 measurement periods annually, Jan 2014 – Jan 2017, Feb 2014 – Feb 2017 and so on), the worst three-year period in the fund’s history saw an annualized gain of 2.5% while the best saw 24.5%. Since ups and downs tend to cancel out over time, its standard deviation for three-year periods, at 4.9%, is much lower than its one-year deviation.
- 5-Year APR Metrics: Finally, it you were to have a five-year holding period, your worst experience would have been an annual gain of 7.5% while the best could have hoped for is 23.2%.
Do these calculations say that one of these funds is better for you than another? Definitely not, since they invest in very different universes and they all represent “best of class” offerings by this measure. If these were all, say, small-cap value funds of a similar vintage, you would get a far better sense of the consistency of a fund’s performance and of how to understand the experience you might have had with it in the last three years by comparing those three to all three year periods and even to the longer term.
Ideally, all fund performance should be presented in rolling analysis format, along with maximum drawdown, since that is only way can investors get a realistic assessment of how volatile a fund has returned historically.