Yearly Archives: 2019

May 1, 2019

By David Snowball

Dear friends,

HESCO barriers are really impressive.  They were conceived by James “Jimi” Heselden, a British entrepreneur and former coal miner. They are, at base, portable protective barriers; a box of heavy steel mesh that gets lined with a heavy plastic tarp and filled with sand. Start to finish, two guys and a front-loader can get one of these things built, positioned and filled in 20 minutes. The alternative, about 1500 sandbags, would take 10 guys far longer.  They’re strong enough that the military uses them as blast-proof fortifications and governments worldwide use them as protection against hurricanes. They can be strung together to form a continuous barrier a mile long.

They’re really impressive.

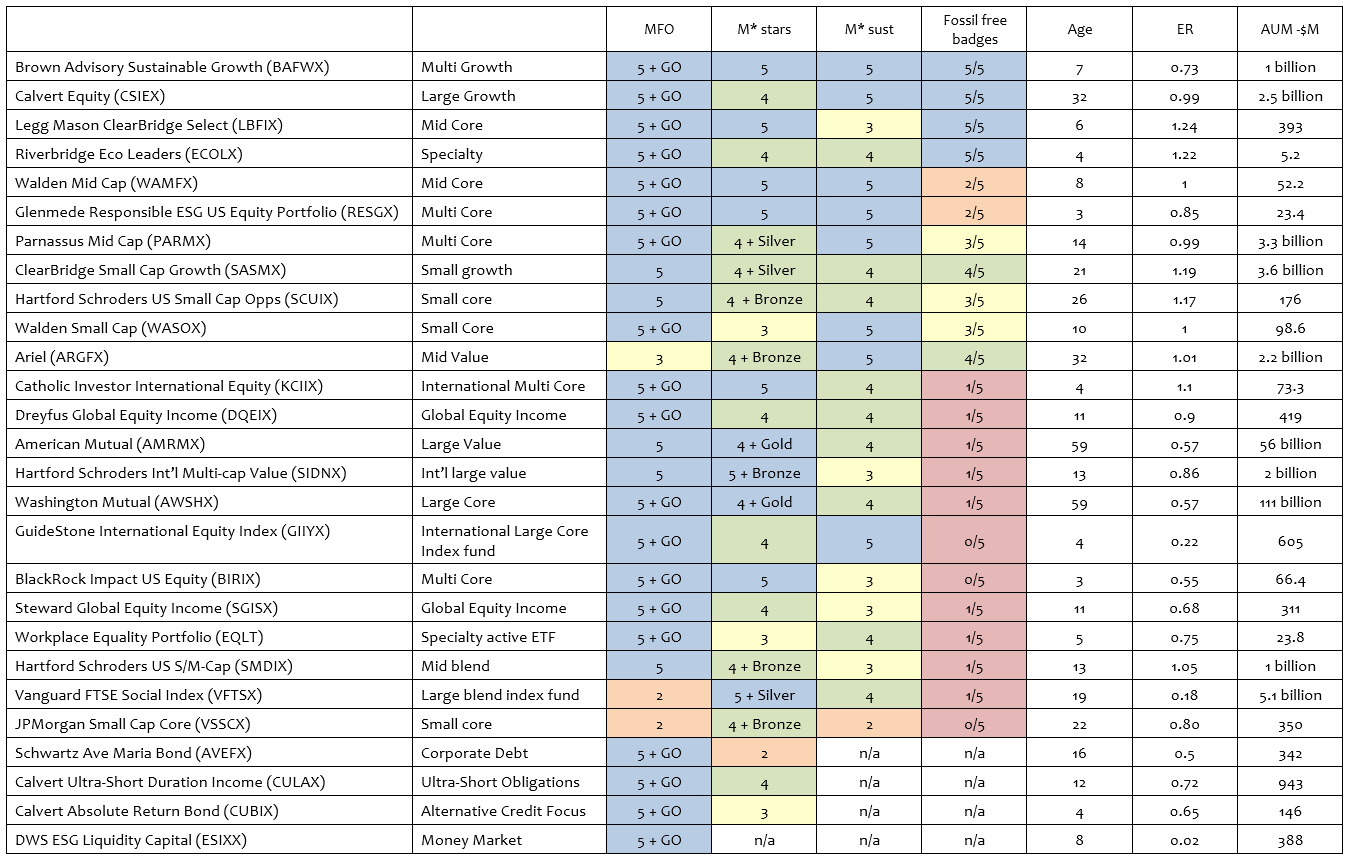
But the Mississippi, running at flood crest, is more impressive. My adopted hometown, Davenport, lies on the Mississippi River and has developed a two-zone strategy for dealing with flooding. The first zone, along the river, is designed to be flooded: trails, parkland, bandshells all disappear beneath the river, reappear, get hosed off and are as good as new. A few high-value structures on the river – our water treatment plant and baseball stadium, for example – have their own floodwalls and mostly live as islands in the river for a while.

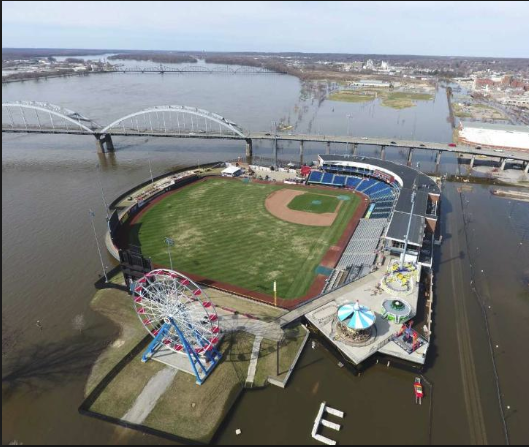
The second zone, just beyond River Drive, is designed to be kept safe behind long stretches of Hesco Barriers. The river had other plans. After 38 straight days at “major flood” level, first one, and then another, of the Hesco’s fail. The moment one failed, its neighbor was under double stress and it failed, too. The river, at bay for more than a month, consumed the blocks above River Drive in five minutes.

People flooded the area almost as quickly as water did: emergency workers, city officials, neighbors, concerned citizens, news crews and, of course, drone operators. The Marriott shared rooms with the displaced, the Salvation Army began collecting clothes and personal items for them, and we did what people do. We tried, mostly without attention, to make a difference.

On days when the headlines are particularly dispiriting, it might be good to remember the image of Iowans rushing toward the disaster, intent on helping. And better still to remember the Texans and the New Yorkers, the Floridians and the Bay Staters, the Pittsburghers and Californians, who all … in face of the forces of man and nature and in defiance of cynical stereotypes … did exactly the same.

It is important, if not good, to remember the other lesson of the flood: the effects of climate disruption are immediate. One inadvertent effect of the way scientists discuss global warming is that they make it seem distant: “three degrees Celsius by 2100 which will mean …” To those of us unlikely to be around in 2100 (though if I have a 134th birthday bash, you’re all invited), that seems safely distant. The reality of, for example, annual 100-year floods, reminds us that we, and our portfolios, will bear the cost long before then.

There is, admittedly, a boomerang effect, too; for the most skeptical, additional evidence of change leads to more fervent insistence on the opposite. And still, the floods come more and more.

Party like its 1999

A catchy Prince song, despite the odd closing line: “Mommy, why does everybody have a bomb?”

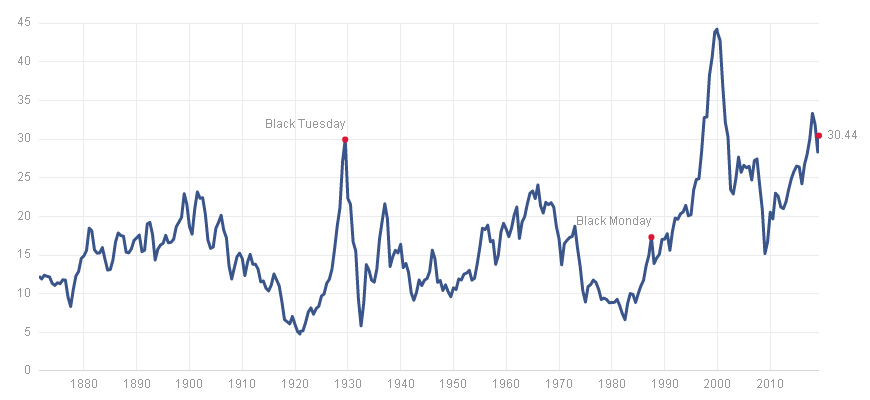
A number of pretty thoughtful people – that is, professionals rather than the masters of click-bait – have been worried that our current exuberance (had you noticed that the Total Stock Market Index has risen 18.5% in the first four months of the year? I hadn’t) offers some worrisome parallels to the last days of the Great Bull of the 1990s.

Doug Ramsey, the Chief Investment Officer of The Leuthold Group and one of their portfolio managers, is among them. Leuthold is a rigorously quantitative bunch, not given to investing with their guts. In April, Doug wrote:

As the market rebound has extended, we’ve noted its striking similarities with the rally of 1999—one that might have been the most speculative in U.S. history.

The market is up almost every day, and one can almost bank on a ramp higher during the last 15 minutes. “Corrections” are now events that last hours, not days or weeks.

Growth is beating Value; the Russell 1000 and Russell 2000 Growth indexes are both about five percentage points above their Value counterparts just three months into the year. More telling—and identical to 1999—is that investors can’t seem to envision an environment in which Value managers could ever win. In 1999, the distinction was between New Economy and Old Economy stocks. Today, it’s between companies not tethered to the sluggish economic growth rate (Growth, and Tech in particular) and those that are (Value).

U.S. stocks have outperformed foreign stocks off the December market lows. Some of the gap reflects the strong U.S. dollar—another salient feature of the 1999 melt-up. What’s more—and also identical to 1999—is that investors can’t seem to imagine a scenario in which foreign stocks could ever return to the fore. Demographics here are better than in most of the rest of the world, the U.S. remains the preeminent global innovator, and so forth.

A really bold bull might contend this environment is better than 1999 because the underlying sentiment is more sober. Sentiment is more restrained, but attitudes and actions aren’t the same thing. In the late 1990s, investors chased Growth stocks in spite of the healthy yields offered by cash and bonds. In this cycle, an absence of yield forced them into Growth stocks.

In the late 1990s, it was the carrot. In this cycle, it’s been the stick. Different paths, but each has led to similarly precarious portfolio bets. Is it reasonable to expect a different outcome?

Good question.

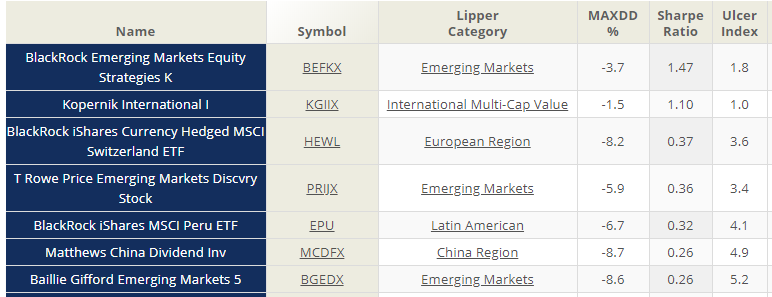
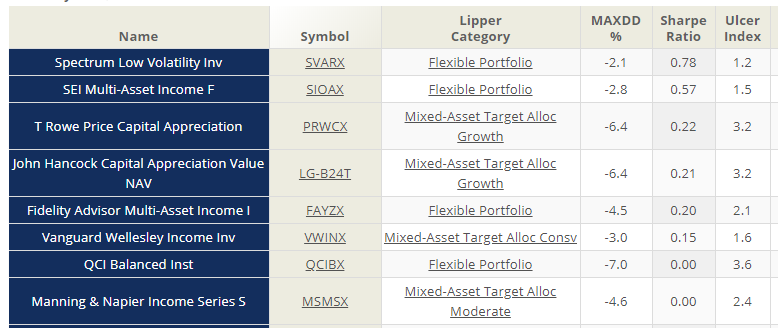
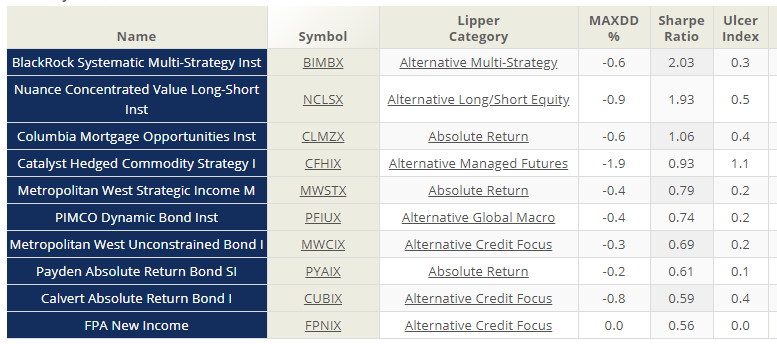
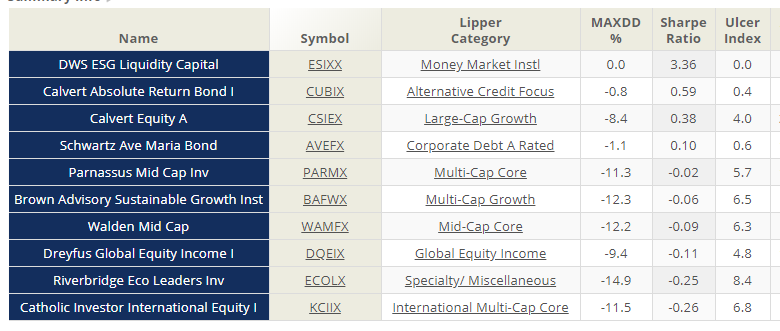
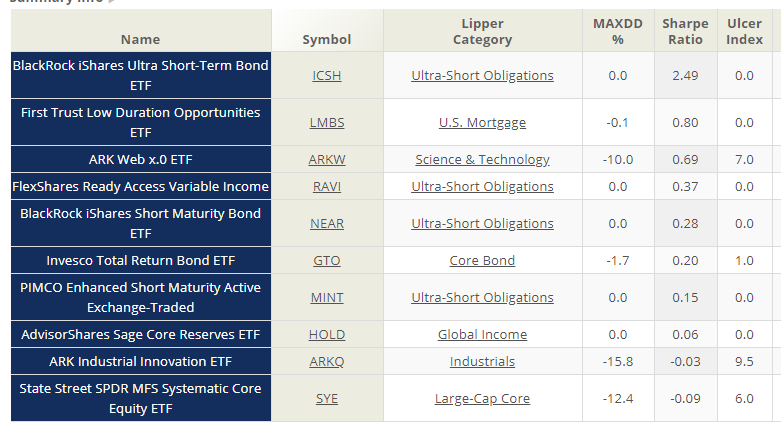
MFO will continue, as we do this month, to profile managers who take risk seriously and who have a record for managing turbulent times. If you’ve got folks you think we should be looking at, feel free to drop me a note.

Farewell to Money

The magazine, not the bits of paper.

Meredith Corporation, the Des Moines-based media company that owns a huge number of familiar magazine titles (Time, Sports Illustrated, Magnolia Journal, Parents, Food & Wine …) has announced that it will stop publishing the print edition of Money magazine after the June/July issue.

Money joins a host of other magazines, some with truly exceptional content, in the publisher’s graveyard: Worth, Smart Money, Family Money, Individual Investor, Dollar Sense, and even Mutual Funds Magazine. While some fine professional publications remain, as do some that focus broader on finance and economics, it appears that Kiplinger’s Personal Finance stands alone now as a vehicle for individual personal finance journalism.

Print publications, which depending on your willingness to pay actual money which might cover the cost of hiring trained professionals, have been driven toward extinction by our assumption that we should be getting anything we want, and everything we need, for free. That assumption is fed by the proliferation of apparently free advice on the internet.

Chuck Jaffe took on the illusion that you are getting something for nothing:

The blogosphere has become a hotbed for personal-finance counsel, where much of the content is good or, at worst, mostly harmless.

But as this environment becomes more popular and successful, some of the folks behind the sites are putting their potential to profit ahead of honesty and objectivity.

There are plenty of cases where the people running popular websites are endorsing services they have never tried — or who are featuring specific companies and partners — based entirely on affiliate programs. (Affiliate programs, essentially, are commission-driven incentives where the media company highlights a product or service and gets a kickback when its audience follows through and becomes a real lead or an actual sale.)

The democratization of personal-finance journalism demands that consumers scrutinize news sources — and the motives of those sources — with the same detail they apply to the advice itself. (When Money runs out: Magazine’s demise puts consumers on alert, April 27, 2019)

I can attest to two related facts: (1) MFO is approached weekly by people who want to plant content – from “free” articles to paid placements for links – here and (2) we have rejected all of them. MFO is a public service backed by a non-profit corporation; the only compensation we receive comes from contributions from our readers. (A long time ago we participated in the Amazon Associates program, but that had no relation to content and died years ago.) The only group to whom we are beholden is you.

And so, here’s my rare reminder: we need you to contribute if you’d like MFO to continue. We have about 25,000 readers and about 250 contributors (some of whom are quite generous and all of whom are deeply appreciated). We dream of the day when a tenth of our readers offer financial support. Our more immediate, more modest goal was to work our way up to 2% of readers.

If you’d like to contribute, there are basically three options:

  1. Make a one-time contribution by check or Paypal. And no, you do not need a Paypal account to make a contribution through them. We use Paypal because they can afford to invest in the layer upon layer of cybersecurity necessary to make such transactions safe.

    Check writers can use our Davenport address: MFO, 5456 Marquette St., Davenport, IA 52806. (We are high above the floods, so you needn’t worry so much about waterproof ink.)

  2. Become a Sustaining Member by setting up an automatic monthly contribution through PayPal. $50 might feel like a lot, but $10/month might feel safe and manageable. Like an automatic investing plan set up with a mutual fund, an automatic contribution makes life simple and helps us do what we want to do but never get around to. A monthly contribution might be $1 or it might be $50; regardless, it will be welcome and useful. To do that, just click on the same “donate” link, then choose “Make this a monthly donation” and set an amount.

    And you still don’t need a PayPal account to do it.

    Thanks, now as ever, to the Super Six: William, David, Brian, Doug, Deborah, and Greg who’ve all chosen to become Sustaining Members. We salute you all!

  3. Become an MFO Premium member. For folks contributing $100 or more in a year, we offer – by way of thank you – access to MFO Premium. MFO Premium is the home to all of our fund data and screeners. Virtually any calculation or table you see in any MFO article is derived from the tools at MFO Premium. We launched MFO Premium in 2015 as a way to give investors access to an expanded suite of tools and screeners and also as a tool for supporting MFO’s free content. Our fund screener, which also covers ETFs, allows you to access risk and risk/return measures that aren’t available anywhere else, to access those measures over meaningful periods (such as Full Market Cycles) and to measure the correlations between your funds over those same sorts of periods. MFO Premium is also distinctive because it’s the industry’s most responsive site; if you can make a sensible argument for why we need to do something differently, better or new, we’ll actually try to do it for you. 

And yes, it’s all still (largely) tax deductible.

Much excitement in the weeks ahead. Charles and I will be attending the Morningstar Investment Conference in the second week of May, though I’ll only be around on the conference’s first day. Chip and I will be heading out to Ireland on June 1st for an 11-day holiday. She’s a meticulous (some say obsessive) planner; I suspect she already knows what I’ll be having to drink with dinner on 7 June. She solicited recommendations from MFO readers about must-do activities and sights in the west of Ireland and received wonderfully thoughtful, detailed and (occasionally) quirky recommendations that are now built into our itinerary. Thanks for those reflections go to Roger, Ronald, and Larry. We’ll share pictures!

Finally, we celebrate our eighth anniversary with the publication of this issue. The average life of an independent publication (blog, website or otherwise) on the web is rather less than eight weeks; finishing eight years is a remarkable accomplishment, and one that your readership made possible.

And so, thanks!

david's signature

The Investors Guide to the End of the World, Part 2: Concrete advice

By David Snowball

Much has been written about the threat of climate destabilization and investors are more and more aware that there are distinct challenges between posed to their own portfolios. Whether it’s rising sea levels, intolerable summer temperatures, frequent extreme weather (droughts, super-sized hurricanes, flooding, blizzards) or assertive government regulators, it is clear that these things are going to impact our portfolios.

But how? What, other than moving to Minnesota (or investing in Mairs & Power, which is located in Minnesota and is famous for investing in Minnesotans), should we do?

In March, our Investor’s Guide to the End of the World tried to offer a clear, non-polemical guide to the most authoritative evidence we could find. We concluded that you had three fundamental portfolio strategies: divest (buy fossil-free funds), invest (in ESG-screened funds) or innovate (by investing in funds that target highly resilient, adaptive firms). In April, we offered specific recommendations and a profile of the fund I’ve added to my own portfolio, Brown Advisory Sustainable Growth.

In the past month, three major financial players have issued specific advice for climate-aware investors. Here’s a quick snapshot of their reports.

GMO, Thinking Outside the Box: How and Why to Invest in a Climate Change Strategy (April 2019). GMO argues that some fairly conventional investments, value stocks as an example, have useful buffering tendencies so that not all climate-aware investing comes down to “buy solar” or some such. Their key points:

  • We believe the secular growth tailwinds in the climate change sector will provide investors with strong investment opportunities for decades to come.
  • In our opinion, a well-designed climate change strategy can provide investors with a variety of benefits, including diversification, protection from climate risk, inflation protection, and the ability to invest in growth-oriented companies at a discount.
  • For those considering fossil fuel divestment, clean energy solutions provide indirect exposure to fossil fuel prices.
  • A climate change strategy can play an important role in a global equity program, real asset program, ESG portfolio, or as climate risk insurance.

BlackRock, Getting Physical: Scenario Analysis for Assessing Climate-Related Risks (April 2019). BlackRock, which manages $6 trillion in assets, focuses on the immediate risks to three different, popular asset classes and makes recommendations for how to assess the risks in your portfolio. Their key findings:

  • We show how physical climate risks vary greatly by region, drawing on the latest granular climate modeling and big data techniques.
  • Extreme weather events pose growing risks for the creditworthiness of state and local issuers in the $3.8 trillion U.S. municipal bond market. We translate physical climate changes into implications for local GDP — and show a rising share of muni bond issuance over time will likely come from regions facing economic losses from climate change and events linked to it.
  • Hurricane-force winds and flooding are key risks to commercial real estate. Our analysis of recent hurricanes hitting Houston and Miami finds that roughly 80% of commercial properties tied to affected CMBS loans lay outside official flood zones — meaning they may lack insurance coverage. This makes it critical to analyze climate-related risks on a local level.
  • Aging infrastructure leaves the U.S. electric utility sector exposed to climate shocks such as hurricanes and wildfires. We assess the exposure to climate risk of 269 publicly listed U.S. utilities based on the physical location of their plants, property and equipment. Conclusion: The risks are underpriced.

Morningstar, Morningstar Sustainability Atlas (April 2019). Morningstar has a substantial amount of new research on sustainable investments and investors. This particular report identifies the regions where international investors are likely to find the greatest prospect for good corporate governance and practices. Their key takeways:

  • Northern Europe leads the way when it comes to corporate-level sustainability. Denmark scores highest on social criteria, the Netherlands on governance. Portugal has the best Environmental Score.
  • Colombia is the world’s highest-scoring non-European market for sustainability because of companies like Bancolombia, Ecopetrol, and Cementos Argos (a global ESG leader in its industry). However, the Colombian market also shows great risk from the transition to a low-carbon economy.
  • China finds itself at the bottom of the rankings across the three ESG criteria. The main issue here is poor corporate governance, with companies like Alibaba and Tencent underperforming their peers.
  • Switzerland scores very well on ESG criteria (ranking third out of 46), but the number of controversies involving key companies such as Novartis and Nestlé lower its overall Sustainability Score.
  • The United States, for its part, ranks in the fourth quintile of global sustainability leaders because of a significant level of controversy from big index constituents like Amazon, Apple, and Microsoft, and poor Governance Scores from companies like Facebook and Alphabet. On the other hand, the U.S. is the only non-European country to rank in the best quintile for carbon risk.
  • Brazil, an upper middle-quintile performer on ESG criteria, ultimately placed in the bottom half for overall Sustainability Score, owing to controversies from some of the country’s largest companies, like Vale S.A. and Petróleo Brasileiro.
  • Asian markets Japan and Korea score poorly on corporate governance. SoftBank Group, Toyota, and Samsung underperform from this point of view.

The link above takes you to a “fill out this form for a free download” page. If you’re loath to sign up, Morningstar’s blog shares at least a little more detail without commitment.

Asymmetric Investing

By Edward A. Studzinski

“If more than ten percent of the population likes a painting it should be burned, for it must be bad.” George Bernard Shaw

Where are we with one third of the year gone? Many domestic and international funds are showing year-to-date positive total return performance ranging from the low teens to just into the twenty percent range. The more instructive number is the total return performance looking back over one year. There many funds are still showing negative numbers, not having earned back the losses suffered in last year’s market debacles.

1442 mutual funds have trailing 12-month returns of zero or below, as of 4/30/2019.

Twelve funds, mostly in energy-related fields, have lost between 25-50% of their investors’ money over the past 12 months.

82 funds remain miraculously alive despite losing money over the entire past decade.

I must confess to feeling a good bit of schizophrenia currently. If you look back over the last twenty years of investing, from 12/31/1999 to 3/31/2019, the Vanguard S&P 500 ETF has returned annualized slightly more than 5.5%, with volatility in excess of 14.5%. While the numbers look slightly better through 4/30/2019, they are not barn-burners. Horizon Kinetics, an investment firm that is one of the better groups of asymmetric investment thinkers, posits an interesting question in their Q1/2019 Market Commentary piece. Specifically, if you knew then what you know how, would you have committed to that ETF investment? They point out that at year-end 1999 you could have purchased a twenty-year U.S. Treasury that would have produced a 6.8% yield to maturity. Or alternatively, you could have purchased a high quality closed-end municipal bond fund, exempt from Federal taxes, at a 7.3% distribution yield.

But that was then, and we are where we are now, which presents us with a very different picture. Through yesterday’s close, the metrics on Vanguard’s S&P 500 Index Fund (Admiral Class) show a trailing p/e of 19.9X, trading at 3.2X book value, and have a 1.98% SEC yield. Those are historically lofty valuations. If one is looking to retire in the next five years, do you want to assume that those valuation levels will remain intact? The argument for staying the course in equities is that the alternatives at present, although more attractive than in the recent past, are starting to back off from levels that one could find acceptable. Two-year certificate of deposit yields have dropped from 3% to the 2.8% area, intermediate U.S. Treasury yields are in the 2.3% range, and money market funds are also in the 2.3% range (as we hover around the possibility of an inverted yield curve).

Alternatively, one can construct a portfolio of dividend paying stocks that will throw off dividend income close to 4% and have some potential of increasing both the dividend income and intrinsic value per share over the next five years. It all comes down to time horizon, and not so much your tolerance for risk as it does your tolerance for not confusing the intrinsic value of a security with its market price. Those may most likely be two very different things.

Which brings us to the question of asymmetric investing. Much of what we see in funds today involves portfolios that frankly, look alike. The ten largest positions in the Vanguard 500 Index (VFIAX) are: Microsoft, Apple, Amazon, Alphabet, Facebook, Berkshire Hathaway, Johnson & Johnson, Exxon Mobil, JP Morgan Chase, and Visa, Inc., for which Vanguard charges 4 basis points as a management fee. Go to the effort, dear investor, of looking at your various funds and their reports to see what the top ten positions are in those. For instance, in the Vanguard Growth & Income Fund (VGIAX), which charges 23 basis points and is an actively-managed fund with three sub-managers, the top ten largest positions are: Microsoft, Apple, Alphabet, Amazon, Facebook, Johnson & Johnson, JP Morgan Chase, Merck, Home Depot, and Visa. Making this effort will give you some sense as to whether you are paying higher fees than you need to for what is in effect a closet index fund.

10-year correlation of VGIAX to VFIAX: 100

Alternatively, making this effort will allow you to identify those firms that are still trying to distinguish themselves from an index. For example, a review of the top ten holdings of the Dodge & Cox Stock Fund (DODGX) will show a very different listing and emphasis from what you see above.

And then of course, we still have Mr. Buffett. He was asked in a recent interview with the Financial Times of London (last weekend) how he expected the returns to differ going forward for Berkshire Hathaway, his investment holding company, with an investment in the Vanguard S&P 500 Index Fund, which he has suggested would be appropriate for most people. His answer was that he expected both to perform pretty much in line with each other. One suspects that represents a certain amount of false modesty on Buffett’s part. While Berkshire, from a market return perspective, has underperformed in recent years, the composition of its investments and operating businesses makes it the very example of an asymmetric investment now. And if its returns should end up approximating the S&P 500, how it gets there should be very different.

I am going to conclude by saying – look for funds or investments that are uncorrelated (not sitting on top of) to an index. Often there will be other similarities – firms with a relatively small amount of assets under management, firms with a nimble investment selection process, firms that are doing their own legwork rather than depending on either Wall Street research or what other investment firms are doing. Recognize that what the indices and recent bull market returns have told us is that things are pretty much priced in a such a fashion that perfection must occur going forward for these recent returns to be sustained.

“Valar Morghulis”

I heard the other day that Wintergreen Fund (WGRNX), under David Winters, is liquidating. To date I have not heard a definitive explanation. But a good guess would be lagging performance, asset redemptions, coupled with the illiquidity of the investment in Consolidated Tomoka, a Florida-based real estate company, which apparently ended up representing more than 42% of the fund’s assets at year-end 2018. Those of us in the Chicago investment community have long been familiar with Consolidated Tomoka, as it was a holding of a Chicago closed-end investment fund, Baker Fentress, that liquidated some years ago. The shareholder-owners of Consolidated appear to have been happy over the years with how it was managed. They were and are apparently resistant to change for the sake of change. The other noteworthy issue for Wintergreen was a well-publicized disagreement where David Winters raised some governance issues regarding Coca-Cola and one of its major shareholders, Warren Buffett. Here one saw a violation of the well-known dictum, “Don’t sword fight with Zorro.” It will be interesting as more comes out about this shuttering to see whether it becomes a learning event. Winters of course had his start as a manager of Mutual Discovery at the Mutual Shares group, under Michael Price. Winters was quite successful at managing what started as a small cap global value fund.

“Valar Dohaeris”

Living a Rewarding Retirement – Put Some Things on Auto-Pilot

By Robert Cochran

Readers of my previous blog posts know that since I retired more than 18 months ago, I don’t spend much time looking at the values of my investments. There are four main reasons for this. First, I spent more than 30 years watching the markets and client portfolio values on a daily basis. I was more than ready to pass that off to my former investment partners, and I don’t miss it one bit.

Second, I am blessed to not rely on my portfolio for current income, at least at the present time. I have therefore created an allocation with which I am comfortable, and put it on auto-pilot. If I need answers to questions, I know I can call my former partners for their input.

Third, I am surprisingly busy, and spending time looking at our account values is about the last thing I want to do. Numerous volunteer work, classical music practicing and concerts, our national display garden, and a great year for the Columbus Blue Jackets have filled my calendar nicely. My father in-law recently passed away, and my wife and I have spent many hours tending to those things that must be done at the passing of a second parent. We are both very grateful to have made the decision to move him from independent living to assisted living when we did. And we were blessed to be working with a continuing care retirement community, where he could transition from those two stages to wonderful hospice care with little effort on our part, except for the emotional drain that is inevitable. It goes without saying that we are grateful for our wise attorney, who also worked with my father in-law to make sure his goals were met. I hope all retirees have their important legal documents completed, up-to-date, and ready to go. This includes financial and health-care powers of attorney, living wills (if desired), and wills and trusts as needed. If something happened to you today, will your wishes be carried out as you want?

Fourth, and finally, I have absolutely no control over what happens with the investment markets. After decades of trying to stay on top of economic trends, political mayhem, world problems, and other all-consuming craziness, it’s wonderful to step aside. None of us can control anything except the amount of risk we are willing to assume and the investment expenses we are willing to accept.

There is a former colleague who spends a lot of his time reading lots of economic forecasts, sifting through them, and creating “what if” scenarios for those he thinks have the most probability of occurring. I asked him less than a year ago what his take on those forecasts was and what he would do as a result. Unfortunately for him, the overwhelming majority of economic projections called for a recession late in 2018, probably in 2019, and no later than 2020. As a result, he and his team of advisors gradually reduced domestic and overseas stock allocations from 60-65% to 45-50%. They added a 20% allocation to long-term bonds (long-term municipals bonds for high-tax clients), with the expectation that interest rates would fall with the recession, and they liquidated positions in real estate, small cap stocks, and all international stocks. I have yet to ask (and will not) how that worked out for him.

Headlines indicate our economy continues to hum along quite well, at better than a 3% year-over-year growth rate, with very strong employment numbers and still-low inflation. This is despite all the political upheaval in Washington and around the world, and as noted above, most economists predicting a near-term recession. I am reminded of an on-line advertisement touting a well-known economist who “predicted the great recession”, and promising to reveal all of his secrets for no more than the outrageous cost of a monthly newsletter. What the ad did not mention was that this economist is one of many who have been wrong a lot more than they have been right.

Recently I had a health issue that landed me in the hospital emergency room, my first visit there since I tripped on a garden hose and fell face-first onto a concrete patio (who knew gardening was so dangerous?). I am grateful for the excellent care I received, medication to regain my good health, and for the help of a health insurance consultant we hired prior to retirement. She has done a great job for us, finding the best overall plans each year and providing claim assistance as needed. This is one more aspect of retirement I am glad to pass on to a competent service provider.

stay busy, stay healthy, avoid scary headlines and spend time doing things that bring you and others joy.

My advice to other retirees is to stay busy, stay healthy, avoid falling prey to scary news headlines, and spend time doing those things that bring you and others joy and fulfillment. Put your financial life on auto-pilot to the extent possible, and be grateful for the good things each of us has. Not everyone has a life that is easy, but those of us who are able can spend some time trying to make life easier for those who aren’t as fortunate. That, dear readers, is one more aspect of a rewarding retirement.

New MFO Search Tools Publicly Available

By Charles Boccadoro

We’ve supplanted our “Miraculous MultiSearch” and Risk Profile search tools with QuickSearch, which is now available on the MFO Premium site. It offers more features and is updated monthly. We’ve also consolidated our Great Owl, Three Alarm, and Dashboard (of Profiled Funds) tools to the MFO Premium site, similar info as before but more user-friendly and also updated monthly. All these tools remain available to public and trace back, in fact, to our legacy Fund Alarm site.

To help walk users through these tools, as well as to provide an update on our premium site’s latest features, we’ve scheduled a webinar for Wednesday, May 15th. Once again, two sessions are planned, one hour each nominally, at 2pm and 5pm eastern … 11am and 2 pm pacific. Like last time, we will employ easy-to-use the Zoom web conferencing tool. Please register here for the first session,  or here for the second session.

Here is the new search page, which includes the ability to screen for Great Owl, Three Alarm, Honor Roll and MFO Profiled funds …

Below are the 3-year risk and return metrics of the top 10 screened funds (excluding specialized sector categories), sorted by Annualized Percent Return (APR). It includes funds like Akre Focus Retail (AKREX) and T Rowe Price New Horizons (PRNHX), which have handsomely rewarded its investors.

MFO Premium’s main tool, also called “MultiSearch,” remains available to subscribers and contributors of MFO. It features stored WatchLists and Pre-Set Screens and enables searches based on up to 80 criteria, across 38 evaluations periods, for all U.S. Mutual Funds, ETFs, CEFs, and Insurance Funds, including all share classes. It maintains a suite of supporting fund analytics, including Correlation, Rolling Averages, Ferguson Metrics, Calendar Year Returns, Batting Averages, Fund Compare and Trend. For a complete picture of all the metrics and screening features available, please visit the ScreenShots and Resources sections on MFO Premium Welcome page.

Here is the (unexpanded) fund screening panel of MFO’s MultiSearch tool …

Invenomic Fund (formerly Balter Invenomic), (BIVRX/BIVIX/BIVSX), May 2019

By David Snowball

At the time of publication, this fund was named Balter Invenomic.

Objective and strategy

Balter Invenomic Fund is seeking long term capital appreciation. They pursue that through a widely diversified long-short portfolio comprised, primarily, of domestic stocks. The long and short portfolios each held about 150 positions, as of early 2019. The long portfolio is always fully invested in undervalued, timely stocks while the size of the short portfolio varies based on the opportunities available. The long portfolio is all-cap and might include equity securities other than just common stocks. The fund’s short portfolio is broadly diversified and targets stocks which are both overvalued and are likely to fall. The short portfolio is not designed merely as a defensive buffer; it is designed to deliver positive returns and reduce the overall risk of the portfolio through individual security selection.

Net equity exposure (percentage long minus percentage short) averaged 30% over the past three years. Among the tools available for hedging its equity exposure are investments in high-yield bonds and options.

Adviser

Balter Liquid Alternatives, LLC. Balter, which is headquartered in Boston, was founded in 2006 and oversees approximately $1.3 billion in total assets, including approximately $300 million in alternative mutual funds. They serve family offices, ultra-high net worth individuals and institutional investors. Balter Liquid Alternatives partners with established hedge fund managers to provide hedge fund strategies in a mutual fund form.

The fund is sub-advised by Invenomic Capital Management, LP. Invenomic was founded in 2015 to provide investment management services to institutional clients and high net worth individuals worldwide. The firm has three investment professionals and about $160 million in assets, of which about 10% are from non-US investors.

Manager

Ali Motamed. Before launching Invenomic Capital, Mr. Motamed was a Senior Analyst and a Portfolio Manager with Robeco Investment Management (2003-15) where he co-managed Boston Partners Long/Short Equity Fund (BPLEX) and a related strategy. He was awarded Portfolio Manager of the Year in the Alternatives Category by Morningstar in 2014.

Mr. Motamed is assisted on the business side by Bob Marx and on the investment side by two analysts, Paul Goncalves Jr. and Nate Victor. Mr. Motamed was looking for bright and ambitious younger colleagues and screened, in particular, for analysts who had voluntarily pursued the rigorous, multi-year process of becoming a CFA charterholder. He found that in Mr. Goncalves, who has experience analyzing cyclical businesses, and Mr. Victor whose specialty is in tech. They expect to add a third analyst, with particular strengths in computer sciences, in June 2019.

Strategy capacity and closure

The strategy capacity is about $3 billion, but only $1.8 billion of that is allocated to the mutual fund. The remainder is reserved for other institutional and international investors; Mr. Motamed reports a potential allocation of $600 million to a large European UCIT provider. The strategy currently holds $160 million.

Management’s stake in the fund

Mr. Motamed has invested more than $1 million in his fund. His Balter confreres each have reasonably large investments in the fund, though none of the fund’s trustees have any investment in any of the Balter funds.

Opening date

June 19, 2017

Minimum investment

$5,000 (BIVRX), $50,000 (BIVIX) and $50 million (BIVSX). The Super Institutional BIVSX share class will probably be capped at three or four investors, one of whom has already approached the advisor.

Expense ratio

2.98% for Investor class, on assets of $141 million. Institutional shares charge 2.73% and Super Institutional shares cost 2.48%. For the Institutional share class the funds expenses are capped at 2.23% and 1.99% for the Super Institutional share class.

Comments

Things are going well for the folks at Balter Invenomic.

Ali Motamed manages Balter Invenomic Fund (BIVIX), which launched in June 2017, but he’s been playing this game for far longer. Mr. Motamed was Co-Portfolio Manager of the Boston Partners Long/Short Equity Fund (BPLEX/BPLSX). In that role, Mr. Motamed was awarded Portfolio Manager of the Year in the Alternatives Category by Morningstar in 2014. Like many fund entrepreneurs, he chafed under the constraints of working within a large, bureaucratic organization. In October 2015, he left Boston Partners and founded Invenomic Capital Management with the intention to advise individuals, advisory firms, family offices, endowments, foundations, trusts, charitable organizations, and pension plans in an investment capacity.

What does “invenomic” mean? Good question. It’s a term invented by Mr. Motamed to try to capture his investing philosophy. The INVE represents investing. The NOMIC part means “having the general force of natural law”. It’s the suffix in economic and socionomic. He named the firm Invenomic because he views the firm’s investment strategy as a technologically enabled version of the original hedge fund structures that were based on fundamental analysis.

Mr. Motamed believes strongly that fundamental analysis is the most time-tested method of investing. However, as human beings, we are not as efficient as computers and have the prospect of falling into behavioral traps, perhaps repeatedly. The solution is a quantitative system that creates structural safeguards against human frailty. By way of example, many professional investors revel in all of the contact they have with management teams. Mr. Motamed and his team, contrarily, stay as far from management teams as possible:

Generally speaking, companies whose stock we short are led by excellent communicators with charm and charisma. Their job is to create value for their shareholders, and having an overvalued stock should be a badge of honor. Very rarely do the leaders of these companies end up going to jail. What they do, however, is selectively disclose information that positions their company in a favorable light.

Invenomic’s solution is to maintain rigorous four page statistical profiles about each firm in its universe, where each of the data points illustrates something about a firm’s prospects that is more revealing than their management team’s sweet words. The goal is to use a rich array of data because there are, Mr. Motamed argues, “many paths to ‘value.’ There are companies that on their own intrinsic basis can justify a higher valuations; too many investors fret about p/e which is an invariant metric. We take a slightly broad definition with a tight process to evaluate 4,000 companies, which allows us to be value oriented without being doctrinaire, especially in the context of our short portfolio.”

The key differentiator, from his perspective, is a successful short book. Mr. Motamed argues that most long/short managers fail on the short side. They maintain too few shorts, they put too much money into each, they maintain a large short book when market conditions don’t warrant it and they view themselves as on a crusade against the management teams. Each of those mistakes limits the power of the short portfolio to generate alpha rather than just limiting beta; that is, Mr. Motamed thinks a good short portfolio should make money rather than just hedge volatility. They target “story stocks,” firms with deteriorating fundamentals and firms artificially buoyed by one-time windfalls that investors are treating as structural advantages. The goal is not to find the most overpriced stocks; the goal is to find stocks that are both overpriced and poised to fall. He reports that there are more money-losing stocks in the Russell 3000 index than at any time in history, which offers a rich opportunity set.

The fund has, since inception in June 2017, been a remarkably strong performer. And while performance over a couple years can prove nothing, it can certainly point out some interesting and promising prospects.

Here those are. Out of the 129 diversified long/short equity funds in Lipper’s database, over the 18 months through 3/31/2019 – the longest measure period available to us, since the fund has not yet reached its two-year anniversary – Balter Invenomic is in the top tier in returns, in risk control and in risk-return metrics.

  Absolute value for BIVIX Relative strength
Annual returns 10.9% #2 of 129
Maximum drawdown 4.3% 11
Standard deviation 8.3 35
Downside deviation 3.8 13
Downside capture 9.5 10
Sharpe ratio 1.09 1
Martin ratio 4.9 3
Sortino ratio 2.38 1
Ulcer Index 1.8 10

Data from Lipper Global Data Feed at MFO Premium. Results exclude long/short sector funds. Results current as of month-end, March 2019.

How do you read that? Returns measure the fund’s upside for the period mentioned, while the next four measure its downside: deepest decline during the period, normal volatility, “bad” volatility and percentage of the S&P 500’s losses that it “captures”. The remaining four reflect the state of the balance between return and risk; Sharpe is the most widely-followed metric, Sortino is a bit more risk-averse and Martin is the most risk-averse of all. The Ulcer Index combines means of how far a fund falls and how long it takes to recover; funds that fall a lot and stay down tend to give their investors ulcers, hence the name. For the period we’re measuring, Balter is a top 10% performer in virtually every measure.

One important, but less known, measure of the risk-return balance is a fund’s capture ratio. It simply divides the size of a fund’s upside capture by its downside capture. As my colleague Charles Boccadoro notes in the definitions at MFO Premium: “Capture Ratio is simple the ratio of Upside to Downside Capture. Values greater than 1.0 means that a fund capture more upside than downside compared to its reference fund … a good thing!”

Capture ratio: top 10 long/short funds by 18 month Sharpe

  Capture ratio
Balter Invenomic 4.89
Saratoga James Alpha Managed Risk Domestic Equity 1.82
MFS Managed Wealth 2.17
Reality Shares DIVCON Dividend Defender ETF 1.27
AMG FQ Long-Short Equity 1.34
Gotham Defensive Long 500 1.16
PIMCO RAE Worldwide Long/Short PLUS 1.15
Gotham Enhanced 500 Plus 1.08
Gotham Absolute 500 Core 1.14
Gotham Enhanced 500 1.07
Average of funds 2 – 10 1.36

These are the ten best diversified long/short funds in existence, based on their risk-adjusted performance (Sharpe ratio) over the past 18 months. For every unit of risk, Balter captured 4.89 units of return. In contrast, the next-best fund was barely one-third as efficient and the average of the other funds in the top ten was less than one-fourth of Balter’s.

And the long/short universe as a whole? More than 100 of the 129 long/short funds were underwater: they captured more of the index’s downside than they captured of its upside. Caveat emptor, indeed.

Bottom Line

Invenomic has had an exceedingly promising start and investors have noticed. Mr. Motamed reports that they are the second fastest-growing fund behind a PIMCO offering. That has mostly been driven by family offices and RIAs, though they’ve recently launched a “super institutional” share class to better serve the prospect of a handful of quite large new investments.

Their approach is distinct (their correlation to the seven other top-performing long/short funds is just 51), their strategy is disciplined and their manager is well-tested. On whole, investors anxious about both preserving capital and generating positive returns in turbulent markets should consider putting Balter Invenomic high on their due-diligence list.

Fund website

Balter Invenomic (BIVIX). For reasons unexplained, only the Institutional share class is represented on the Balter website, leaving out the Investor and new Super Institutional options.

Elevator Talk: Alexander Oxenham, Hilton Tactical Income Fund (HCYAX/HCYIX)

By David Snowball

Since the number of funds we can cover in-depth is smaller than the number of funds worthy of in-depth coverage, we’ve decided to offer one or two managers each month the opportunity to make a 300 word pitch to you. That’s about the number of words a slightly-manic elevator companion could share in a minute and a half. In each case, I’ve promised to offer a quick capsule of the fund and a link back to the fund’s site. Other than that, they’ve got a few hundred words and precisely as much of your time and attention as you’re willing to share. These aren’t endorsements; they’re opportunities to learn more. 

Sometimes relationships start in unexpected ways. Unbeknownst of us, our relationship with Hilton Tactical Income began with our long-ago Funds in Registration filing which reports on funds not yet available to the public. After puzzling through the Hilton prospectus, we offered this breezy description: “The managers start by making a macro-level assessment and then allocate to whatever’s going to work.” Manager Alex Oxenham admits that, “After reading your note I snarkily thought to myself, ‘you bet I plan on allocating to what will work!’”

The reason for our genial skepticism is that such funds promise the world, literally, but rarely deliver. Morningstar’s Adam McCullough recently noted:

Tactical-allocation funds aim to deliver better absolute or risk-adjusted returns than static allocation funds by deftly switching exposure among asset classes. Portfolio managers may evaluate the attractiveness of an asset class using signals such as relative valuations, price trends, economic indicators, sentiment analysis, or a combination of these metrics. Although this may seem like a fruitful area for active management, tactical allocation is hard, and most that try have failed. (Do Tactical-Allocation Funds Deliver? 04/03/2019)

Mr. McCullough’s findings were that such funds rarely outperformed a simple 60/40 index, that they weren’t particularly adept at offering downside protection, that their investors didn’t stick with them and that nearly 60 were shuttered in the past four years. As a rule, then, tactical allocation fails.

Hilton Tactical Allocation appears to be a singular exception to that rule. Let’s look quickly at (1) what the managers do and (2) how well they do it.

The goal is generating high levels of current income with some potential for capital appreciation. The fund provides monthly income distributions. The key on the “capital appreciation” piece is that the managers are intent on not losing money in bad markets; in consequence, they prefer stability, quality and predictability over the pursuit of maximum short-term gain. The managers have the freedom to look across the entire capital structure of high quality corporations to determine whether the most prudent investment come from the firm’s debt offerings or from the common or preferred stock shares.

The process of building the portfolio begins with founder Bill Garvey, Mr. Oxenham and the investment committee examining a variety of macro-level factors (from interest rates and monetary policy to geo-political risks and general business conditions) to construct the portfolio’s positioning framework. Depending on the macro-level analysis, they can be anywhere from 20-60% invested in equities though the actual five-year range has been from 38% (currently) to 50%. The remainder of the portfolio is allocated between cash and a potentially wide array of debt instruments including high-yield bonds, ETFs, closed-end funds, exchange-traded notes, REITs, Treasuries, muni bonds, master limited partnerships and various sorts of asset-backed securities.

The macro-level positioning has a 30-40 day shelf life and they often trade fixed-income securities opportunistically, looking to take advantage of short-lived market aberrations. The one thing that doesn’t ever change is the focus on minimizing absolute risk and volatility.  

The results, in both absolute and risk-adjusted terms, have been consistently excellent. The Hilton strategy has been around since 2001, in the form of separately-managed accounts, and since 2013, in the form of a mutual fund.

Since inception, the fund has produced higher returns that its Lipper and Morningstar peer groups. The fund’s risk-profile, from MFO Premium, shows its strength in detail.

Comparison of Lifetime Performance (10/2013 – 3/2019)

  Annual Return Max Draw-down Std Dev Down-side Dev Ulcer
Index
Bear Market Dev Sharpe
Ratio
Sortino
Ratio
HCYIX 5.9 -5.6 5.3 3.2 1.7 2.6 0.99 1.62
Flexible Portfolio Peers 4.4 -13.2 7.8 5.2 5.0 4.1 0.52 0.82

Returns (the fund’s APR or annual percentage return) is substantially higher than its peers. Its volatility (measured by maximum drawdown, standard deviation, downside – or “bad” – deviation and bear market deviation) are all substantially lower. It’s not surprising, then, that the risk-return metrics (Ulcer Index which measures how far a fund falls and how long it stays down, Sharpe, Sortino and Martin ratios) are all vastly superior.

The Morningstar peer comparison is a bit less detailed but still consistently positive.

Comparison of Five-year Performance (through 3/31/2019)

  Annual Return Std
Dev
Alpha Beta Sharpe Ratio Sortino Ratio
HCYIX 5.17 5.25 1.19 0.68 0.83 1.35
Tactical Allocation Peers 3.06 8.38 -2.23 1.02 0.32 0.50

Hilton Tactical’s Institutional shares earned five stars from Morningstar while the Investor shares have a four-star rating (as of 4/23/2019). It also earned MFO’s “Great Owl” designation for having risk-adjusted returns in the top 20% of its peer group for every trailing measurement period longer than one year. By almost all measures, Hilton Tactical is one of the top 10 funds in its 139 fund peer group over the past five years. Since inception, it has earned the “Lipper Leader’ designation for total return, consistency of return, preservation of gains and expenses.

There’s some confirmation of the fund’s prospects in the longer-term performance of the underlying strategy. Hilton manages about $1.5 billion in assets using this strategy, with the fund accounting for less than 10% of the total. From December 2001 – December 2018, the firm’s separate account composite shows annual returns of 6.8% with a standard deviation of 5.6%. In visual terms, that looks like this:

Remember: that’s not the mutual fund though it is the strategy used in the mutual fund. The short version: the strategy can be described as having S&P 500-like returns with far lower volatility or benchmark-like volatility with far higher returns. It is, in either case, doing well.

Manager Alex Oxenham joined Hilton Capital in 2011 after a stint at HSBC Private Bank in New York as a Senior Portfolio Manager. Before that, he worked in portfolio management for Mercantile Bankshares, Bankers Trust Alex Brown / Brown Advisory and Bank of America. We asked manager Alex to share his reflections on what makes the Fund distinctive. Here are his 350 words of insight:

Hilton believes that an actively managed multi-asset portfolio of income producing securities can preserve capital, minimize volatility, and provide competitive total returns over a variety of market cycles. Our philosophy is born out of the original thesis at the launch of Hilton Capital in 2001 – that by adding other income generating assets to a portfolio of traditional fixed income holdings, a more attractive income stream can be developed, with the potential for capital appreciation, all while protecting on the downside while maintaining a low volatility experience for investors. Often individual investors panic sell during periods of extreme volatility. Our approach is predicated on creating wealth through compounding and trying to eliminate as much of the downside as possible which should help individual investors avoid the temptation of selling at the bottom. The resulting return profile over the eighteen plus years of performance has outperformed broad equity markets, with a volatility profile more in line with a fixed income portfolio.

The investment process begins with the investment committee’s top-down macro-economic evaluation, which is driven by extensive economic data-driven analysis, as well as the combined experience of the five-member investment team. We regularly share our economic outlook with our clients (www.hiltoncm.com). We believe it’s important for our investors to understand how and why we have the portfolio positioned at any given time.  In constant evolution the investment committee adjusts their views on the asset allocation amongst cash, fixed income, and equities. Capital structure, sector and individual holdings decisions are driven by a hybrid of the global macro evaluation process, valuation metrics and fundamental analysis. Our tactical changes are very dissimilar to our peers. We are focused on the need to adjust our allocation over a complete market cycle versus more short-term trading strategies.

In our experience, the Tactical Income strategy can be utilized in four main ways 1) as a potentially volatility reducing complement to an equity portfolio 2) an alternative income generator for a fixed income portfolio 3) an enhancement to a balanced portfolio and 4) as a standalone portfolio delivering income, low volatility, and the potential for growth.

The Investor share class of Hilton Tactical Income (HCYAX) has a $2,500 minimum initial investment and a 1.68% expense ratio on assets of about $125 million. The Institutional share class is at $50,000 and 1.43%, but Ladder can waive that minimum. It is available through TD Ameritrade, Charles Schwab, Fidelity, Vanguard and most major wirehouses. The Fund’s homepage is odd. That likely reflects the fact that Hilton is the step-child in the Direxion family of funds and ETFs. At base, Direxion caters to traders with their Monthly 25+ Year Treasury Bear 1.35x Fund (DXSTX), the long/short Emerging Over Developed Markets ETF (RWED) and Daily Mid-Cap Bull 3X ETF (MIDU). Those are typical of Direxion’s offerings and they are not, on whole, vehicles that require thoughtful reflections on the managers’ discipline or perspective. As a result, the template leaves content on the Hilton fund pretty thin. Don’t blame them.

River Canyon Total Return Bond Fund Institutional Class (RCTIX), May 2019

By Dennis Baran

Objective and strategy

The fund seeks to maximize total return by investing across the structured credit sectors – RMBS, ABS, CMBS, CLO, and other non-traditional fixed income sectors. The fund must invest at least 60% of its assets in securities rated as investment grade. The balance of the fund will typically be invested in bonds rated below investment grade.

The management team seeks relative value across the breadth of structured credit sectors including Agency/Non-Agency RMBS, ABS, CLOs, Mortgage Derivatives, and more esoteric sectors such as mortgage servicing rights and aircraft leasing.

The securitization process is a relatively straightforward process by transforming heterogeneous, illiquid assets/loans into securities.

These securities issue debt to investors who in turn receive cash flows generated by the underlying collateral but structured to meet various investors’ needs. The collateral generates cash flows in the form of interest and principal payments, which then flow through the security structure to investors.

River Canyon’s PM team tracks, researches, and analyzes potential investments across the 40 sectors and 200 subsectors of the structured credit market.

The structured credit market takes homogenous loans/collateral, combines them into a pool, and then carves those interest and principal payments up into a variety of cash flows fitting a variety of investor needs. Mortgages are the largest category.

That’s probably the best way to view it for most investors.

In addition to the fund, River Canyon manages separately managed accounts focused primarily on structured credit.

The main difference between these accounts and RCTIX is that RCTIX has a higher quality bias, via its requirement to invest a minimum of 60% of its assets in investment grade securities and also has more direct exposure to Agency RMBS.

The fund’s benchmark is the Bloomberg Barclays U.S. Aggregate Bond Index.

Adviser

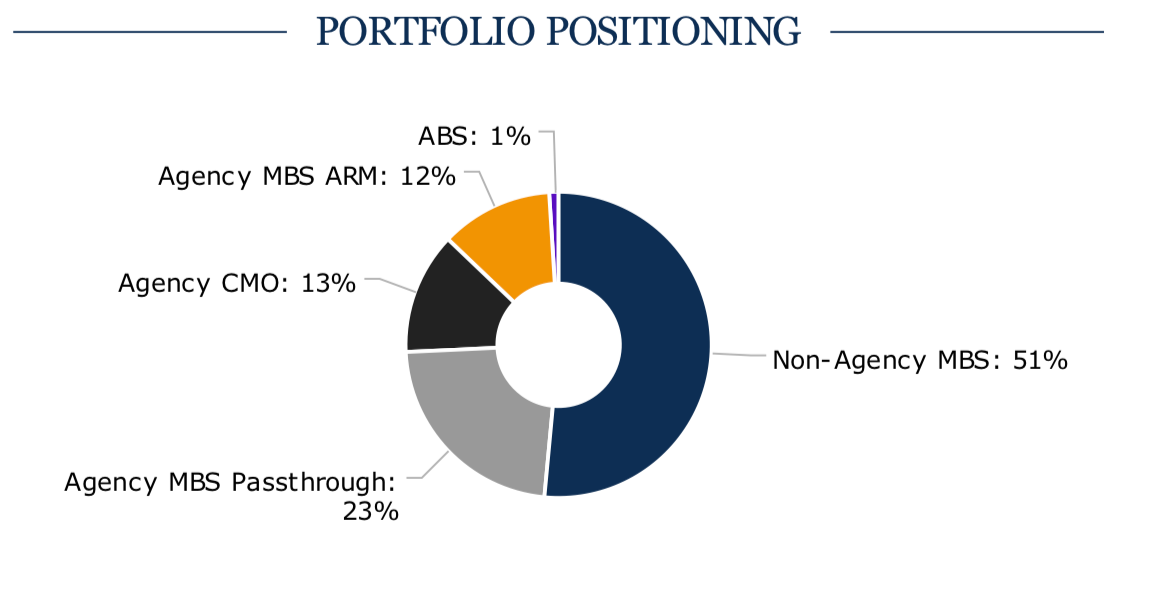
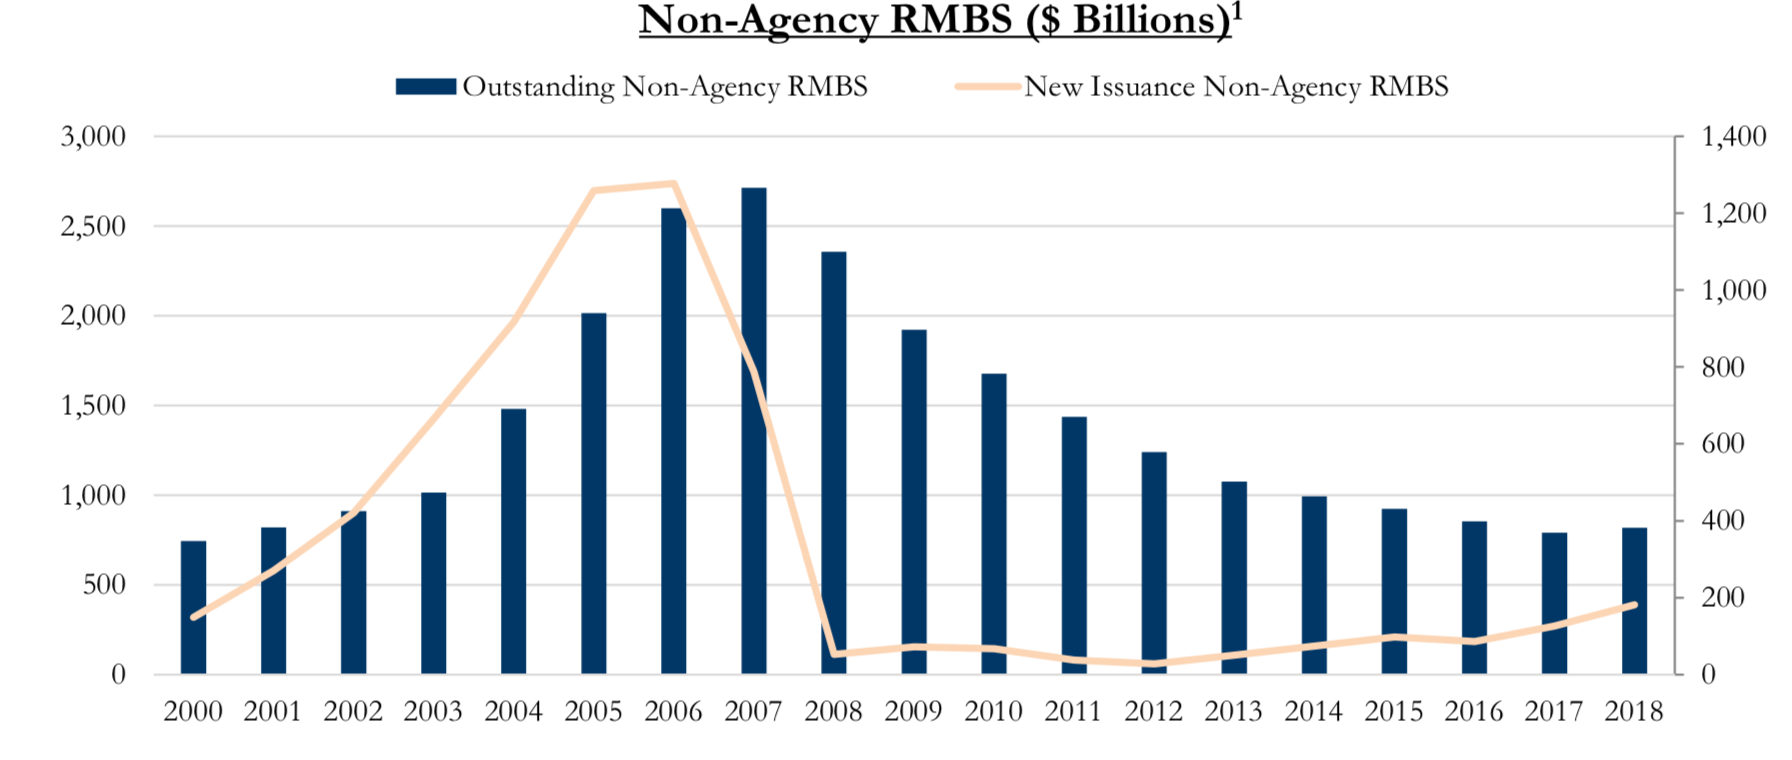
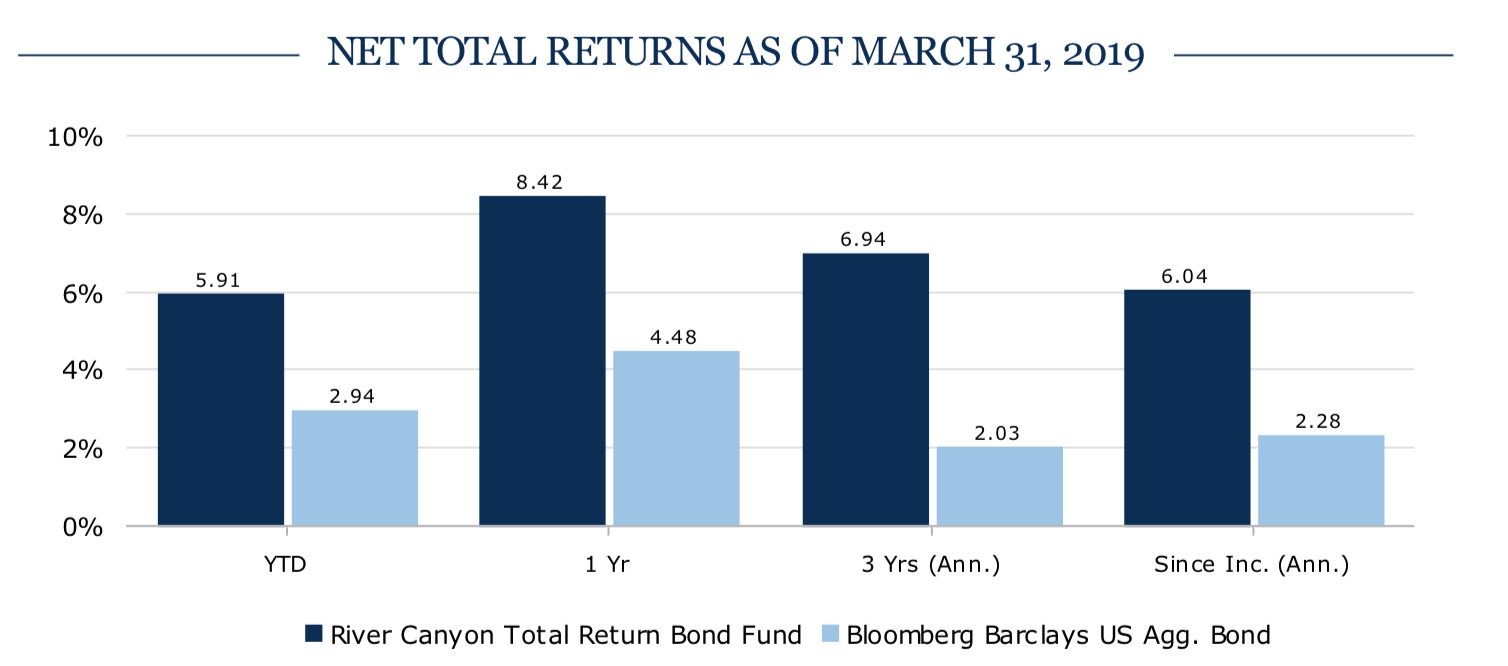
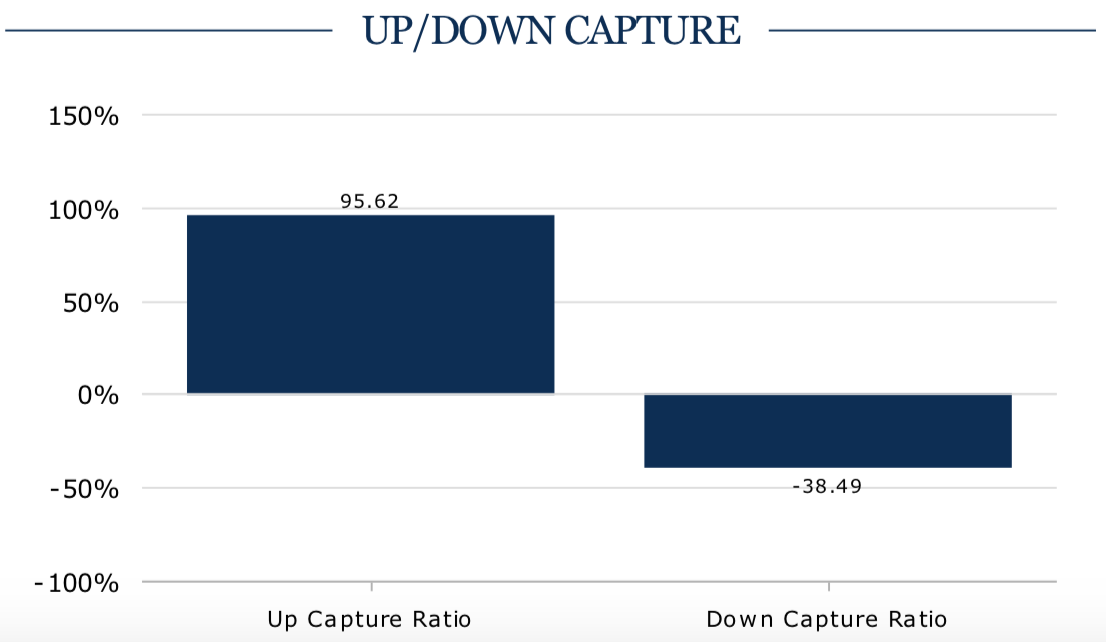
River Canyon Fund Management LLC, Los Angeles, CA., a subsidiary of Canyon Capital Advisors LLC.

Canyon Partners, founded in 1990 by Joshua S. Friedman and Mitchell R. Julis, is a credit-oriented investment manager focused on distressed and event-driven strategies. It has been managing assets since 1990 and assets in the structured credit space since 2005.

In 2013, Canyon established River Canyon Fund Management as an investment advisor for its more liquid credit strategies. With an emphasis on structured products, River Canyon’s mandates include a comingled mutual fund as well as bespoke separately managed accounts designed to fit investor objectives.

These strategies bring to bear the full resources of the Canyon platform including the research team, trading, legal, and operations alongside the accumulated knowledge of 49 tenured investment managers.

Canyon Partners had firm-wide assets of $24.4B as of March 31, 2019.

Manager

George Jikovski, CFA and Partner.

His primary focus is on the mortgage-backed securities, structured credit, and credit derivatives sectors across all Canyon strategies. Before joining Canyon in 2007, he was at Trust Company of the West, where he focused on high grade MBS, including MBS derivatives, collateralized mortgage obligations (CMOs) and market value CDOs. Previously he was with the Financial Restructuring Group at Houlihan Lokey Howard & Zukin and was an investment banker in the Corporate Finance / M&A group at Bear, Stearns & Co, Inc. He’s a graduate of University of California, Los Angeles (B.A., Business Economics and a minor in accounting). With 20 years of experience and 12 years at Canyon Partners, he has managed RCTIX since inception.

Strategy capacity and closure

 $20B is a reasonable estimate. The total structured credit market is $11 trillion. 

NOTE: Graphics courtesy of River Canyon

Active share

Active share in fixed income funds is very different from that of equity funds.

Most passive fixed income funds and ETFs have a significant amount of active share because they cannot duplicate the fixed income benchmarks as easily as an equity manager can.

Furthermore, many active fixed income funds have significant active share because they also deviate from the benchmark with their active allocation decisions.

Over time the manager expects the fund’s overlap with the Barclays U.S. Aggregate Bond Index to be its holdings in Agency Mortgages.

Also, there’s no index for structured products. It’s a very heterogeneous market and not possible to create a reproducible index. But this heterogeneity in the market is what presents active managers a rich opportunity set to mine for potential investments.

Management’s stake in the fund

As of December 31, 2018, Canyon Partners entities and the funds PM team own approximately 45% of RCTIX. Of the five Trustees, two own $10,001 – $50,000, the other three none. As of December 31, 2018, all officers and Trustees as a group beneficially owned less than 1% of the Fund. Canyon employees and partners are collectively the largest investor across the various Canyon sponsored funds including RCTIX.

Opening date

December 30, 2014

Minimum investment

By prospectus: $100K.

Actual purchase availability:

Fidelity $100,000 TF

Schwab $1,000 TF

TD $2,500 TF

Vanguard $1,000 TF

Other platforms include Pershing, LPL Financial, and Hilltop Securities.

Expense ratio

0.66% on assets of $485 million, as of July 2023. 

Multi-sector bond funds vs. structured credit products

The main difference is that a multi-sector bond fund would invest in a broader range of fixed income sectors including government, agency, emerging market, high yield, non-U.S. bonds, etc.

A structured credit fund would focus more on RMBS, CMBS, ABS, CLO, and other securitized bonds.

RCTIX is in the multi sector bond category at Morningstar because it’s benchmarked to the Bloomberg Barclays U.S. Aggregate Bond Index and its guidelines are broad enough to invest across a variety of sectors.

But it will always have a significant allocation to the structured credit markets. It’s an appropriate classification because as the fund grows, it will expand its investments across sectors and will implement some of the investment ideas from their hedge funds. 

Lipper classifies the fund as a Core Bond Fund.

NOTE: Graphics courtesy of River Canyon

The above numbers do not include the 19% cash allocation.

The average credit quality of the fund is A-.

As of March 31, 2019, the fund’s average duration was 2.97 years.

NOTE: Graphics courtesy of River Canyon

Fund Origin

Canyon has been thoughtful in developing new products and investment vehicles. The firm has a long history of generating strong risk adjusted returns in the structured credit space.

RCTIX is a natural extension of their expertise and utilizes the resources they have built over the years to invest in the structured credit sector.

The fund was seeded with firm and partner capital. Canyon decided to incubate the funds track record until it hit the three-year point. During this time the fund was available to employees and fund board members to invest.

One of the reasons for incubating the fund was market feedback from advisors, consultants, and investors, which showed that they typically preferred to see a three-year track record before they considered researching or investing in a new fund.

Coming to market with a demonstrated successful track record across a variety of market scenarios and interest rate environments would provide further credibility to the fund’s value proposition and River Canyon.

They wanted to establish a stable, longer-term track record and proof-of-concept with their clients and potential investors.

By leveraging Canyon Partners extensive structured products expertise, it constructs diverse and resilient portfolios security by security, where no single risk factor dominates returns or volatility.

They believed that the fund needed to be fully integrated into Canyon’s entire investment research team and would benefit from the insights of the almost 75 investment team members working across their hedge funds, distressed vehicles, and real estate funds.

The RMBS market

Canyon Partners began investing in RMBS on the short side in the mid-2000s, when the housing market was running wild and then pivoted to the long side after the crisis when the asset class was deeply distressed.

Over this period, Canyon became one of the largest alternative asset managers investing in the structured credit space.

As this asset class has gradually healed post the financial crisis, they believed they could leverage their existing analytical capabilities for use in a more liquid investment vehicle, namely a 1940 Act mutual fund.

So they targeted a distinct risk/reward profile that could serve the different needs of their clients and launched the fund.

NOTE: Graphics courtesy of River Canyon

Prior to the credit crisis, the outstanding legacy non-agency residential mortgage-backed securities (“non-agency RMBS”) market was approximately $2.7 trillion at its peak in 2007.

Now the non-agency RMBS market is approximately $550, positioning it under the radar of mega funds that typically invest in amounts greater than the average opportunity size in the current market.

So a trade that many believed to be over remains accessible to nimble investors, such as the fund, seeking idiosyncratic risk/reward outcomes.

At present, however, Mr. Jivoski notes that the non-RMBS legacy class market has been shrinking and becoming mature with collateral and price performance continuing to improve.

Most borrowers have substantial equity in their homes, fewer are delinquent, and defaults have slowed.

So it isn’t a source of distressed opportunities as it once was but still attractive for its resilient cash flows immune from economic volatility.

Risk management

The fund begins with a 60% minimum investment grade guideline.

In addition to the fund guidelines, Canyon Partners has invested significant capital in both public and proprietary databases as well as in the development of sophisticated proprietary risk management systems.

For RCTIX and their structured credit investments, they’ve also developed several proprietary systems specific to RMBS to knit together multiple sources of data starting at the individual loan level, sensitivity analyses of cash flow, return, and up/down scenarios.

These systems allow the team to stress test the portfolio for various scenarios across multiple inputs as well as monitor exposure and performance characteristics at the position and portfolio levels.

They stress test for changes in interest rates, equity markets, credit spreads, and volatility. 

These resources are best in class and assist in the portfolio construction and risk management processes by allowing them to identify prospective opportunities quickly, analyze securities robustly and in detail, and stress test their mortgage book in various ways.

Comments

Since inception, RCTIX has demonstrated an impressive track record, outperforming its benchmark – the Barclays U.S. Aggregate Index and its Morningstar Multi-Sector Bond category.

NOTE: Graphics courtesy of River Canyon

Performance over peers, as indicated by our Lipper Global Data Feed (LGDF), reveal a lifetime APR spread of 4.1%, 3 year of 4.6%, and a 1 year of 4.2%.

It’s also an MFO Great Owl, and Morningstar gives it an overall 5-Star rating.

Here’s Morningstar’s risk-adjusted returns as of March 31, 2019, 4.6 years since inception.

Category Multi-Sector Bond
1-Yr Category Rank 1 of 306
3-Yr Category Rank 6 of 270

MFOP Risk & Return Metrics for the fund show low drawdown, recovery, Ulcer, and Bear values and high risk-adjusted and excess returns as shown by the ratios here.

  Max DD Recovery (months) Ulcer Index Bear rating Sharpe ratio Sortino ratio Martin ratio
Life -1.6 4 0.5 1 1.47 4.54 10.60
3 Year -1.6 4 0.5 1 1.49 4.60 10.73
1 Year -1.6 5 0.6 N/A 1.17 4.90 11.00

The fund’s MFO Composite Rating – based on risk (as measured by its Martin Ratio), its MFO Rating, APR Rating, and Sharpe Ratio is 5 (Best).

The fund’s upside and downside capture ratio is very strong and appeals to investors looking to capture more upside while limiting the downside.

Source: River Canyon, March 31, 2019

Remember that the fund’s negative downside capture ratio means that it went up when its index went down – a good indicator of how the fund can provide diversification.

The fund has significantly outperformed in rising rate environments when rates have increased by 50 bps or more whereas the benchmarks have had negative performance.

NOTE: Graphics courtesy of River Canyon

The structured credit sector in general has a significant amount of floating rate debt which can act as a hedge during rising rate environments. Most fixed income sectors are primarily fixed rate, and the two risk factors that dominate bond markets are interest rate and credit risk.

Structured credit can mitigate some of the rate risk because its floating rate.

For example, the mortgage derivative sector of the market is composed primarily of Agency CMO’s. These securities have distinct interest rate sensitivity profiles and can be used to manage risk if rates are falling or rising. Since they are Agency securities, there is no credit risk, only interest rate risk.

By investing across this diverse structured credit market, a portfolio can be built to provide low correlated and attractive risk-adjusted total returns relative to many other fixed income sectors.

Rationality is one of the most important qualities that investors look for in a manager, especially when a market decline requires a proactive approach and protects investors from losses in the market.

While the fund isn’t immune to these challenges, it has outperformed vastly during those times. This has also meant playing offense while investing and reinvesting at more attractive valuations in a variety of securities, which has further enhanced returns.

The fund’s security selection has been the primary driver for the fund’s performance since inception when returns from the fixed income sectors were challenged from either rate increases and/or broad credit spread widening in several rising and falling rate environments.

That’s also because the fund isn’t levered to or dependent on specific outcomes of Fed policies or rates.

Key points show how the fund is distinctive among others in the securitized fund space.

  • The manager invests primarily in securitized mortgage sectors including agency and non-Agency RMBS, CMBS, CLOs, ABS, and Mortgage derivatives – Interest Only (IO), Principal Only (PO), and Inverse Interest Only (IIO, and others.

That’s pretty complete.

  • RCTIX has a minimum 60% investment grade guideline. Other securitized funds may lack this quality.
  • Some funds have as much as 100% legacy non-Agency RMBS exposure. RCTIX has typically had around a 50% allocation to legacy non-Agency RMBS.
  • Regarding the legacy non-agency RMBS allocations, RCTIX has a higher allocation to more senior tranches while others are more invested in the junior/mezzanine tranches of these securities.

At this time in the cycle, the manager thinks it’s prudent to move up in the capital structure vs. being lower in the capital structure.

  • Both Mr. Jivoski and Canyon Partners have broad experience and a long-term track record in securitized sectors, including the financial crisis and its effect on mortgages.
  • Jivoski’s team covers each sector as it continues to evolve.
  • He has a portfolio construction process to maximize the potential for diversification and risk-adjusted returns over time.
  • He has a strategy that focuses on incorporating diverse sources of risk to build more resilient portfolios.
  • He monitors the changing relative attractiveness of liquid alternative sectors over time.
  • His investment process has remained consistent.
  • His team believes that it can identify and invest in securities that can provide strong returns and exhibit resiliency in a deteriorating credit or spread widening scenario, particularly relative to corporate credit, which has seen an explosion in issuance at the BBB level over the past few years.

For investors concerned about a recession when rates would fall across the curve and spreads would widen, 40% of the fund is in Agency MBS. This high quality, highly liquid sector would perform quite well in this environment.

Here’s their portfolio turnover as of their fiscal year ending September 30.

2018 2017 2016 2015
47% 48% 19% 41%

RCTIX pays dividends quarterly, but they’re thinking about paying monthly.

Bottom Line

The manager has provided strong absolute and relative returns.

He’s produced a consistent track record over the past four-plus years that has outperformed its benchmark and almost every other fund in the category by a significant amount.

The structured credit sector presents compelling absolute and relative value and offers a diverse heterogeneous opportunity set for active portfolio management vs. traditional fixed-income strategies.

That means attractive, compelling, idiosyncratic value and income opportunities from often misunderstood, multifaceted, and complex securities combined with strong downside protection.

The fund is a hidden gem. The firm only began actively marketing RCTIX in the second half of 2018.

Limiting the fund’s distribution while building out its track record demonstrates the firm’s thoughtful approach to the mutual fund space.

I have confidence in RCTIX going forward.

Fund websites

RCTIX details the fund’s success in the structured credit market.

Canyon Partners provides a look at firm leadership and their five strategies.


Funds in Registration

By David Snowball

Before funds and ETFs can be offered to the public, they’ve got to be submitted to the SEC which has 70 days to review the application. In general, advisers try to launch just before year’s end because that allows them to have clean “year to date” and calendar year results to share. These launches will likely occur in late June so that they’ll at least have full-quarter results for 2019 Q3.

The dominant themes this month seem to be enhanced risk-management (Aptus, Horizon, Hussman, Quadratic, RG) and ESG emphasis (Horizon, Kennedy, Wahed). Also cannabis.

Aptus Collared Income Opportunity ETF

Aptus Collared Income Opportunity ETF, an actively-managed ETF, will seek current income and capital appreciation. The plan is to invest in a portfolio of large capitalization U.S.-listed stocks and an options collar (i.e., a mix of written (sold) call options and long (bought) put options) on the same underlying equity securities. The fund will be managed by John D. (“JD”) Gardner and Beckham Wyrick of Aptus Capital Advisors. Its opening expense ratio is 0.79%.

Cannabis Growth Fund

Cannabis Growth Fund will seek long-term capital appreciation. The plan is to create a global stock portfolio populated with companies “in legal cannabis-related businesses.” That might include biotechnology firms and industrial hemp producers as well as firms that sell cannabis. The fund will be managed by Korey Bauer of Foothill Advisors. Its opening expense ratio is 1.35% after waivers, and the minimum initial investment will be $2,500.

ETFMG Sit Short Term ETF

ETFMG Sit Short Term ETF, an actively-managed ETF, seeks maximum current income to the extent consistent with preserving capital and maintaining liquidity. The plan is to invest in a diversified portfolio of high-quality short-term U.S. dollar denominated domestic and foreign debt securities. The fund will be managed by Bryce Doty, Mark Book, and Christopher Rasmussen of Sit Fixed Income Advisers. Its opening expense ratio has not been disclosed.

Gryphon International Equity Fund

Gryphon International Equity Fund will seek to achieve long-term capital appreciation. The plan is to build an international all-cap growth-at-a-reasonable-price portfolio. The managers may use currency hedging. The fund will be managed by a largish team from Gryphon International Investment Corporation. Its opening expense ratio is 1.30%, and the minimum initial investment will be $5,000, reduced to $3000 for tax-advantaged accounts.

Horizon U.S. Risk Assist Fund

Horizon U.S. Risk Assist Fund will seek to capture the majority of the returns associated with domestic equity market investments, while mitigating downside risk through use of a risk overlay strategy. The plan is to have a mid- to large-cap defensive equity portfolio which will be supplemented by an options portfolio and its Risk Assist Strategy which appears to be a bunch of Treasury bonds. Complicated stuff will determine the extent to which the risk overlays are invoked; the managers are comfortable lagging the market during its up legs as a price for substantially protecting capital during sharp declines. The fund will be managed by Scott Ladner, Mike Dickson, and Josh Rohauer of Horizon Investments. Its opening expense ratio has not been disclosed, and the minimum initial investment will be $2,500.

Horizon Risk Assist Impact Fund

Horizon Risk Assist Impact Fund will seek to capture the majority of the returns associated with domestic equity market investments, while mitigating downside risk through use of a risk overlay strategy. The plan is to have a mid- to large-cap defensive equity portfolio which will be supplemented by an options portfolio and its Risk Assist Strategy which appears to be a bunch of Treasury bonds. The equity selection process includes an ESG screen. Complicated stuff will determine the extent to which the risk overlays are invoked; the managers are comfortable lagging the market during its up legs as a price for substantially protecting capital during sharp declines. The fund will be managed by Scott Ladner, Mike Dickson, and Josh Rohauer of Horizon Investments. Its opening expense ratio has not been disclosed, and the minimum initial investment will be $2,500.

Horizon Multi-Asset Income Fund

Horizon Multi-Asset Income Fund will seek to maximize current income while maintaining capital appreciation. The plan is to create a global portfolio with 30-70% invested in broad palette of fixed-income securities which may be supplemented by an options portfolio. The options can generate income and hedge volatility, depending on their expectation of market conditions. The fund will be managed by Ronald Saba and Mike Dickson of Horizon Investments. Its opening expense ratio has not been disclosed, and the minimum initial investment will be $2,500.

Hussman Strategic Endowment Fund

Hussman Strategic Endowment Fund (HSENX) will seek to achieve total return “and enhance the long-term spending potential of investors.” The plan is to invest in some combination of stocks, bonds and cash with the weighting determined by (1) where the better values lie and (2) how speculative the markets have become. The fund will be managed by John D. Hussman, PhD. The registration is virtually coincident with the liquidation of Hussman Strategic Value whose performance chart looks like this:

The volume of Dr. Hussman’s writing output would put many romance novelists to shame and he tends to provoke strong visceral reactions; people tend to see him as either the last sane man left or an eloquent loon. Its opening expense ratio is 1.25%, and the minimum initial investment will be $1,000.

Kennedy Capital ESG SMID Cap Fund

Kennedy Capital ESG SMID Cap Fund will seek capital appreciation. The plan is to buy ESG-screened stocks. Nothing about the discipline seems immediately exceptional: internal and external data sources but they do their own rankings, growth as a reasonable price, they engage in dialogue with management teams, and it will be fossil-fuel free. The fund will be managed by Christian McDonald of Kennedy Capital. Mr. Kennedy’s separate account composite is only 18 months old, but it has so far outperformed the Russell 2500. Its opening expense ratio is 1.14%, and the minimum initial investment will be $2500.

Pioneer Emerging Markets Equity Fund

Pioneer Emerging Markets Equity Fund will seek long-term capital growth. The plan is to do all of the usual stuff: top down, bottom up, quantitative, qualitative, located in the EMs, not located in the EMs, yada, yada. They can hold up 10% high-yield bonds and have the ability to hedge currency exposure. The fund will be managed by Patrice Lemonnier, Head of EM Equity at Amundi and Mickael Tricot. Its opening expense ratio is 1.33% for “A” shares plus a nominal 5.75% front load, and the minimum initial investment will be $1,000.

Quadratic Interest Rate Volatility and Inflation Hedge ETF

Quadratic Interest Rate Volatility and Inflation Hedge ETF, an actively-managed ETF, seeks to hedge the risk of rising long-term interest rates, an increase in inflation and inflation expectations, and an increase in interest rate volatility, while providing inflation-protected income. The plan is to invest in a mix of U.S. Treasury Inflation-Protected Securities and long options tied to the shape of the interest rate yield curve. The fund will be managed by Nancy Davis, Chief Investment Officer of Quadratic Capital Management. Its opening expense ratio is 0.99%.

Rational Special Situations Income Fund

Rational Special Situations Income Fund will seek current income and long-term capital appreciation. The plan is invest in agency and non-agency residential and commercial mortgage-backed securities, with a focus on non-agency residential mortgage-backed securities. The average effective duration ranges between -9 and 9 years, which reflects the presence of floating-rate securities whose value rises as interest rates do. The fund is the reorganized version of a hedge fund, ESM Fund, L.P., which returned 16.8% annualized from 2009 – 2018 while its benchmark rose 3% annually. The fund will be managed by Eric Meyer and William Van de Water, the hedge fund’s managers. Its opening expense ratio is 2.00% on “A” shares with also carry a sales load, and the minimum initial investment will be $1,000.

RG Tactical Market Neutral Fund

RG Tactical Market Neutral Fund will seek long-term capital appreciation. The plan is to build a global market neutral strategy using a quant process to select between 200-1,000 stocks. It might invest in them directly or through derivatives. The fund will be managed by Ben McMillan of RG Liquid Alts, LP. He’s previously managed RSQI Small Cap Hedged Fund and Van Eck Long/Short Equity Index Fund. Its opening expense ratio is 3.38% for Investor shares, and the minimum initial investment will be $10,000.

UBS All China Equity Fund

UBS All China Equity Fund will seek to maximize capital appreciation. The plan is invest in “upcoming industry leaders in key secular growth sectors early in the company’s lifecycle and when the company’s share price trades far below our estimate of the firm’s fair value.” They’re also permitted to do a fair amount of hedging. The fund will be managed by Bin Shi of USB Asset Management. Prior to joining UBS in 2006, Mr. Shi was a portfolio manager at one of China’s largest domestic mutual fund companies. (I didn’t even know they existed.) Its opening expense ratio has not been disclosed, though it does carry at 5.5% sales load, and the minimum initial investment will be $1,000 for “A” shares.

Vanguard Commodity Strategy Fund

Vanguard Commodity Strategy Fund will seek broad commodities exposure and capital appreciation. The plan is to gain exposure to commodities by investing in a wholly owned subsidiary organized under the laws of the Cayman Islands, which in turn will invest in commodity-linked derivatives and fixed income securities. The fund will be managed by Anatoly Shtekhman, Fei Xu, and Joshua Barrickman of Vanguard. Its opening expense ratio has not been disclosed (but will be very low) , and the minimum initial investment will be $50,000.

Wahed FTSE USA Shariah ETF

Wahed FTSE USA Shariah ETF, an actively-managed ETF, seeks to track the performance of a broad-based index of Shariah-compliant stocks. We don’t normally track the launch of index funds and ETFs but Muslim investors have so few fund options (no ETFs and just three fund companies) that we felt compelled to make an exception. As a practical matter, the portfolio will screen out a bunch of suspect activities (production of alcohol, tobacco, weapons or pork, as examples), and will invest mostly in mid- to large-cap stocks of companies that have strong balance sheets. You could do worse. The fund will be managed by Samim Abedi of Wahed Invest LLC. Its opening expense ratio is 0.50%.

Briefly Noted

By David Snowball

It’s both significant and depressing that over three-quarters of the space we devote to industry news, the special provenance of this feature, focuses on funds (and ETFs) that are being liquidated.

Briefly Noted . . .

SMALL WINS FOR INVESTORS

Effective April 1, 2019, the management fee for the ClearShares Ultra-Short Maturity ETF (OPER) has been reduced to 0.20%.

The $1.4 billion Columbia Small Cap Value II (COVAX) recently reopened to new investors after being closed since May 2008.

Effective April 17, 2019, the Silver-rated Diamond Hill Small Cap Fund (DHSCX) reopened to new investors.

The Bronze-rated Vulcan Value Partners Fund (VVPLX) is no longer closed to new investors.

While both funds have a lot going for them, their records of the past five years has been distinctly mixed. In the table below are the five-year ratings for each fund from MFO Premium. The colors tell the tale: red cells represent values in the worst 20% of their peer groups, blue are the best 20%.

  APR
Rating
MAXDD
Rating
Recovery
Rating
STDEV
Rating
Ulcer
Rating
Bear
Rating
MFO
Risk
Sharpe
Rating
Sortino
Rating
MFO
Rating
APR
Rank %
DHSCX 1 1 2 1 1 2 4 1 1 1 91
VVPLX 1 5 2 5 5 7 4 1 1 1 87

Neither fund seems to have had a great run over the past five years, though Diamond Hill has entirely admirable volatility management. With the funds having trailed 91% and 87% of their Lipper (not Morningstar, which are a bit better) peers, respectively, the question for prospective investors is whether they have reason to believe that conditions – either at the funds or in the market – have changed enough to warrant an investment.

OLD WINE, NEW BOTTLES

Losing their growth: The Alambic Mid Cap Growth Plus Fund (ALMGX) and Alambic Small Cap Growth Plus Fund (ALGSX) have been renamed Alambic Mid Cap Plus Fund and Alambic Small Cap Plus Fund, respectively.

Lord Abbett Micro Cap Value Fund has become Lord Abbett Focused Small Cap Value Fund.

YieldShares High Income ETF (YYY) will soon morph into Amplify High Income ETF, which will have the same strategy as the original but a new management team.

OFF TO THE DUSTBIN OF HISTORY

Affinity Small Cap Fund (AISOX) will liquidate on May 17, 2019.

AMG Systematic Mid Cap Value (SYAMX) has begun the process of liquidation (also termination and dissolution), which should be complete by June 4, 2019.

Ariel Discovery Fund (ARDFX) is merging with and into Ariel Fund (ARGFX), on or after June 21, 2019.

Causeway International Value NextShares (CIVEC) and Causeway Global Value NextShares (CGVIC), two actively-managed ETFs, will be liquidated on May 13, 2019. The funds raised just a few million each in their one year of operation.

Cboe Vest S&P 500® Enhance and Buffer Fund (MRALX) liquidated, on less than three weeks’ notice, on April 29, 2019. It did so because “the Adviser does not want to continue supporting the Fund considering the availability of the strategy in other investment products that are offered by the Adviser.” With due deference to the adviser and the fund’s board, the “other products” (for example, the Market Neutral Yield Strategy, which launched in 2016) were around on the day the fund launched less than two years ago. An alternate explanation might be that the fund has $5 million in assets which generates $60,000 in annual income for the adviser and, since assets were going down, so was that modest stipend. (Really, they might generate more income by getting a Keurig machine and charging two bucks a shot for hot caffeine.)

Cedar Ridge Unconstrained Credit Fund (CRUPX) will be merged with Shelton Tactical Credit Fund (DEBTX) some time in the second quarter of 2019.

Diamond Hill Financial Long-Short Fund (BANCX) will merge with Diamond Hill Research Opportunities Fund (DHROX), effective on or about June 7, 2019. That decision was based “largely” on low asset levels in BANCX and “its history of net redemption activity.”

Eagle Rock Floating Rate (ERFAX) liquidated on April 3, 2019.

First Trust AQA Equity Fund (AQAAX) will terminate and liquidate (a twofer!) on June 25, 2019.

Subject to shareholder approval, FundX Tactical Upgrader Fund (TACTX) will merge into the FundX Conservative Upgrader Fund (RELAX) sometime over the summer. If nothing else, FundX is good at tickers.

Highland Tax-Exempt Fund (HTXAX) will go away on or about May 15, 2019

Hussman Strategic Value Fund (HSVLX) has closed to new investments and will liquidate on my birthday, May 29, 2019. Within a month of that event, Hussman will launch another distinctly-Hussman fund which we chronicle in this month’s Funds in Registration.

IQ-Striquer Fund (IQSAX) will be closing and liquidating on May 29, 2019. (Had I mentioned the date of mon anniversaire de naissance?)

A few weeks after the death of founder Frank James, the Board of Trustees of The James Advantage Funds approved the liquidation of the James Long-Short Fund (JAZZX) and the James Mid Cap Fund (JAMDX). An interesting note followed: “As a result of three shareholders of each Fund collectively owning a majority of the outstanding voting securities of that Fund and indicating that they would vote in favor of such liquidation, shareholder approval is anticipated to be received with respect to each Fund in late April or early May 2019.”

The good folks at Keeley Funds profess to be “pleased to announce” that Keeley Small Cap Value Fund (KSCVX) will be “reorganized into Keeley Small Cap Dividend Value Fund (KSDX) on June 7, 2019, at which point Small Cap Value will undergo “liquidation and dissolution.” I would have thought the reorganized out of existence part would have pretty much covered the same territory as the “liquidate and dissolve” part. That just illustrates the difference between folks with PhDs and those with JDs.

The Board of the Hennsler funds was similarly pleased to announce the transformation of their Hennsler Equity Fund (HEQFX) into the new Monteagle Opportunity Equity Fund on or about May 25, 2019.

Morgan Stanley Institutional Global Multi-Asset Income Portfolio (MSGOX) will be liquidated on or about May 31, 2019. “The Fund will suspend the offering of its shares to all investors at the close of business on or about May 29, 2019.” which is (a) my birthday! and (b) silly. Why continue accepting investments knowing that they have to be immediately returned?

Nuveen Multi-Asset Income Fund will be liquidated after the close of business on May 17, 2019.

QuantX Risk Managed Growth ETF (QXGG), QuantX Risk Managed Multi-Asset Total Return ETF (QXTR) and QuantX Dynamic Beta US Equity ETF (XUSA) will liquidate in May.

Skybridge Dividend Value Fund (SKYAX) will merge into Centre Global Infrastructure Fund (DHIVX) or about July 19, 2019. The handwriting was on the wall when Morningstar featured Skybridge in an article entitled “Stay Away From These Funds” (2018).

In a classic case of overkilling the kill: “Effective April 26, 2019, each of the Virtus Newfleet CA Tax-Exempt Bond Fund , Virtus Seix Georgia Tax-Exempt Bond Fund, Virtus Seix North Carolina Tax-Exempt Bond Fund and Virtus Seix Virginia Intermediate Municipal Bond Fund was liquidated. Each Fund has ceased to exist and is no longer available for sale. Accordingly, each Fund’s Prospectuses and SAI are no longer valid.”

Wintergreen Fund (WGRNX) has closed and will liquidate on June 3, 2019. This is one of those cautionary tales about superstar managers (which Mr. Winters, protégé of Michael Price, who was protégé of Max Heine, certainly was) striking out on their own.  Having been there at its launch, we’ll try to reach out to Mr. Winters as he brings his fund to ground to see how a first-rate guy makes sense of navigating a second-rate market.

Xtrackers Germany Equity ETF and Xtrackers MSCI United Kingdom Hedged Equity ETF liquidated on April 30, 2019.

Manager changes, April 2019

By Chip

In the course of the average month, MFO chronicles partial or complete manager changes at 60 – 80 active equity, alternative or balanced mutual funds. We rarely report on changes at passive products or “vanilla” bond funds because, in about 99% of such instances, the changes are inconsequential to the fund’s performance.

This month, changes were reported at only 30 funds – a few low which largely parallels the lull in fund liquidations which we report in our “Dustbin of History” feature. Two of those changes are attendant to the unexpected death of Patrick Flynn, of Neuberger Berman. Mr. Flynn left behind a wife and several young children, for whom we mourn and to whom we extend a hope of peace and comfort in the hard days ahead.

Ticker Fund Out with the old In with the new Dt
AISCX Acuitas International Small Cap Fund Zu Cowperthwaite, Rahwa Senay, Waldemar Mozes (still the finest Transylvanian PM ever), Mostafa Hassan, and Jonathan Brodsky are no longer listed as portfolio managers for the fund. David Savignac, Qing Ji, Robert Beauregard, Christopher Tessin, and Dennis Jensen will continue to manage the fund. 4/19
AFMCX Acuitas Us Microcap Fund Stacey Nutt is no longer listed as a portfolio manager for the fund. James Bitzer, David Jensen, Christopher Tessin, Michael Thomas, Michael Waterman, Todd Wolter, Timothy Chatard, DeShay McCluskey, and Touk Sinantha will continue to manage the fund. 4/19
SMAMX ALPS/Smith Total Return Bond Fund No one, but . . . Eric Bernum joins Gibson Smith in managing the fund. 4/19
AFPTX AMG Managers Fairpointe ESG Equity Fund Mary Pierson will no longer serve as a portfolio manager of the fund. Brian Washkowiak rejoins Thyra Zerhusen and Frances Tuite on the management team. 4/19
CHTTX AMG Managers Fairpointe Mid Cap Fund Mary Pierson will no longer serve as a portfolio manager of the fund. Frances Tuite joins Thyra Zerhusen, Marie Lorden, and Brian Washkowiak on the management team. 4/19
AMFAX ASG Managed Futures Strategy Fund Effective July 1, 2019, Robert Sinnott will no longer serve as a portfolio manager of the fund. Alexander Healy, Kathryn Kaminski, John Perry, Philippe Lüdi and Robert Rickard will remain as managers of the fund. 4/19
MDLOX Blackrock Global Allocation Fund Kent Hogshire is no longer listed as a portfolio manager for the fund. Rick Rieder, Dan Chamby, Russ Koesterich, and David Clayton will continue to manage the fund. 4/19
DRAKX BNY Mellon Sustainable Balanced Fund Paul Flood and Bhavin Surendra Shah are no longer listed as portfolio managers for the fund. Karen Wong, Yuko Takano, Rob Stewart, Rajesh Shant, Nancy Rogers, and Paul Benson now manage the fund. 4/19
BCIIX Brown Capital Management International Equity Fund No one, but . . . Daniel Boston joins Kabir Goyal, Duncan Evered, and Maurice Haywood in managing the fund. 4/19
BCSVX Brown Capital Management International Small Company Fund No one, but . . . Daniel Boston joins Kabir Goyal, Duncan Evered, and Maurice Haywood in managing the fund. 4/19
BCSIX Brown Capital Management Small Company Fund No one, but . . . Chaitanya Yaramada joins Daman Blakeny, Andrew Fones, Damien Davis, Kempton Ingersol, Keith Lee, and Robert Hall on the management team. 4/19
CHNAX Clough China Fund Brian Chen is no longer serving as a co-portfolio manager of the fund. Charles Clough and Anupam Bose continue to serve as co-portfolio managers of the fund. 4/19
DNEMX Dunham Emerging Markets Stock Fund Eric Leve, Peter Hill, and Dan McKellar are no longer listed as portfolio managers for the fund. Brian Coffey, Ian Beattie, and Oliver Adcock are now managing the fund. 4/19
FADLX Frost Low Duration Bond Fund No one, but . . . Markie Atkisson joins Jeffery Elswick in managing the fund. 4/19
GTCSX Glenmede Small Cap Equity Portfolio Robert Mancuso retired as a portfolio manager to the fund. Christopher Colarik and Jordan Irving will continue to manage the fund. 4/19
GSAGX Goldman Sachs Asia Equity Fund Kevin Ohn and Seong Kook Jung are no longer listed as portfolio managers for the fund. Basak Yavus, Sumit Mangal, and Hiren Dasani will now manage the fund. 4/19
HYFIX Harbor High-Yield Bond Fund Steven Schweitzer no longer serves as a portfolio manager for the fund. Mark Shenkman, Justin Slatky, Eric Dobbin, Robert Kricheff, and Neil Wechsler continue to serve as co-portfolio managers for the fund. 4/19
TGRDX Invesco Pacific Growth Fund William Yuen and Daiji Ozawa are no longer listed as portfolio managers for the fund. Mike Shiao is now running the fund. 4/19
HEMRX Janus Henderson Emerging Markets Fund Glen Finegan is no longer listed as a portfolio manager for the fund. Stephen Deane joins Michael Cahoon in managing the fund. 4/19
JFNAX Janus Henderson Global Life Sciences Fund As of April 30, 2019, all references to Ethan Lovell are deleted from the fund’s prospectuses. Mr. Lovell intends to remain at Janus Capital Management LLC until June 2019 to assist in transitioning the fund. Andrew Acker will continue to manage the fund. 4/19
JHAAX John Hancock Global Absolute Return Strategies Fund Guy Stern is no longer the portfolio manager of the fund. Aymeric Forest is added as the portfolio manager of the fund. 4/19
MOPIX MainStay MacKay Small Cap Core Fund Michael Welhoelter, David Pearl, and Justin Howell are no longer listed as portfolio managers for the fund. Migene Kim and Mona Patni will now manage the fund. 4/19
NHINX Neuberger Berman High Income Bond Fund We are saddened to report the death of co-manager Patrick Flynn, on 4/23/2019. Thomas P. O’Reilly, Russ Covode, Daniel Doyle and Joseph Lind continue to manage the fund. 4/19
NHSAX Neuberger Berman Short Duration High Income Fund We are saddened to report the death of co-manager Patrick Flynn, at age 49, on 4/23/2019. Thomas P. O’Reilly, Russ Covode, Daniel Doyle and Joseph Lind continue to manage the fund.  
NBMIX Neuberger Berman Small Cap Growth Fund Marco Minonne will cease his portfolio responsibilities on May 24, 2019. Chad Bruso, Trevor Moreno, Kenneth Turek will continue to manage the fund. 4/19
FSNHX Silk Invest New Horizons Frontier Fund Olufunmilayo Akinluyi will no longer serve as a portfolio manager for the fund. Hifza Zia joins Zin El Abidin Bekkali in managing the fund. 4/19
SSPGX State Street Institutional Premier Growth Equity Fund Effective August 30, 2019, David Carlson will no longer serve as a portfolio manager of the fund. William Sandow will continue to manage the fund. 4/19
SIVIX State Street Institutional Small-Cap Equity Fund David Wiederecht will no longer serve as a portfolio manager for the fund. Shawn McKay joins Dennis Santos, Marc Shapiro, Frank Latuda, Michael Cook, Scott Brayman, and Robert Anslow on the management team. 4/19
SUSIX State Street Institutional U.S. Equity Fund Effective August 30, 2019, David Carlson will no longer serve as a portfolio manager of the fund. Michael Solecki will join Paul Nestro and Christopher Sierakowski on the management team. 4/19
FAUDX Strategic Advisers Short Duration Fund No one, but . . . Christopher Heavey joins Jonathan Duggan in managing the fund. 4/19


April 1, 2019

By David Snowball

Dear friends,

It’s been an especially distressing month. Rapid and widespread flooding following a hard winter destroyed the lives and livelihoods of many thousands of good folks in eastern Nebraska and western Iowa. Levees failed, bridges and roads were swept away, homes and equipment left mangled. Many are in despair at the loss of thousands of newborn calves, with loss to private and public property exceeding a billion dollars. At the same time, Cyclone Idai, the second-worst in the region’s history, swept across eastern Africa, likely killing more than a thousand and leaving hundreds of thousands homeless and hungry. While it is only “weather,” persistent patterns in the weather define our climate and the pattern of the past five years has been increasing numbers of extreme weather events.  We really need to work together to figure out how best to manage these challenges.

Speaking of challenges, presidential wannabees are beginning to descend on Iowa. We’ve even got a website to keep track of the invasion. There are days when you can’t get your oil changed without tripping over one of them. Okay, so here’s our little state secret. You know all those pictures where would-be presidents have donned plaid shirts with rolled-up sleeves and are sitting down to some “real Iowa food”?

Yeah, actually we don’t eat any of that crap. It started as a sort of party game called “what do you think we can convince those rubes to stuff in their mouths?” which ended up with deep-fried, bacon-studded pork nuggets on a stick and four pound, two foot wide pork tenderloin sandwiches. (Had I mentioned our experiment with deep-fried butter? Took out two Republicans and a Democrat with that one.)

Thanks!

As ever, to the 30,000 or so of you who spend part of your month with us.

To the folks on the discussion board, who daily share Virtual Excedrin and chuckles.

To the journalists with whom we’ve had increasingly frequent conversations. I’m hopeful they help us all be smarter.

To Marty (We know what you’re looking for. Be patient, the profile is on the way), the good folks at Gardey Financial for their years of support, Richard, Himu from Florida, Peter from Medina, Paul K., James (extra strength Exedrin – Thanks!), and Jonathan.

Thanks, most especially, to the small but growing circle of folks who’ve chosen to make a (generally modest, universally appreciated) monthly contribution in support of MFO. We think of you – Doug, Deborah, Greg, William, Brian, David – as “our subscribers” and are hopeful of sharing a small thank-you later this week. Sadly, I have almost no snail mail addresses so look for a query in your inbox!

MFO upcoming

David, Charles and Ed will be in Chicago, at or near the Morningstar conference, in the second week of May. Please do drop us a note if you’d like to catch up while we’re there.

Chip and I will be in western Ireland during the first 10 days of June. She’s masterminded a day-by-day itinerary for our time around Dingle, Doolin and Galway. If you’ve got strong opinions about “can’t miss” meals or experiences, let her know and we’ll share pics!

Given our sense that the investment climate feels nearly as parlous as the physical one, we’re hopeful of highlighting more, and more interesting, safe harbor and ESG investment opportunities. If you’ve spotted something that you think we should know more about (that happens a lot), please do pass along your reflections and we’ll see what we can learn.

As the One Minute Manager guy, Kenneth Blanchard, notes and the Make Me Smart podcast guy, Kai Ryssdal, repeats: “none of us is as smart as all of us.”

Cheers!

david's signature

Death Cleaning my portfolio

By David Snowball

Or, since I teach at a historically Swedish-Lutheran college, I might use the original Swedish term: I was döstädning my portfolio.

By way of background, my income comes from teaching at the aforementioned Augustana College; it’s exceedingly secure but has not increased much, in real or inflation-adjusted terms, in quite a while. It has “bond-like” qualities. I invest about 13% pretax for retirement, the college has a match that adds about 10% and I squirrel away around 10% of my take-home pay each month. Our home in Davenport is small, snug and affordable. Our cars are used but clean and efficient. Our splurges often enough involve live music and local brews somewhere in town.

Annually I share a bit about how I’ve been thinking about my own portfolios and what I’ve done about them. The short version, most years, is that I think “gosh, markets are weird” and then continue making steady but modest automatic monthly contributions. If that studied calm left me with a portfolio that’s a bit smaller than it might have been, it also left me with the time and energy for a life that’s a bit richer.

Here’s the discipline:

  1. work out the strategic plan
  2. work out the tactical plan
  3. execute the plan
  4. don’t get all smart and twitchy and screw up the plan (again)

The strategic plan is the big picture and it mostly involves my asset allocation and funding levels. In my retirement portfolio, I invest about two-thirds in equity and one-third in income. My equity exposure tends to have abnormally large commitments to international equity (about half of the total) and emerging markets (nearly half of the international piece). While I prefer to tilt toward the value, size and quality factors, the fact that large, low-quality and growth have been outperforming keeps tilting it back. My income exposure tends, likewise, to have more international and non-investment-grade bond exposure, partly through the TIAA Real Estate portfolio.

Over the long term, I’ve been able to meet my goal of 5-6% real returns which is what it will take to give me a good chance of managing 25 years in retirement.

In my non-retirement portfolio, I invest about half in equity and half in income. I tend to have a strong tilt toward international, small, value and emerging markets. It is not a tax-efficient allocation. Here’s why: I don’t have a substantial savings account and haven’t for years. I loathe the idea of locking in losses, which is what happens when my credit union’s saving account pays 0.10% APR and my cost-of-living rises at 10-20 times that rate. So instead, I have a substantial commitment to several exceedingly low volatility income funds that return 2-4% annually complemented by a couple slightly riskier income-oriented funds that aren’t hostage to US interest rates.

In general, for non-retirement investors, stocks should be treated like cooks treat habañero peppers: cautiously and with a clear understanding that a little bit is good and a lot is disastrous. Asset allocation research from T. Rowe consistently illustrate the risk: stock-light portfolios make a bit above 5% annually, stock-heavy portfolios make a bit below 6% annually while nearly quadrupling your risk.

The tactical plan is the selection of individual investments needed to carry out the strategic plan. In general, my experience and my reading of the professional and research literature make me comfortable favoring actually active over passive; risk-aware investors over market-beating ones; small, driven firms over large, asset-loving ones; managerial records that are respectable over entire market cycles rather than great during short, arbitrary periods; and advisors whose hearts, souls and family fortunes are invested next to my pittance.

I execute the plan by setting up automatic monthly investments. My personal record of self-discipline is no better than yours; anything that I don’t do automatically, I don’t do.

I avoid getting too smart for my own good by ignoring my portfolio for months on end and refusing to change it for years on end. As long as the manager remains faithful, I do except when there’s a change to my strategic plan.

And that’s where the döstädning kicks in.

Vast changes in my retirement portfolio. For years, Augustana offered a 403(b) retirement plan that provided benefit access to all of TIAA-CREF, Fidelity, T. Rowe Price, American Century and Lutheran Brotherhood. Rather more than 800 funds. That system worked very poorly for most employees of the college and, about five years ago, I participated in a complete redesign of the system to offer just a couple dozen high quality choices, with auto-enrollment and auto-escalation provisions. That worked splendidly for 98% of the college’s employees; I was part of the 2%. The new system shut down access to T. Rowe and Fidelity, leaving me with a tri-part portfolio of TIAA-CREF (funded by the college’s contribution) and Fidelity and Price (funded by my personal withholding). Between the three, I owned just over 30 funds. Given that I can no longer add to either Price or Fidelity it was time to change.

Change #1: I moved all of my Fidelity money over to T. Rowe Price, which reduced the number of funds I was following from 22 to 10.

Change #2: I moved 90% of my Price money into T. Rowe Price Retirement 2025 (TRHHX) then recreated my traditional tilt toward the emerging markets by buying Emerging Markets Discovery (PRIJX) and Emerging Markets Bond (PREMX). All three funds are MFO Great Owl funds, meaning that they’ve landed in the top 20% of their peer groups for risk-adjusted returns in every measurement period longer than one year. Two of the three are also five-star funds under Morningstar’s system and tw0 (2o25 is Silver, EM Bond is Bronze) have received the endorsement of the Morningstar analysts. Morningstar’s machine-learning system projects a Silver assignment for EM Discovery.

Strategic changes in my non-retirement portfolio. I wrote, last month, about the sustained threat posed by climate destabilization. Climate destabilization triggers four different kinds of risks which impact our portfolios as well as our lives. Some of those risks (for example, regulatory and reputational) strike me as pretty immediate, and all seem to be growing in intensity. We made that assessment in our March issue. In our April issue, we’ve worked to identify the sustainable/ESG funds which marry the best long-term performance (measured by MFO and Morningstar ratings) with the most principled portfolios (measured by Morningstar sustainability ratings and Fossil Free Funds).

From that analysis, I concluded that the most compelling ESG equity fund is Brown Advisory Sustainable Growth (BAFWX). In response to that finding, I decided to (a) add BAFWX to my portfolio and (b) provide an updated but condensed version of Dennis Baran’s fine profile of the fund. For folks wanting richer detail, Dennis’s original profile is still the place to turn.

In the months ahead, I’ll look to make a comparable addition to the income-oriented part of the portfolio. No one stands out in the way a couple of the equity ESG funds do, so research is ongoing. Maybe Saturna Sustainable Bond (SEBFX)?  Maybe learn a bit more about Zeo Sustainable Credit Fund after its likely launch next month? I really don’t want returns below the rate of inflation (think 2% or more) or to be hostage to the US credit cycle (see above), which means look for “credit” funds or ones with a globally diversified portfolio. I’ll work on it, and share.

– Growth –

Artisan International Value (ARTKX): about the best of the international value funds, the fund got dinged for weak relative performance in 2017 (when it made 24%, for gosh sakes) and 2018 (when it trailed its peers by 1%). No worries there, though the evolution of the management team bears watching: founding managers Samra and O’Keefe have split the responsibilities, with O’Keefe taking custody of Artisan Global Value and Samra taking responsibility here. In each case, they added younger co-managers last year. Planning for change is good, so I cheer them. Now the question is, how will the changes play out? I’ll watch. Closed to new investors.

Brown Advisory Sustainable Growth (BAWFX): new for 2019! Check out the profile.

Grandeur Peak Global Reach (GPROX): the core fund in Grandeur Peak’s global micro- and small-cap lineup. Below average volatility, well above-average returns, four stars at Morningstar and the equivalent of four stars at MFO. Closed to new investors.

Grandeur Peak Global Microcap (GPMCX): Grandeur Peak’s smallest and most venturesome fund, the fund was subject to a prelaunch subscription, a quota on how much you could invest, and a hard closure on the day of launch. I find it fascinating, and it’s returned rather more than 8% a year so far.

Intrepid Endurance (ICMAX): I love the discipline (absolute value, small cap focused) and am increasingly worried about the execution. While ICMAX finished in the top 5% in 2018, its long-time manager Jayme Wiggins left on short notice in September, president Mark Travis filled in for four months, and now three young managers have ascended. The managers haven’t found a use for their 70% cash stake leaving them with a five-year record that trails, oh, my savings account at the credit union. Former managers Eric Cinnamond and Jayme Wiggins have filed to launch a new fund using the Endurance style with slightly lower fees; I’ll keep watch there to see whether I’ll move the money to the original Endurance managers.

– Growth & Income –

Seafarer Overseas Growth & Income (SIGIX): Seafarer is a long-time holding that underwent several evolutionary changes in 2018. Andrew Foster has been the lead manager and pursues a sort of growth-as-a-reasonable price discipline, which led to exceptional returns and muted volatility. With the evolution of the EMs themselves, Andrew instituted two changes at the fund: his two long-time associates are now recognized as co-managers and they are structuring distinctive value and growth components into portfolio. Where, for example, value stocks might have coincidentally been 10% of the total portfolio, now they might consciously be a quarter or more of it.

Matthews Asia Growth & Income (MACSX): one of the most conservative ways to invest in Asian stocks, MACSX tends to have solid absolute returns in rising markets and outstanding relative returns in falling ones. In 2018, its 10% loss bested 80% of its peers.

FPA Crescent (FPACX): managed by Steven Romick, Crescent has long been a “go anywhere we can find exceptional value” fund with a superb record. Mr. Romick, like most of the folks at FPA, pursues an “absolute value” orientation that I find compelling. At base, the absolute value investors say “we’ll only buy if we’re offering an attractive security priced with a compelling margin of safety, absent that, we’re going to wait.” The fund had a rare and substantial stumble in 2018. I’ll wait to hear Mr. Romick’s discussion of it, but I’m not making long-term decisions based on short-term performance.

– Income –

Matthews Asia Strategic Income (MAINX): Teresa Kong strikes me as frighteningly smart, and she’s done a fine job. Morningstar switched their peer group last year from “international” to “emerging,” which makes the relative data weird: Morningstar says they finished at the 50th percentile over the past five years but also that they’ve substantially outperformed their peers in each of those years. Uhhh …

RiverPark Short Term High Yield (RPHYX): my lowest volatility holding, RPHYX typically churns out 2-4% with its maximum-ever drawdown of 0.6%. That constancy has made it an MFO Great Owl. Closed to new investors.

RiverPark Strategic Income (RSIVX): nominally the next-step-out on the risk-return spectrum from the folks who managed RPHYX, which originally aspired to about double its sibling’s return. It hasn’t really managed that over time, though it did trounce RPHYX in two individual years. Much lower Sharpe, much higher maximum drawdown.

T. Rowe Price Strategic Income (RPSIX): a globally diversified T. Rowe Price fund-of-income-funds, with a slice of dividend-paying stocks. It lost 2.6% in 2018 which isn’t surprising given its exposure, however conservative, to stocks and EM bonds.

Bottom line: down about 9% in 2018, with everything touching international equities seeing double-digit declines. It happens. Five goals for 2019:

  1. sort through the raft of retirement plan changes announced by Augustana (few of which thrilled me) to reassert control over my 403(b);
  2. rebalance back to my target asset allocation, which means moving some international money into the Brown Advisory fund;
  3. monitor two funds closely;
  4. search for a suitable ESG income fund; and
  5. attend to the new management configurations at Artisan and Seafarer

Learning from the fall fall

By David Snowball

The last substantial decline in the US stock market occurred between 2007-09. Vanguard Total Stock Market Index Fund (VTSMX) declined by 50.9% and remained under water for 52 months. Vanguard International Stock Market Index (VGTSX) fell 58.5% and did not recover for 114 months. Investors in Vanguard Emerging Market Index (VEIEX) would be at least a little envious of the fact that VGTSX investors were in the red for almost ten years, since they were at a loss for more than 10 years after their portfolio hit bottom. Investors who hewed to the “stocks for the long-term” mantra and faithfully held their VEIEX shares ended the decade with an average annual loss of 0.1%.

The good news is that it’s over: almost all diversified funds have managed to recover all of the losses they suffered and then some.

The bad news is that it could have been much worse. In major bear markets, stock valuations often drop from “way too high” at the outset, rocket past “entirely reasonable” and crash around “horrifyingly low,” which sets up a rebound and a new bull market. That didn’t exactly happen in 2007-09, valuations were so historically high before the crash that a 50% decline didn’t return them to “horrifyingly low.” At the worst of the decline, stock valuations were no lower than “about reasonable.”

Here’s the Shiller p/e ratio for the US stock market from the late 19th century to the early 21st century. Shiller’s p/e tries to eliminate some of the distortions caused by short-lived profit spikes, since those spikes create the temporary illusion that market valuations are fabulously low.

The median Shiller p/e for that 140-year period is 16.9; the depth of the sharpest percentage decline since the Great Depression brought the market’s p/e down to just 15 in March 2009. If the market bottomed at the levels typical of major bear markets, it would have been in the single digits.

It may be that we will never see single-digit valuations ever again because, you know, technology and algorithms and the Fed. Those of us depending on relatively modest retirement portfolios to keep us from spending our Golden Years in a repurposed dumpster out behind the Walmart, might want to approach such optimism with caution.

The worse news is that another crash is coming. That’s not a market-timing call, it’s simply a report on 2000 years of investment history. Markets climb, often irrationally. Markets fall, often irrationally. The past 10 years have seen a nearly unbroken rise in domestic equity markets, punctuated by a series of minor hiccups:

Year Duration of the decline Extent of the decline
2010 5 months 16%
2011 3 months 19
2015 2 months 15
2015-16 3 months 13
2018-19 6+ months* 20

* as of 29 March 2019, the domestic Total Market and S&P 500 indexes are within about 2% of their all-time highs from September 2018. Having posted its best quarter in decade, the correction feels mostly “done.”

The folks at Yardeni Research have published a series of graphs that illustrate the extent, timing and severity of market declines over the past century. Their work gives you a sense of how inconsequential all the Sturm und Drang over the past decade has been:

The simple question is, are you ready for the next round? The problem is that many of the most popular investment options available today didn’t exist in mid-2007. Almost half of all existing mutual funds (3340 of 7348) launched after October 1, 2007, which means we don’t have a record of how they handled the last really extended bear market.

We can help

We can, however, get a snapshot of how they did during the second-worst stretch in recent market history, the 2018-19 correction. I used the fund screener at MFO Premium to show the risk-adjusted performance of all funds and ETFs over the past six months, which captures both the autumn decline and the winter rebound. Our guess is that the performance of funds during a short, sharp cycle will give you an insight into how they might perform in a long, grinding cycle later.

The statistics below measure fund performance from September 1, 2018 – February 28, 2019 so they capture the few weeks before the market peak and exclude March, 2019. Here are the ten funds (well, nine funds and an ETF) that had the best risk-adjusted performance during that mini-cycle.

  Maximum drawdown Sharpe ratio Ulcer Index
Benchmark: Vanguard Total Stock Market (VTSMX) -14.3% -0.39 7.6
Spectrum Low Volatility (SVARX) -2.1 0.78 1.2
SEI Multi-Asset Income (SIOAX) -2.8 0.57 1.5
Fidelity Advisor Series Growth Opportunities (FAOFX) -10.4 0.46 6.5
FAM Equity-Income (FAMEX) -8.1 0.43 4.1
Invesco S&P 500 Low Volatility ETF (SPLV) -6.9 0.42 3.1
AMG Yacktman Focused (YAFFX) -4.7 0.41 2
Marshfield Concentrated Opportunity (MRFOX) -8 0.41 4.1
Calvert Equity (CSIEX) -8.4 0.38 4
AMG Yacktman (YACKX) -4.9 0.35 2.1
Akre Focus (AKREX) -8.5 0.29 4.4

MFO Premium search string: Mutual Funds + ETFs, U.S. Equity + Mixed Asset, Only  Great Owl Funds, display 09/2018-02/2019. N = 203 funds/ETFs

To test the hypothesis that performance during the autumn-to-winter cycle might help us identify funds and ETFs that will serve us well during an extended bear, we then looked at the relative performance of each of these funds, upside, downside and risk-return balance, from the time of its inception (periods ranging from 3 – 32 years) to now. The table below documents our findings.

Performance since inception

  Age APR Max DD Recov Std Dev DS Dev Ulcer Bear Sharpe MFO
Spectrum Low Volatility 5 5 1 2 1 1 1 1 5 5
SEI Multi-Asset Income 7 4 1 2 1 1 1 1 5 5
Marshfield Concentrated Opportunity 3 5 1 2 2 1 1 1 5 5
Akre Focus 10 5 1 3 1 1 1 1 5 5
AMG Yacktman 27 5 1 1 2 2 1 2 5 5
Calvert Equity 32 2 1 1 1 1 1 1 4 5
AMG Yacktman Focused 22 5 1 1 3 2 1 2 5 5
Invesco S&P 500 Low Volatility ETF 8 5 1 1 1 1 1 1 5 5
FAM Equity-Income 23 5 3 3 2 2 2 3 5 4
Fidelity Advisor Series Growth Opportunities 5 5 1 5 4 2 2 3 5 5

In each case, the values represent the performance of the fund since its inception. Since being splendid for a long time is even harder than being splendid for a while, we highlight each fund’s age. In all cases, blue represents the best possible rating, green is second best and so on down to red.

What do the columns mean? APR is “annual percentage return,” so blue is the top 20% of its peer group since inception. Max DD is “maximum drawdown,” so blue is in the 20% of peer funds with the smallest worst-case performance. Recov is “time to recover from your max DD,” standard deviation is a measure of “normal” volatility, DownSide deviation is a measure of a fund’s tendency to move downward, the Ulcer Index combines measures of how far a fund falls and how long it stays down, bear is a fund’s normal performance in bear market months, Sharpe is a very common measure of a fund’s risk-return performance and MFO is a variation of Sharpe that strongly rewards funds that hold up well in volatile markets.

These are just the comparative rank data (top 20%, top 40% and so on). If you’re geeky enough to want to work with the raw data as well, that’s all in the screener at MFO Premium. For our immediate purpose, the relative performance was the relevant part.

Here’s the takeaway: the funds’ short-term resilience seems to reflect their long-term prospects. The funds that excelled in the fall and winter have also excelled, with some consistency and across a variety of measures, since their inception.

Where do we go from here?

If you’re intrigued and have access, “to MFO Premium,” go there and recreate the search string so you can see the full details rather than my quick summary. If you’re intrigued but haven’t sought access to Premium, here are the highlights of resilient funds and ETFs in a variety of categories.

Zero is not my hero! All equity funds and ETFs with a Sharpe ratio above zero

State Street SPDR SSGA US Large Cap Low Volatility Index ETF LGLV Multi-Cap Core
T Rowe Price Capital Appreciation PRWCX Growth allocation
Legg Mason Low Volatility High Dividend ETF LVHD Multi-Cap Value
Madison Dividend Income BHBFX Equity Income
Invesco DJIA Dividend ETF DJD Equity Income
Fidelity Advisor Multi-Asset Income FAYZX Flexible Portfolio
BMO Low Volatility Equity MLVEX Multi-Cap Value
BlackRock iShares Edge MSCI Min Vol USA ETF USMV Multi-Cap Core
Nuance Mid Cap Value NMVLX Mid-Cap Core
MFS Low Volatility Equity MLVAX Multi-Cap Core
Fidelity SAI US Low Volatility Index FSUVX Multi-Cap Core
Vanguard Wellesley Income VWINX Conservative allocation
TCW New America Premier Equities TGUSX Multi-Cap Growth
First Trust Value Line Dividend Index FVD Multi-Cap Value
Invesco S&P MidCap Low Volatility ETF XMLV Mid-Cap Core
Champlain Mid Cap CIPMX Mid-Cap Growth
Virtus KAR Small-Cap Growth PXSGX Small-Cap Growth
Jackson Square SMID-Cap Growth DCGTX Small-Cap Growth
T Rowe Price Dividend Growth PRDGX Large-Cap Core
Jensen Quality Growth JENSX Large-Cap Core
YCG Enhanced YCGEX Large-Cap Core
State Street SPDR Portfolio S&P 500 High Dividend ETF SPYD Equity Income
AMG River Road Focused Absolute Value AFAVX Multi-Cap Value
ProShares Russell 2000 Dividend Growers ETF SMDV Small-Cap Core

The small standing tall: the top five small cap funds

Citizens of the World: The Top Five Global Funds

Beyond these shares: the top five international funds

… or maybe a few more.

Striking a healthy balance: the top five balanced funds

… yes, I know. Think of it as an Easter Egg.

On the other hand: the top ten alternatives funds

The rewards of virtue: the top ten ESG funds

A socially responsible money market. Who knew?

Passively active: the top ten active ETFs

Brand or Generic?

By Edward A. Studzinski

The Romans had a maxim, “Shorten your weapons and lengthen your frontiers.” But our maxim seems to be, “Diminish your weapons and increase your obligations.” Aye, and diminish the weapons of your friends.

Winston S. Churchill, speech to the House of Commons, 14 March 1934

There has been a lot of discussion in recent months about the Kraft Heinz debacle. Much of it is around the assumptions by Warren Buffett that consumers would return to their habits of forty or fifty years ago and purchase Heinz ketchup, mustard, or relish to slather on their hot dogs and hamburgers. As demographics, consumer tastes, and spending habits have changed, we are as likely to see condiments such as chutney, fish sauce or sriracha sauce used as often as not. And if there are brands involved, they are as often as not transnational rather than American. Often as well, they are private label.

Recently I was in New York, having dinner with a fund manager. The discussion was around his efforts to come up with new product and build-out his brand. He indicated that people like him have a choice. They could either have a product (fund) built around a star manager, who in effect becomes the brand. Alternatively, rather than being built around a star manager, the various funds (products) are built around a process. On the one hand you are building a business, the foundation of which is built on a guru. Alternatively, you are building the business and products on a process, where no one individual is essential to the investment selection, execution, and returns.

Fidelity built its reputation on star managers – a Peter Lynch, a George Noble, a Beth Terrana – all of whom were superb managers. The problem came when they elected to retire or move on to other things. Now, with a few exceptions, Fidelity builds its products around process and a very talented group of managers and analysts. Marketing campaigns are not built around individuals. Vanguard had a similar problem when its reputation as an active manager was tied to John Neff at Windsor Fund (1964-1995). Then Neff’s performance went cold and he ultimately retired. Which resulted in problems, problems, and problems. Vanguard has solved the problem with a slew of low cost index funds. Their active funds generally divide portfolio management among two or more firms. It is impossible from the outside to come up with performance attribution for the different managers. You have no way of knowing whether the group of managers are additive, offset one another, or all have negative performance.

As is generally true with branded consumer products, branded index funds such as Fidelity’s or Vanguard’s, although generic products, are not going to have the firm names on them if they are crap. There are standards that will be met, as to back office, trading, and reporting. You will get something that in terms of process you can rely on, especially given that there will be no skimping that would cause reputational risk.

The issue these days comes with actively managed funds. What does it really cost to manage a fund? What does the research cost to perform, especially if you hold yourself out as only doing your own research? Does it cost more to research and invest for an international or emerging markets fund? Do the reporting, currency, compliance, and tax questions cost more? And here is where the 3G – Kraft Heinz analogy comes into play. Where do you take out costs as an active manager to remain competitive in fees and expense ratios? How do you deal with personnel costs? Do you take a Money Ball approach a la Michael Lewis’ book about the Oakland Athletics and turn over personnel regularly to bring costs down? Or is there a chemistry among people that makes a difference?

It is hard to figure that out from the outside. Years ago, after they had been acquired by Franklin, a former analyst at Mutual Shares explained to me that the firm kept tweaking analyst personnel to see if (a) it made a difference in performance and (b) the outside world would notice. You may draw your own conclusions at this point, but I would also suggest that generational shifts would have ultimately made a difference regardless.

I really don’t have an answer to these questions, but I think they are worth thinking about, both for individuals and for institutional investors. For individuals, unless there is some thrill of the chase that you live for (and do not put a money value on your time), researching active managers may prove both cathartic and possibly rewarding. For those not so inclined, especially for 401(k) or other retirement moneys where you should make the investment and leave it alone to compound, given a ten year or more time horizon, a product such as the Vanguard Balanced Index Fund, with its automatic rebalancing and quarterly income distributions may make the most sense from a cost and efficiency point of view. Alternatively, especially since life expectancy in this country keeps lengthening, eschew the target date funds and find a relatively low cost, actively managed balanced fund such as Dodge and Cox Balanced, where you have a real (as opposed to make believe) equity research team and managers, and a real (also as opposed to make believe) fixed income research team and managers. And avoid fund groups that are subsidiaries of large asset gathering organizations.

And understand something that is too often not emphasized enough. Or it is glossed over. Your mutual fund manager and his firm are in business to make money, first for themselves. The fund is a product. You are the consumers. As consumers, you should feel free to pull your money and go elsewhere if the product changes in ways you don’t understand, is cheapened, or does not meet your goals, objectives, and expectations. Loyalty is not a two-way street in the investment world. It is strictly buyer beware.

ETFs and the fine art of propaganda

By David Snowball

I teach about propaganda and persuasion for a living. “Propaganda” in the Hitler, Goebbels, rise of the Nazis sense of the term. It’s an important and fascinating study, though it seems reasonably tangential to contemporary investing.

Then I started reading about ETF marketing.

The Institute for Propaganda Analysis, 1937-1942, was an honest attempt to help American citizens detect and dissect trickery and deceptive messages. They were, then as now, rife. The Institute’s most famous publication was The Fine Art of Propaganda (1939) which offered a “candid and impartial study of the devices and apparent objectives of specialists in the distortion of public opinions.” They devoted a chapter to each of seven tricks:

  • Name-calling
  • Glittering generalities
  • Transfer
  • Testimonial
  • Plain folks
  • Card stacking
  • Bandwagon

That last one, the bandwagon, “is a means for making us follow the crowd and accept a propagandist’s program as a whole and without examining the evidence for and against it. His theme is: ‘Everybody’s doing it. Why not you?’ His techniques range from the street-corner medicine show to those of the vast pageant” (105).

So here’s the propagandist’s tale: “passively-managed ETFs are taking over the world. The only fools who invest in futile attempts by active managers to beat the market are old men in frock coats and gardenia-scented spinsters!” Those are buttressed by analyses showing the passive strategies will control over half the markets assets by mid-2019.

But why?

Excellent question! My skepticism about passive cap-weighted or debt-weighted index investing, especially through ETFs, has had three sources:

  1. it incorrectly focuses on “market beating returns,” which is misleading since my investment goal isn’t to beat the market. It’s to fund a comfortable existence, which market-beating returns might or might not achieve.
  2. cap-weighted strategies tend to thrive in rising markets, and virtually the entire period of ETF ascent has been during a 10+ year bull market.
  3. it might ultimately undermine the ability of the market to manage major downturns by draining liquidity; that is, ETFs hold no cash reserves to deploy during downturns which risks fostering algorithm-fed downward spirals.

Many, including many who market ETFs, disagree.

A series of recent reports suggest that marketers might be consciously gaming the system to generate a self-sustaining bandwagon effect. Take the case of one of the most explosive ETF launches ever … a JPMorgan Japan fund?

The Invesco QQQ Trust (QQQ) was the ETF to capture the largest inflows this week―$1.2 billion―but the week belonged to another fund, the JPMorgan BetaBuilders Japan ETF (BBJP). Inflows for BBJP totaled more than $1 billion during the period, which is remarkable considering the fund had less than $10 million in assets a little over a week ago. (‘BBJP’ 2nd-Fastest ETF To $1B Assets, 28 July 2018)

How can you explain a billion dollars swooping in over the course of a week? A carefully constructed bandwagon and, it seems, just one of many. Asjylyn Loder of The Wall Street Journal reports:

JPMorgan Chase & Co. launched an exchange-traded fund last June that invests in Japanese stocks. The fund raised $1.7 billion in six weeks, making it one of the fastest ETFs ever to surpass $1 billion in assets.

The biggest buyers: JPMorgan’s clients.

By buying JPMorgan’s ETFs on behalf of customers, JPMorgan’s private bank and wealth management divisions helped the JPMorgan BetaBuilders Japan reach $3.3 billion in assets by the end of the year.

It wasn’t an isolated case. JPMorgan’s ETFs raised $15.6 billion last year, most of it from JPMorgan affiliates … The tide of client money helped boost the New York bank from an ETF also-ran to the 10th largest ETF issuer. By the end of 2018, JPMorgan affiliates owned 53% of the firm’s ETF assets, and the bank was the top shareholder of 23 of its 31 ETFs.

JPMorgan isn’t the only ETF issuer that steers clients into in-house funds. Almost every issuer has repackaged some of their ETFs into other investment products … The practice has even earned its own nickname: BYOA, for “Bring Your Own Assets.” (JPMorgan ETFs Are a Hit, but With Its Own Clients, 11 March 2019 – with thanks to Ms. Loder for her excellent reporting and Ted, the MFO discussion board’s senior member, for urging us to highlight it)

That essentially corroborates the investigative work done by Elizabeth Kashner at ETF.com. In “Tough Times for New ETFs” (2/21/2019), she makes two interesting points: ETF liquidations are rising steadily and almost no new ETF launches lead to sustainable asset levels. In general, the only ETFs make serious money are the ETFs that are used in the portfolios of other funds. Beyond that, for all the hype and pageantry, it looks like the market has peaked.

Major investors have reached the same conclusion, even if most small investors are still in thrall to the call of “the winning team.” Ira Artman, longtime friend of MFO, shared the conclusions of “Fidelity’s annual global institutional investor survey … over the next six years institutional investors expect to shift their portfolios toward more active strategies and smart beta products — all at the expense of traditional passive. The survey includes responses from 905 institutional investors in 25 countries” (“The Traditional Passive Fund is a Dying Species,” 18 March 2019).

Bottom line: the argument “but everyone’s doing it!” is the hallmark of the reasoning of a petulant, hormonally-imbalanced teen. That’s not really a good reason to use the same logic to drive your investment decisions, is it? And yet, it works. It worked for demagogues in the 1930s. It works for convincing people to read, usually the first chapter of, mediocre nonsense (a New York Times bestseller!) And it drives marketing money on the web, where popular seven-year-olds can claim a $20 million payday because everybody who’s anybody is watching them.

“ETFs are winning” is not a reason to buy ETFs, especially when “winning” is just a synonym for “attracting money.” The hallmarks of good investments are that they meet your needs, make sense in your world and will serve you in good times and bad. Very few active funds bear those hallmarks, and very few ETFs do.

Caution is especially warranted when the bandwagon rolls into town with hype and hoopla and cheering crowds. That’s often a good signal to put your hand securely over your wallet and move quietly toward an exit.

Next month MFO will, by the way, highlight actively-managed ETFs that have the greatest record of strong, consistent achievement. Do drop by.

Introducing MFO Premium’s Compare Funds Tool

By Charles Boccadoro

The Compare Funds tool displays all the data from MultiSearch Results table, our main search tool on the MFO Premium site, for up to 10 funds in an easy-to-compare and export/pdf format. Basically, it transposes the table from horizontal to vertical orientation. Thanks to our friends at Gaia Capital Management for requesting this display feature.

We use the Oakmark fund family to illustrate. Here’s summary only risk and return metrics across the current full market cycle through February.

Pressing the Compare button delivers the transposed table, as illustrated below:

Here’s a link to a pdf of the full Compare table, summarizing 200 parameters currently output in the MultiSearch tool.

Finding ESG Fund One

By David Snowball

By Morningstar’s calculation, there are 486 “socially-conscious” funds.  While bond and mixed-asset funds can be “socially-conscious,” Morningstar does not rate the sustainability of their portfolios. If you subtract the 183 funds in those categories, you’re left with 303 “socially-conscious” equity funds. Only 93 (or 31%) have portfolios that score “high” on Morningstar’s sustainability ratings while 101 more are “above average,” so about two-thirds of ESG funds earn good-to-great sustainability scores.

At the other end of the spectrum, 18 (about 6%, including one with “environmental” in the name) have the lowest-possible sustainability rating.

MFO, which draws its data from Refinitiv (formerly Thomsen-Reuters, formerly Lipper), can identify 339 “socially-conscious” funds and ETFs, combined. In either case, ESG-conscious investors have a wealth – and possibly a welter – of choices to contend with.

To help create a more manageable short list of ESG funds that might be worth consideration, we combined three datasets and two sets of measurements to identify 27 first-tier options for you.

Screen one: we looked for “socially conscious” funds in both the Morningstar and MFO datasets.

Screen two: we selected funds with strong risk-adjusted returns. Those were defined as funds that have an MFO rating of 5 for risk-adjusted performance (and noted the Great Owl funds, GO on the table, which have been incredibly persistent outperformers) or a Morningstar rating of four- or five-stars (and noted the presence of a positive analyst rating).

Screen three: we selected funds with the most promising records of environmentally sustainable investments by looking at their Morningstar sustainability ratings and the Fossil Free Funds badges.

Then we added three bits of important information: age (since excellence over long periods is especially notable), expenses and fund size. To make it easy to scan, we color-coded each cell with blue for the highest score, green for second and so on. Finally, we sorted the table by score. Brown Advisory ranks first with 20 of a possible 20 points, Calvert is second with 19 of 20 and so on.

Remember: these are all really solid performers, whether at the top of the table or at the bottom of it. Our basic starting point for inclusion was outstanding risk-adjusted returns. 

Three important notes to help you interpret the table:

  1. The ranking is most sensitive to the “E” in “ESG.” That might not align with your interests if, for example, you’re intensely motivated to find firms that treat their employees with respect.
  2. Environmentally sensitive funds without an explicit ESG mandate are missing. If we keyed off the fund’s Morningstar sustainability rating, which is based on a portfolio analysis rather than on the prospectus language, interesting opportunities are added. The funds below don’t invoke “the trigger words” but act responsibly and perform splendidly.
    MFO M* stars M* sust Age ER AUM -$M
Champlain Mid Cap (CIPMX) Mid growth 5 + GO 5 + Gold 5 11 1.05 3.1 billion
Buffalo International (BUFIX) Int’l multi growth 5 + GO 5 5 11 1.05 325
Monongahela All Cap Value (MCMVX) Multi value 5 5 5 6 0.87 12
FAM Equity-income (FAMEX) Mid growth 5 + GO 5 4 23 1.26 283
Harding Loevner EM (HLMEX) EM 5 4 + Silver 5 20 1.40 3.8 billion
Crawford Dividend Opp (CDOFX) Small core, dividend focused 4 5 5 6 1.05 214
Seafarer Overseas Gr & Income (SIGIX) EM 5 3 + Silver 5 7 0.87 1.5 billion
Dreyfus Total EM (DTEIX) EM balanced 4 5 4 8 1.30 28

Dreyfus just announced plans to liquidate DTEIX on May 20, 2019, because producing twice your peers’ returns with 80% of their volatility just isn’t sexy enough for investors.

  1. Many fine socially-conscious funds fall just outside of our performance metrics. Remember, we targeted funds with a “5” from MFO (top 20% risk-adjusted returns since inception) and a “4” or “5” from Morningstar. Of necessity, some entirely credible ESG funds live just outside that fence. Here are two examples.
    MFO M* stars M* sust Age ER AUM -$M
Trillium P21 Global Equity (PORTX) Global large 4 4 5 20 1.29 511
Northern Global Sustainability Index (NSRIX) Int’l large 4 3 4 11 0.30 640

Bottom line: there’s a good chance that ESG investors will stumble when they first encounter the number and diversity of ESG funds and ETFs. That problem is deepened by the short track record for many of these funds (51 have launched in just the past two years) and the apparent differences in their goals and methods (do you even know whether you’d want a fund with the word “impact” in the name?). That leads to a decision phenomenon (perhaps an indecision phenomenon) known as choice overload. Having too many approximately equally good options is mentally draining, especially when the choices feel significant and time is limited. In such cases, we tend to freeze or make impulsive “let’s pick any one and get it over” choices.

It doesn’t have to be hard. Remember that, first and foremost, you want an investment that produces reasonable returns while creating risks you can live with. After that, you want funds that either broadly address ESG issues or that (as with the Workplace Equality or Eco Leaders fund) specialize in an set of issues which are particularly important to you. After that, it’s just a matter of starting small, investing regularly and keeping, so to speak, the faith.

Brown Advisory Sustainable Growth Fund (BAFWX/BIAWX/BAWAX), April 2019

By David Snowball

Objective and strategy

The managers seek long-term capital appreciation by investing in a concentrated portfolio of 30-40 mid and large capitalization companies that use sustainable business strategies (SBA) to drive future earnings growth.

They focus on finding companies whose sustainability strategies are generating tangible business results such as revenue growth, cost improvement, or enhanced franchise value. Such companies may enjoy competitive advantages from environmentally efficient design or manufacturing or offer products or services that address sustainability challenges.

Sustainable business advantage analysis complements thorough fundamental research and a strict valuation discipline. Only companies with strong fundamental, sustainable, and valuation characteristics are considered for investment.

Adviser

Brown Advisory, a private independent investment management firm founded in 1993 in Baltimore within Alex Brown & Sons. The firm employs 600 people in eight offices, manages 15 mutual funds, is a sub-adviser on four others, and runs 29 additional investment strategies. Total firm AUM as of September 30, 2018: $68.4B with $8.7 billion of that in their mutual funds.

Managers

Karina Funk and David Powell. Ms. Funk, CFA, joined Brown Advisory in 2009 from Winslow Management Company where she was a Portfolio Manager and Equity Research Analyst running an ESG- focused equity mutual fund. Brown acquired Winslow in 2012. Her academic credentials are in chemical and environmental engineering from first-tier universities in the US and France. Mr. Powell joined Brown Advisory in 1999 as an equity research analyst. Prior to joining the firm, David held a position in investor relations at T. Rowe Price. They are supported by three equity analysts.

Strategy capacity and closure

In the neighborhood of $15 billion, which is not excessive for a global, large cap strategy. Total AUM in the strategy (mutual funds, a UCITS European mutual fund, and separate accounts) was approximately $1.8B as of September 30, 2018.

Management’s stake in the fund

As of June 30, 2018, Ms. Funk owns between $100,000-500,000 of the fund and Mr. Powell over $1,000,000. As of December 31, 2017, only one of the four independent trustees had a personal investment in the fund.

Opening date

June 29, 2012 and an SMA from December 31, 2009. The PMs manage these products exclusively.

Minimum investment

Institutional Shares $1,000,000; Investor and Advisor Shares $100.

BAWFX is available for purchase through 34 brokerages, including major platforms such as JPMorgan, TD Ameritrade, Vanguard, Fidelity, and Schwab.

BIAWX is available for purchase through 33 brokerages, including major platforms such as JPMorgan, Merrill, TD Ameritrade, Vanguard, Fidelity, and Schwab.

BAWAX available for purchase through 37 brokerages, including major platforms such as JPMorgan, TD Ameritrade, Vanguard, Fidelity, and Schwab

Expense ratio

Institutional 0.63%; Investor 0.78%; Advisor 1.03%. Assets under management is $7.2 Billion. 

Comments

The environmental and business cases for incorporating ESG factors into your portfolio are unassailable. It is very clear that the behavior of corporations contributes directly, for good or ill, to the habitability of the planet. It’s equally clear that investing in sustainable enterprises does not harm your returns, and might well bolster them. Larry Fink, president of BlackRock, the world’s largest investment firm, argues that within five years “all investors will be using ESG (environmental, social, governance) metrics to determine the value of a company.” That’s perfectly rational. An October 2018 review of the research by the Boston Consulting Group concludes that “ESG-driven decisions implemented well go far beyond good marketing, and actually boost the bottom line because they are more sustainable than decisions made to boost stock price in the short term” (Business Insider,  11/1/2018). That aligns well with both the research done by the Brown Advisory managers and with their performance.

The way to make money on companies with great ESG characteristics is to invest first in fundamentally strong companies that will outperform over time. So they look at their return on equity, earnings variability, historical earnings per share growth plus other factors.

Once they identify these companies, they can begin looking more deeply into whether a company’s management team understands its long-term sustainability risks and opportunities and is investing in them materially.

They use the term “sustainable business advantage,” or SBA, to describe the characteristics in a company’s business strategy that can add shareholder value through sustainability. Companies with great fundamentals and the potential to propel those outcomes through SBA are the companies they want to own.

It’s this intersection of company performance and ESG focus that defines sustainable investing for these managers.

On whole, the managers worry rather more about producing alpha, i.e., market-independent returns, than they do about managing beta, also known as market risk. Even so, the fund tends to generate below average volatility across time and across a variety of measures.

The fund does exceptionally well, against any plausible benchmark, over time. We first screened Lipper’s Socially Conscious (SC) category for U.S., global, and international multicap growth.

  BAWFX
One year 13.4%, 2nd
Two year 19.4%, 1st
Three year 20.3%, 1st
Five year 13.9%, 1st

Our second screen broadened the search to include all multicap growth funds, domestic, global or international, socially conscious or not. The results remain impressive.

Second, we looked at the fund’s performance relative to the S&P 500 and its benchmark index, the Russell 1000 Growth. The S&P is a flawed comparison because the investment styles are substantially different, but a relevant one because so many investors use the S&P as their implicit benchmark for any equity investment. The Russell 1000 Growth is pretty spot-on.

  BAWFX beat the S&P 500 by … BAWFX beat its benchmark Russell 1000 Growth by
One year 8.7% 6.1%
Three year 5.0% 1.1%
Five year 3.2% 0.8%
Since inception 3.2% 0.9%

The managers admit that they will underperform the market at times. The Russell 1000 Growth Index has been red hot for the past decade, averaging an annual return of 18.2%. The PMs looks for steady, not rapid growth. Now in the tenth year of a bull market, they are careful to avoid chasing momentum-led stories. That’s produced a nice asymmetry in which they capture most of their benchmark’s upside but much less of its downside.

Bottom Line

  1. The mangers make money. With an 18.0% lifetime APR, BAFWX is an MFO Great Owl in the multicap growth category. That means it has consistently received a return rank of 5 (Best) for all periods three years and longer. It joins only nine other GO funds in that category. Investors have not sacrificed returns or experienced a tradeoff from using ESG characteristics in the portfolio.
  2. The managers are smart, careful, and even cynical. Just because a company issues a sustainability report, doesn’t mean that it’s added value. They’re only interested in companies that make an ESG impact. Their legacy and reputation is based on repeatedly finding companies that hinge on sustainable growth drivers well before the rest of the market catches up.
  3. The managers’ strategy is different. They don’t use ESG to find companies that they believe are less harmful than others. They don’t invest passively though a best-in-class approach aiming to find the best “scorers” in each industry trying to match the risks and returns of the broad market and therefore unlikely to outperform their benchmark.

They can earn a profit and help the planet — as has the fund — while ESG continues to move consistently to the center of corporate thinking on strategy, risk, reputation, operations, efficiency, and long-term performance.

Fund Website

Sustainable Growth Fund

Karina Funk Sustainability TED Talk

Funds in registration

By David Snowball

Before funds and ETFs can be offered to the public, they’ve got to be submitted to the SEC which has 70 days to review the application. In general, advisers try to launch just before year’s end because that allows them to have clean “year to date” and calendar year results to share. These launches will likely occur in late May or June so that they’ll at least have full-quarter results for 2019 Q3.

The team behind Harbor Focused International has been recognized as one of the best asset managers in Europe, while the advisers behind DoubleLine Emerging Markets Local Currency Bond Fund and Vanguard Global ESG Select Stock Fund are among the best in US fixed income and equity investing, respectively. And yet, the Kensington Managed Income Fund might have the best underlying performance of them all. That makes it a good month.

Aegon Short Duration High Yield Fund

Aegon Short Duration High Yield Fund will seek a high level of current income. The plan is to invest in high yield securities, including those in default, with an average weighted portfolio duration of 36 months or less. The portfolio will be invested primarily in corporate bonds but might also hold foreign sovereign debt, bank loans and convertible securities. They also apply an ESG screen. The fund will be managed by a team from Aegon USA Investment Management, LLC. Aegon is a global investment manager with $330 billion in assets and offices in … Cedar Rapids, Iowa? Potential investors will want to review a substantial discussion, contained in the prospectus of SEC actions against the advisor. Its opening expense ratio is 0.95% after waivers, and the minimum initial investment will be $2,000.

Aegon Emerging Markets Debt Fund

Aegon Emerging Markets Debt Fund will seek to maximize total return, consisting of income and capital appreciation. The plan is to invest in “all varieties” of EM fixed income securities, including derivatives and exchange-traded funds. “All varieties” is both “all types” and “all maturity, duration and credit qualities.” They may hedge various portfolio risks and also apply an ESG screen. The fund will be managed by a team from Aegon USA Investment Management, LLC. Aegon is a global investment manager with $330 billion in assets and offices in Cedar Rapids, Iowa. Potential investors will want to review a substantial discussion, contained in the prospectus of SEC actions against the advisor. Its opening expense ratio is 1.00% after waivers, and the minimum initial investment will be $2,000.

AGFiQ Dynamic Hedged U.S. Equity ETF

AGFiQ Dynamic Hedged U.S. Equity ETF, an actively-managed ETF, seeks long-term capital appreciation with lower than market volatility. The plan is to use a multi-factor quantitative model to make sector bets within the S&P 500. They’ll hedge market risk by investing, to a greater or less extent, in the AGFiQ U.S. Market Neutral Anti-Beta Fund (BTAL) and cash equivalents. BTAL is a surprisingly volatile fund (it has lost money in four of the seven years of its existence, but made 15% in 2018) so one rather hopes its use will be exceedingly judicious.The fund will be managed by a team from FFCM LLC, Boston-based smart-beta / factor-based investors that AGF bought last year. Its opening expense ratio has not been disclosed.

AGFiQ Global Infrastructure ETF

AGFiQ Global Infrastructure ETF, an actively-managed ETF, seeks long-term capital appreciation. The plan is to use a multi-factor quantitative model to screen for growth, value, quality and risk characteristics. As a risk management measure, the portfolio will have constraints on country, industry, group, sector and individual security concentrations. The fund will be managed by a team from FFCM LLC, Boston-based smart-beta / factor-based investors that AGF bought last year. Its opening expense ratio has not been disclosed.

CIBC Atlas International Growth Fund

CIBC Atlas International Growth Fund will seek long-term capital appreciation. The plan is to invest in 40-70 stocks that have superior quality and growth characteristics. As part of the risk management strategy, stocks are placed into one of three baskets (Quality Compounders, Emerging Growth, Risk Mitigators), with the implication that the portfolio might systematically favor one basket over another at various points. The fund will be managed by Daniel Delany and Matthew Scherer of CIBC Private Wealth Advisors. The current prospectus includes the record of the underlying strategy since 2008. The cumulative data and 2018 performance are missing but the general pattern suggests this is a fairly high volatility approach. Its opening expense ratio is 1.56%, and the minimum initial investment will be $3,000.

DoubleLine Emerging Markets Local Currency Bond Fund

DoubleLine Emerging Markets Local Currency Bond Fund will seek high total return from income and capital appreciation. The plan is to invest in pretty much in any attractively valued IOUs (here’s their text: “The Adviser interprets the term ‘bond’ broadly as an instrument or security evidencing what is commonly referred to as an IOU”) in any EM country, with due cautiousness. The fund will be managed by a large team from DoubleLine. Its opening expense ratio has not been disclosed, and the minimum initial investment for “N” shares will be $2,000.

Harbor Focused International Fund

Harbor Focused International Fund will seek long-term growth of capital. The plan is to use pretty rigorous, pretty traditional fundamental analysis to select 25-40 blue chips which they anticipate holding for 3-5 years on average. The fund will be managed by a team from the French firm Comgest Asset Management International. Comgest has over $30 billion in assets and a bunch of “best asset manager in Europe” awards. It appears that this will be its first product for US investors. Its opening expense ratio is 1.22%, and the minimum initial investment will be $2,500.

Homestead Intermediate Bond Fund

Homestead Intermediate Bond Fund will seek high level of current income consistent with preservation. The plan is to create a sort of go-anywhere, do-anything portfolio that looks for opportunities globally, in a wide array of fixed-income securities, while maintaining due caution about risk. The fund will be managed by Mauricio Agudelo and Ivan Naranjo, both of RE Advisers which is Homestead’s parent. They’re an awfully trustworthy bunch. Its opening expense ratio has not yet been disclosed, and the minimum initial investment will be $500.

HSBC Ultra Short Bond Fund

HSBC Ultra Short Bond Fund will seek current income consistent with the preservation of capital. The plan is to build a global (including EM) portfolio of investment grade fixed income securities. It will normally maintain a dollar-weighted average maturity of up to 1.5 years and a dollar-weighted average effective duration of up to 0.50 years. The fund will be managed by Jason Moshos of HSBC Global. Its opening expense ratio is 0.20%, and the minimum initial investment for “A” shares will be $1,000. Despite the “A” designation, the shares are no-load and carry the same expense ratio as the “I” shares. Curious.

Kensington Managed Income Fund

Kensington Managed Income Fund will seek “income.” The plan is to construct a fund of income funds with a portfolio that might be tweaked daily. The fund will be managed by Bruce P. DeLaurentis of Advisors Preferred, LLC. Mr. DeLaurentis entered the asset management business in 1984 after serving for 20 years in the US armed forces. Over the past decade, Mr. DeLaurentis’s strategy, manifested in separately managed accounts, has returned an average of 10.1% annually while the Barclays bond aggregate returned 3.5%. Its opening expense ratio is 2.97% and “A” shares nominally carry at 4.75% fee, which seems like a near-fatal combination. The minimum initial investment  will be $1,000.

MainStay MacKay Intermediate Tax Free Bond Fund

MainStay MacKay Intermediate Tax Free Bond Fund will seek current income exempt from regular federal income tax. The plan is to invest in muni bonds (duh); the portfolio’s weighted average duration will range from 3-10 years. Some of the portfolio might be non-investment-grade debt. The fund will be managed by a quite large team from MacKay Shields. Its opening expense ratio has not been disclosed, and the minimum initial investment will be $1,000.

Vanguard Global ESG Select Stock Fund

Vanguard Global ESG Select Stock Fund will seek to maximize returns while having greater exposure to companies with attractive environmental, social, and governance characteristics. The plan is to start by looking for firms with a proven track record of effective capital allocation, leading ESG practices and a wide and sustainable gap between return on capital and cost of capital. They’ll then look at a series of secondary screens (employee engagement, corporate culture, adaptability) before constructing the portfolio. The fund will be managed by Mark Mandel and Yolanda Courtines of Wellington Management. Its opening expense ratio is 0.55% and the minimum initial investment will be $3000.

Wells Fargo Special International Small Cap Fund

Wells Fargo Special International Small Cap Fund will seek long-term capital appreciation. The plan is to build a diversified portfolio of firms which are “well managed, have flexible balance sheets and sustainable cash flows, and that are undervalued companies relative to an assessment of their intrinsic value.” They don’t generally hedge currency exposure. The fund will be managed by a team from Wells Capital Management. The team has been running this strategy in separately managed accounts for about five years. Since inception, the SMA composite has outperformed its benchmark by about 160 bps/year, with a really substantial advantage in 2018 when the composite fell 12% and its benchmark declined by 18%. Its opening expense ratio is 0.95%, and the minimum initial investment will be $1 million but there is broad waiver language for brokerages, 529 plans, retirement plans and so on.