


In this third of a six part series on the Six Rules of Investing, I look at risks and the ability of the investment environment to withstand shocks. This article is divided into four sections: 1) The Investment Environment, 2) Looking for the “Known Unknown” Risks, 3) Investment Strategy For Uncertain Times, and 4) Funds for Uncertain Times.
In February 2002, Donald Rumsfeld, the then US Secretary of State for Defense, stated at a Defense Department briefing: “There are known knowns. There are things we know that we know. There are known unknowns. That is to say, there are things that we now know we don’t know. But there are also unknown unknowns. There are things we do not know we don’t know.”
Donald Rumsfeld, US Secretary of State for Defense
It is easy to identify risks leading to recessions after they have occurred, but each recession is different. Nassim Nicholas Taleb, author of The Black Swan (2007), criticized the risk management techniques of the financial industry in the book and warned about the coming financial crisis. According to Wikipedia, Dr. Taleb “advocates what he calls a ‘black swan robust’ society, meaning a society that can withstand difficult-to-predict events.”
Many of these risks are known by some people, who often point them out ahead of time. In this article, I look for the lesser known risks or risks with uncertain consequences that corporate executives, economic organizations, and investment managers are currently raising.
The Investment Environment
A mortgage loan officer told me in 2007 that a financial crisis was coming and it was going to be bigger than people had ever seen. At the time, subprime loans were not mainstream in the financial media. I researched what he told me and shifted my 100% stock portfolio to 40% stocks. The experience shifted my philosophy from “buy and hold” to managing risk according to the business cycle. I have since read dozens of books on economic and financial forecasting, statistics, investing history, and portfolio management.
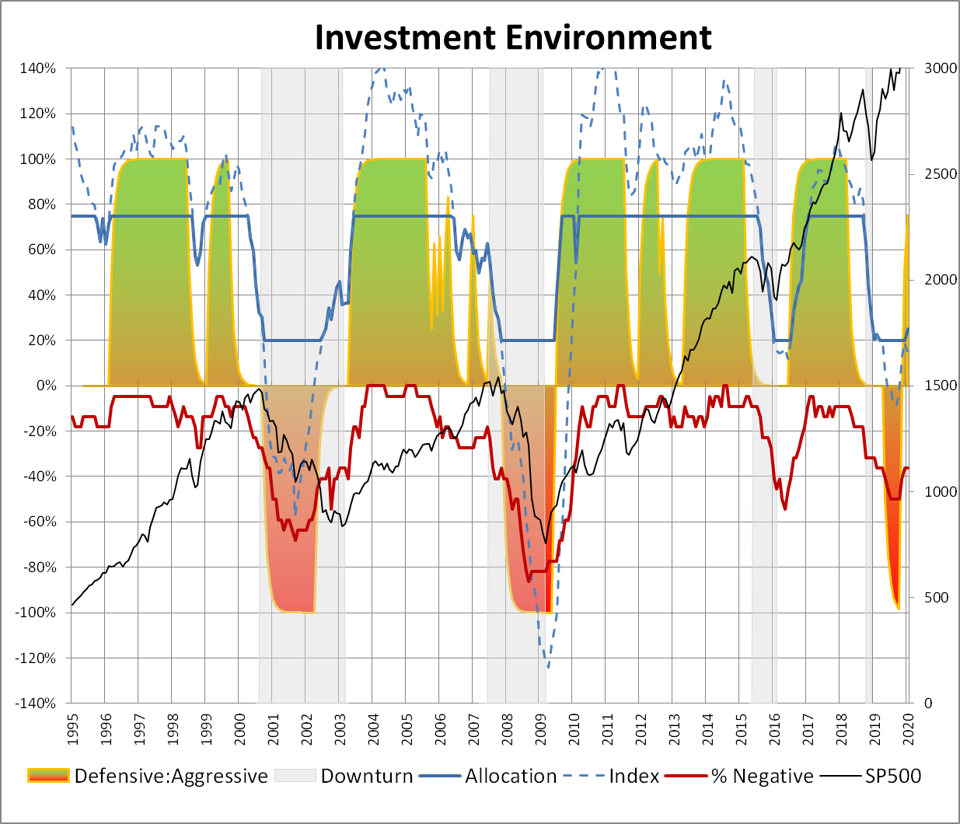
Chart #1 is the Investment Model which is intended to maximize return of $100 invested in January 1995 by adjusting allocations based on the business cycle. I roughly follow Benjamin Graham’s guidelines of never having less than 25% invested in stocks and never more than 75%. The dashed blue line is the index underlying the Allocation Index before a 20% and 75% cap are applied. It shows improvement in the Investment Environment since September 2019. The Allocation Index (blue) is now at 25% stocks. The red line is the percent of indicators that are negative showing there is some improvement. The Investment Model estimates that risks are high, but the investment environment is improving so continue being cautious.
Chart #1: Investment Model
Source: Author
The Investment Model attempts to take into account the “known knowns” of risk such as financial stress, yield curve, high yield bond spreads, percentage of banks tightening lending standards, margin debt (leverage), inflation, recession probability, volatility, profit growth, economic policy uncertainty, and valuation. What it does not do is take into account many of the “known unknowns” which occur less frequently and are harder to measure.
Looking for the “Known Unknown” Risks
In this section, I list the major risks and concerns from a number of sources. As investors, we don’t need to run for the hills, but we need to recognize that this decade has many risks that were deferred from the global financial crisis or are exasperated by it.
1. Recession risk
The risk of recession has diminished but not been eliminated. According to CEOs: Recession Biggest Business Risk in 2020, recession is now classified as the major risk by corporate executives both domestically and globally:
-
- US: For US CEOs, a recession rose from being their 3rd biggest concern in 2019 to their top one in 2020… For two years in a row, US CEOs cite the issue [increased competition] as their 2nd top external worry… It [trade uncertainty] ranks as the 4th biggest worry of US CEOs, tied with its affiliate issue: global political instability.
- Global: For the 2nd year in a row, CEOs and other C-Suite executives globally rank a recession as their top external worry in the year ahead… CEOs globally rank uncertainty about global trade as their 2nd biggest external worry in 2020… For CEOs globally, fiercer competition rose from being their 4th top external worry in 2019 to their 3rd in 2020.
CEOs: Recession Biggest Business Risk in 2020, Newsmax finance
One of the concerns over recessions is expressed well by Joachim Fels and Andrew Balls at PIMCO which is with interest rates already low there are fewer tools in the toolbox to fight the next recession:
Yet again, the Fed and other major central banks have helped to extend the global expansion by adding stimulus in response to rising recession risks. However, last year’s easing of monetary policy comes at a price: Whenever the next economic downturn or major risk market drawdown hits, policymakers will have even less policy capacity to maneuver, thus limiting their ability to fight future recessionary forces.
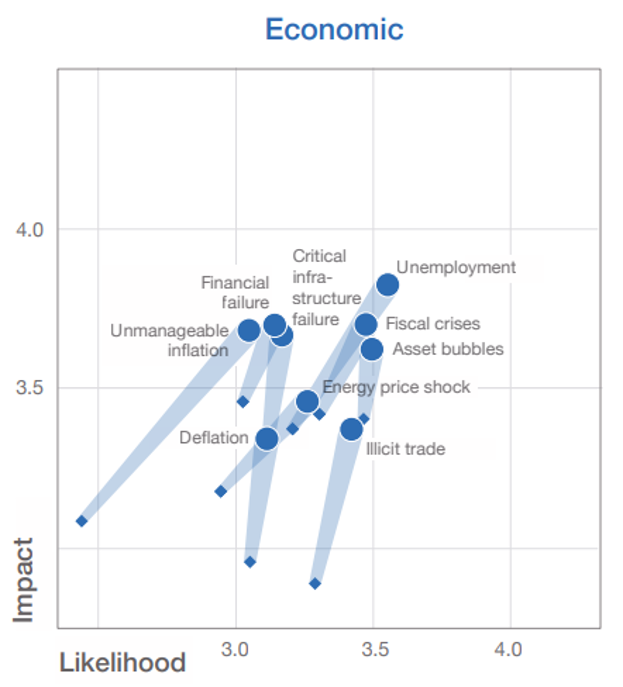
The Global Risks Report 2020 by the World Economic Forum is rich in data and charts. Below is the chart of major Economic Risks. The Global Shapers Community is the World Economic Forum’s network of young people (large circles) driving dialogue, action and change, while the Multi-Stake Holder (small diamonds) consists of leaders from the business, government and non-profit communities. It is interesting that the Shapers find most topics of higher impact and likelihood than the Multi-Stake Holders. Most are well known, but “critical infrastructure failure” deserves highlighting as it shows up later in the Top Fund Objectives.
Chart #2: Top Global Risks – Economic
2. Excessive corporate debt and low quality
Lance Roberts makes several good points in “MacroView: The Next ‘Minsky Moment’ Is Inevitable” including Chart #3 which shows that corporate debt is at its highest level in over 70 years. The benefit is that companies have lower costs from low interest rates. The risk is that interest payments have to be paid from cash flows. In recessions, this increases the risk of a company having to file for bankruptcy.
Chart #3: Corporate Debt to GDP
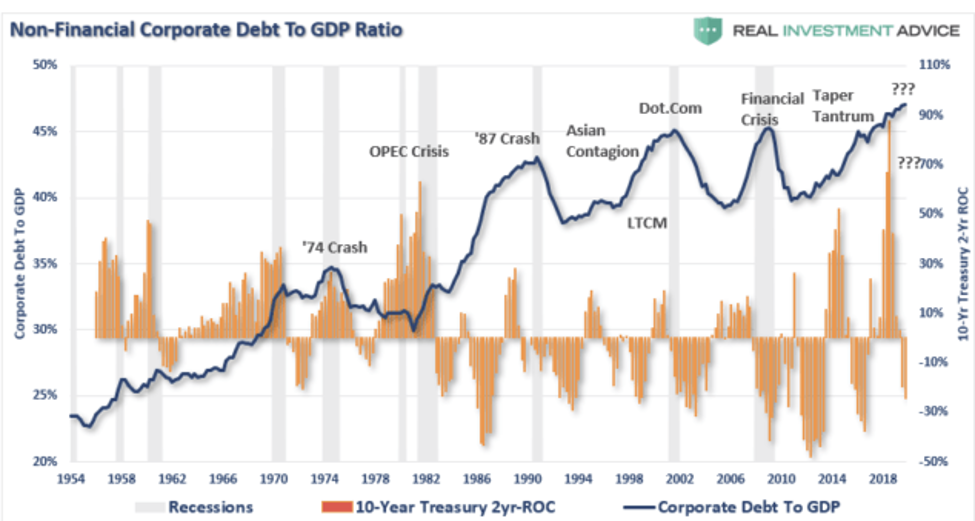
Source: MacroView: The Next ‘Minsky Moment’ Is Inevitable, Lance Roberts
Another problem with corporate debt is that the quality is lower as described by Jeffrey Gundlach, co-founder of DoubleLine Capital:
The credit worthiness of corporate debt is the number one risk that should concern bond investors. Gundlach issued his strongest warnings ever over the leverage taken on by U.S. corporations and the unrealistically favorable ratings that debt has been given.
Foreigners have been buying U.S. assets, he said, but that is unstable. If the economy weakens, those investors will want to “get out.” A lot of “potential selling” could happen, Gundlach said.
Gundlach on the Biggest Risk Facing Bond Investors and the Likely Next President, Robert Huebscher, Advisor Perspectives
The Organisation for Economic Co-operation and Development (OECD) also acknowledges the risk of low corporate debt quality:
In every year since 2010, around 20% of the total amount of all bond issues has been non-investment grade and in 2019 the portion reached 25%. This is the longest period since 1980 that the portion of non-investment grade issuance has remained so high, indicating that default rates in a future downturn are likely to be higher than in previous credit cycles…
In 2019, only 30% of the global outstanding stock of non-financial corporate bonds were rated A or above and issued by companies from advanced economies…
3. Excessive leverage
Lance Roberts highlights the high level of speculative leverage in Chart #4 from “MacroView: The Next ‘Minsky Moment’ Is Inevitable”. This leverage supports the markets until investors decide to reduce it as they have been for the last year or two. This metric is included in the Investment Model, but worth highlighting here.
Chart #4: Free Cash in Margin Accounts
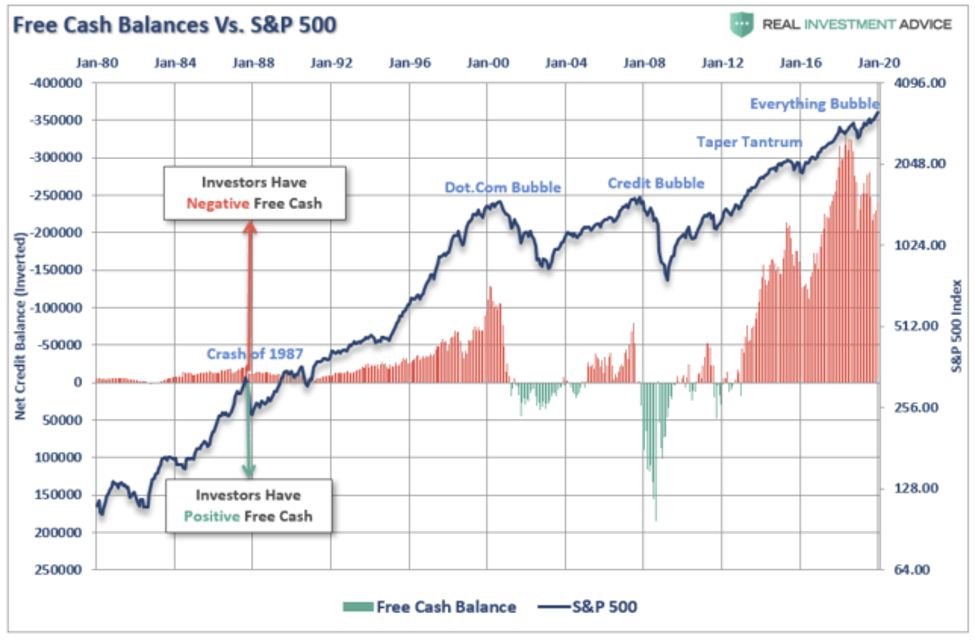
Source: MacroView: The Next ‘Minsky Moment’ Is Inevitable, Lance Roberts
4. Monetary policy and federal debt
Lance Roberts wrote MacroView: The Next ‘Minsky Moment’ Is Inevitable which shows that central banks have been increasing their balance sheets since the 2008 financial crisis to the point that global central balance sheets are now $21T which is roughly equal to the size of the U.S. economy. Mr. Roberts also wrote, “MacroView: Japan, The Fed, And the Limits of QE”, comparing the U.S. to Japan as summarized below:
-
- A decline in savings rates
- An aging demographic
- A heavily indebted economy
- A decline in exports
- Slowing domestic economic growth rates
- An underemployed younger demographic
- An inelastic supply-demand curve
- Weak industrial production
- Dependence on productivity increases
To support this view, in the chart below, the U.S., Japan, and Italy have the highest debt to GDP ratios of the countries with at least $1T in GDP. Secondly, U.S., Japan, and Brazil have the highest budget deficits as a percentage of GDP. In other words, the U.S. and Japan have the highest government debt loads and are getting into further into debt at a faster rate than other large economies. Currently the debt is increasing at about $1T per year in the U.S.
Chart #5: Government Debt/GDP vs Deficits
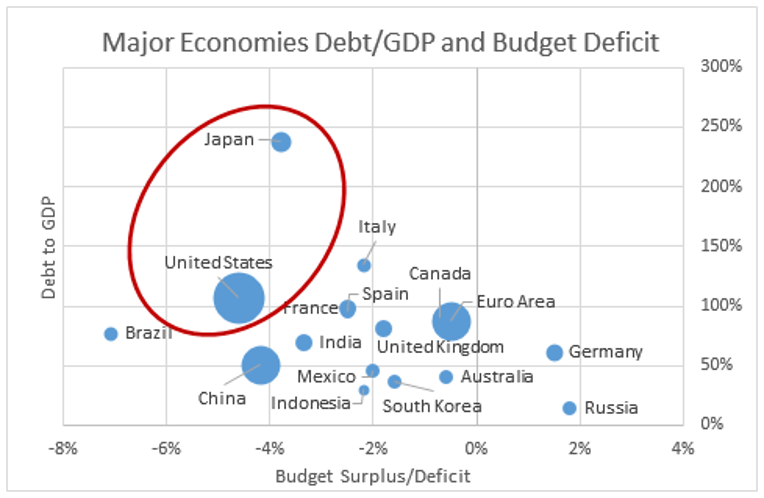
Source: Created by the author based on Trading Economics
The velocity of money is how economists measure how fast money changes hands in an economy. In Chart #6, we see that the velocity in the U.S. is 1.4 (dark red line) compared to 0.6 in Japan (light red line). The suggestion is that incremental easy money is less effective when there is so much already in the economy. The black line projects that at current rates, the velocity in the U.S. could reach that of Japan in another 10 or 15 years. Note that the Japanese stock market, Nikkei, peaked in the early 1990’s and still has not returned to its former level. The chart also shows that since 2009, asset prices have been inflated in Japan along with those in the U.S.
Chart #6: U.S. and Japanese Velocity of Money
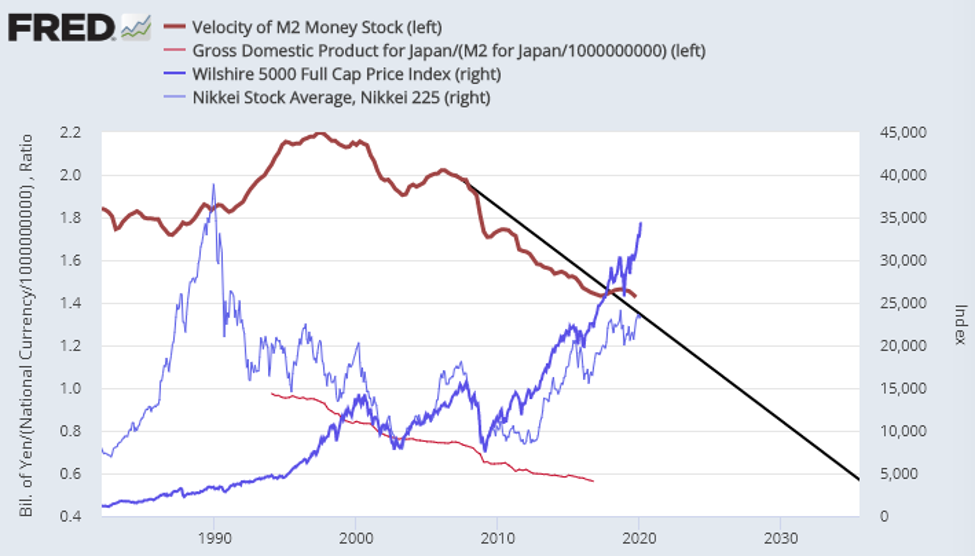
Source: St. Louis Federal Reserve FRED database
5. Trade and geopolitical tensions
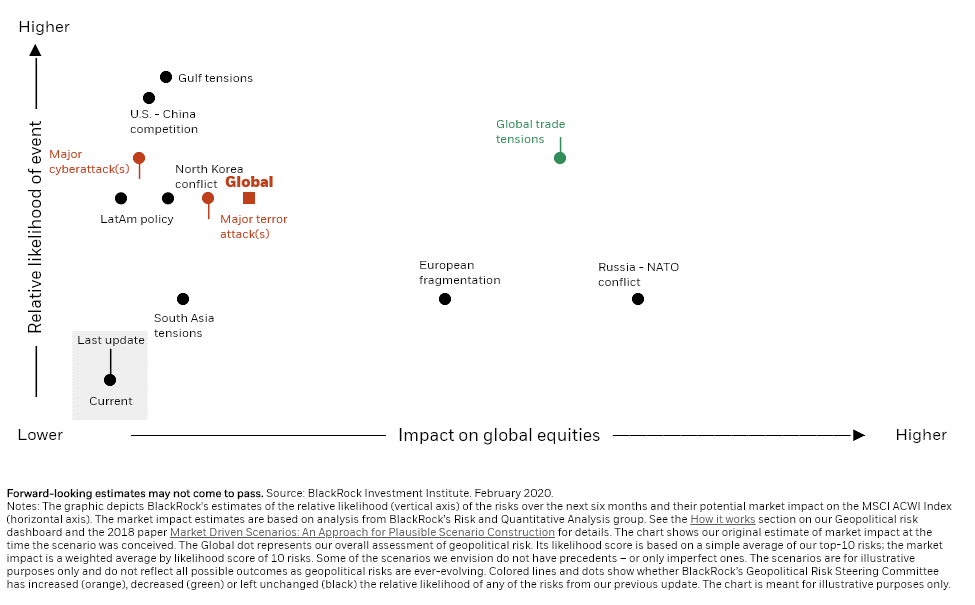
An excellent condensed view of geopolitical risk is provided by Blackrock, in Geopolitical Risk Dashboard, where they place global trade tensions as the most likely to occur with the highest consequences. Gulf tensions, U.S./China competition, cyberattacks, North Korea, Terror Attacks, and Latin American events are also likely to occur, but possibly have less impact on global investments. Geopolitical risks have been brought to the forefront by the conflict with Iran, China, and North Korea.
Chart #7: Geopolitical and Trade Impact and Likelihood
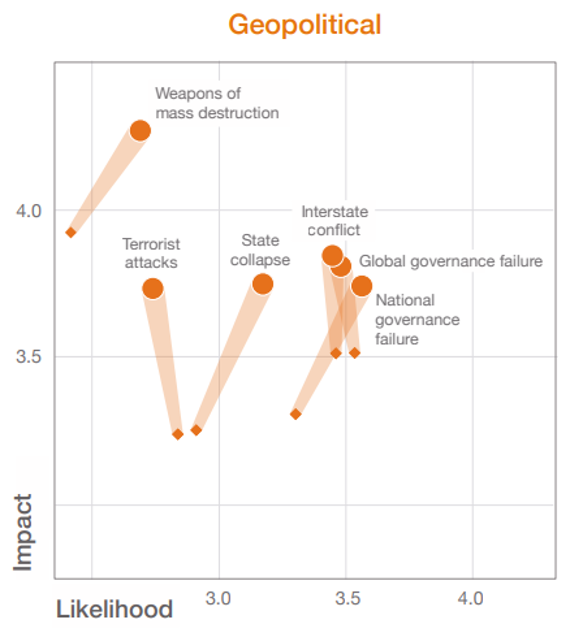
From the Global Risks Report 2020 is a chart of major Geopolitical Risks. The Global Shapers Community is the World Economic Forum’s network of young people (large circles) driving dialogue, action and change, while the Multi-Stake Holder (small diamonds) consists of leaders from the business, government and non-profit communities.
Chart #8: Top Global Risks – Geopolicitical
6. Inflation
This economic cycle — now entering a second decade — has been unusually long and shallow. The late-cycle, dovish pivot has also been unusual, and there are few signs of the traditional late-cycle limits of economic overheating. As a result, we don’t see a slide into recession as the primary risk — but a stubborn mix of slower growth and rising inflation. The potential for such a regime shift is one reason why we prefer short-maturity U.S. Treasuries, and see inflation-linked debt as attractive.
2020 Global Outlook, BlackRock Investment Institute
The biggest concern that I read about the risk of inflation is that it is under-estimated by investors. One measure of inflation, the Consumer Price Index, has been rising for the last five years and is now at 2.5%. The Federal Reserve has expressed a willingness to let inflation run a little higher than its 2% target. Vanguard points out that an aging population is deflationary in the long term, but that trade conflict may drive prices higher.
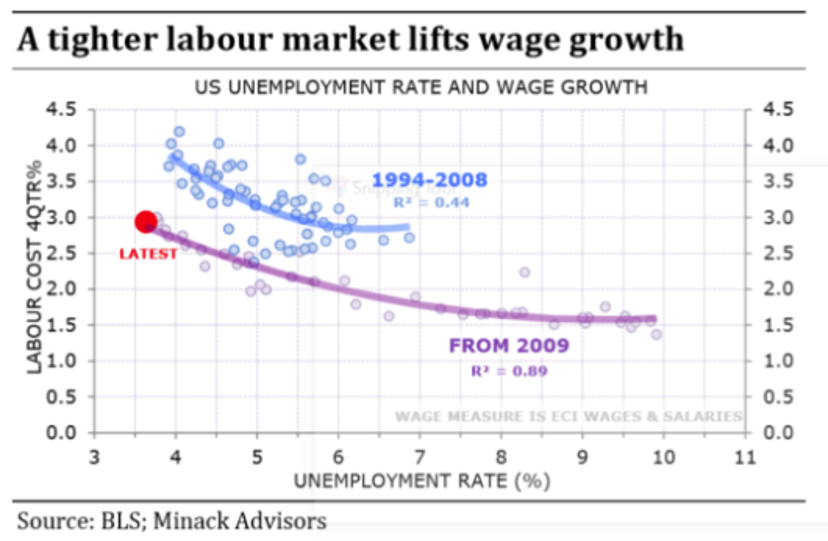
In The Risks In 2020 Seem Evenly Balanced, Gerard Minack from Evergreen Virtual Advisor provides the following chart which shows that labor costs are rising, but at historically low rates compared to the unemployment rate. Labor intensive industries such as health care and utilities are more susceptible to inflation from higher labor costs. Higher labor costs are great for workers and spending, but reduce profits.
Chart #9: Rising Wages
7. Weaker dollar
The dollar is heavily influenced by interest rates. If the global economy improves and the U.S. continues to slow then the dollar may weaken. Currently, the dollar is a safe haven and retains its strength. This may change at some point this decade which will benefit inflation protected bonds, U.S. multinational corporations, gold, commodities, foreign fixed income and emerging market equities.
8. Societal risks
From the Global Risks Report 2020 lists major Societal Risks including infectious diseases, food and water crises, involuntary migration, and social instability.
Paul Donovan from UBS, described the stock market drop on Monday, February 25th, as “fear of fear of the virus”. John Hussman, president and principal shareholder of Hussman Econometrics Advisors, sums up coronavirus well in Make Good Choices:
Apart from counting the novel coronavirus as one of the many factors that could prompt an episode of risk-aversion, I prefer to avoid discussing the financial aspects of a public-health crisis. Suffice it to say that market valuations are extreme and risk premiums are more compressed than at any other point in U.S. history. It’s misguided to imagine that the extraordinary full-cycle market risk that is already baked in the cake would somehow go away if coronavirus was to abate (which is my hope).
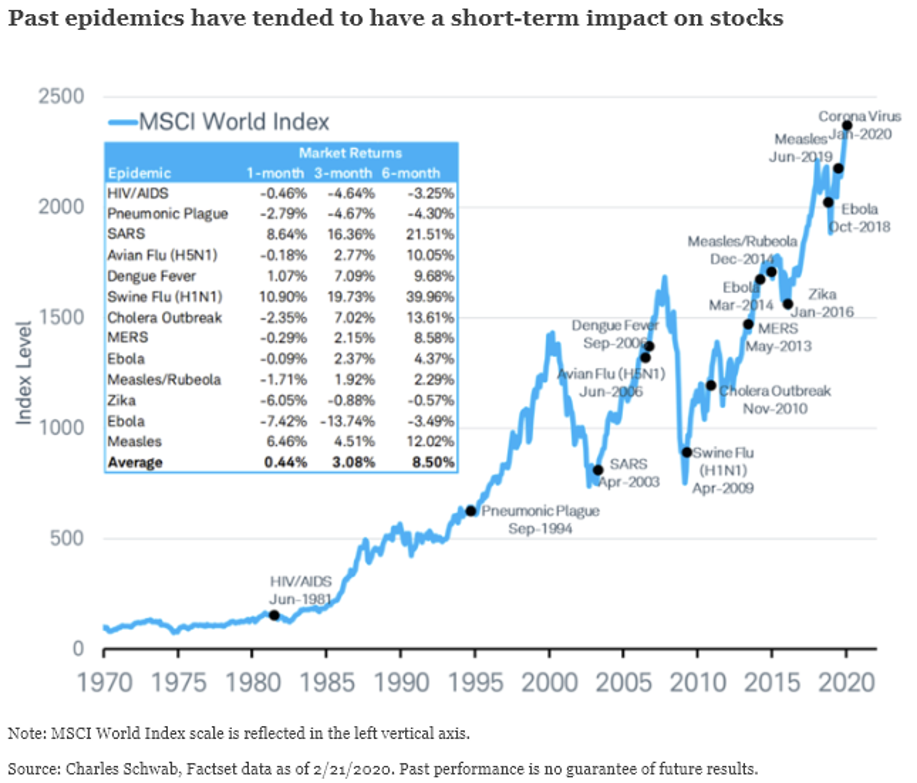
The Schwab Center for Financial Research looked at past epidemics and how they have impacted the stock markets. They provided Chart #10 which shows the impact of past epidemics. The stock market usually recovers within 3 to 6 months as the epidemic is contained.
Chart #10: Impact of Past Epidemics
Investment Strategy for Uncertain Times
While global growth may be improving, the current investment environment is susceptible to many potential shocks. When economies are growing slower, they are usually more susceptible to external shocks. This section reviews general topics on where to invest in the current environment.
1. The coming decade
Given slow economic growth, high valuations, trade tensions, low interest rates, high debt and low quality debt, how should we invest starting the 2020’s? Cautiously, in my opinion. The following view comes from Capital Management:
What should investors expect for the next ten years and how should we think about positioning for what could be a lower return environment? While we don’t know what the future may bring, the longer this liquidity fueled asset price bull market continues, the more extended valuations become. With low interest rates, modest economic growth and smaller benefits from globalization it is possible that we could be facing lower returns in both risk assets and interest-sensitive sovereign debt. We believe that a prudent, risk-aware approach focused on absolute returns with an eye towards preserving assets in down markets is preferred. “Are We There Yet?”, Carl Kaufman, Bradley Kane, Craig Manchuck, Osterweis Capital Management
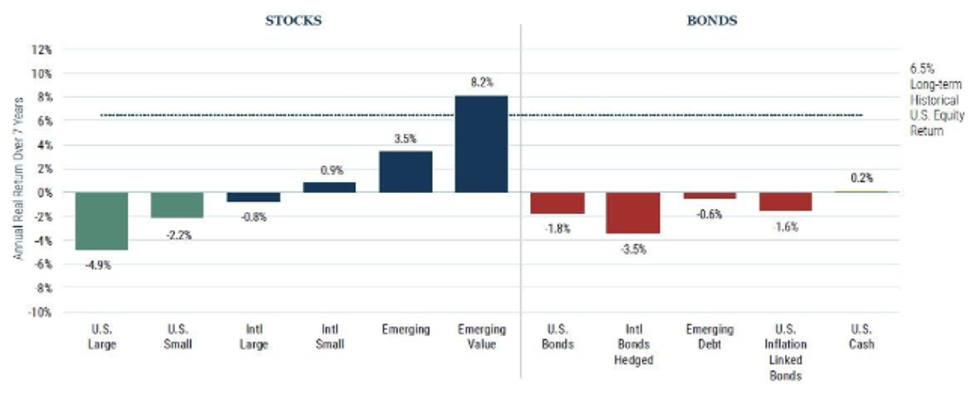
A common theme for assets over the next 5 to 10 years is shown by “GMO 7-Year Asset Class Forecasts: An Amazing Capstone to a Risk-On Year” in Chart #11. U.S. large and small cap companies are expect to underperform due to high valuations. Bonds are also expected to underperform. International stocks, especially emerging markets, are expected to be better performers.
Chart #11: Expected Seven Year Returns
From JPMorgan’s “Guide to the Markets”, this chart shows that U.S. equities have risen so quickly relative to the rest of the world, the international valuations are now 22% lower than in the U.S. The yield is significantly higher as well.
Chart #12: Elevated U.S. Valuations Relative to International

Source: JPMorgan’s Guide to the Markets
2. Investment risk
Financial Industry Regulatory Authority (FINRA) has this to say about risk:
Although stocks have historically provided a higher return than bonds and cash investments (albeit, at a higher level of risk), it is not always the case that stocks outperform bonds or that bonds are lower risk than stocks. Both stocks and bonds involve risk, and their returns and risk levels can vary depending on the prevailing market and economic conditions and the manner in which they are used.
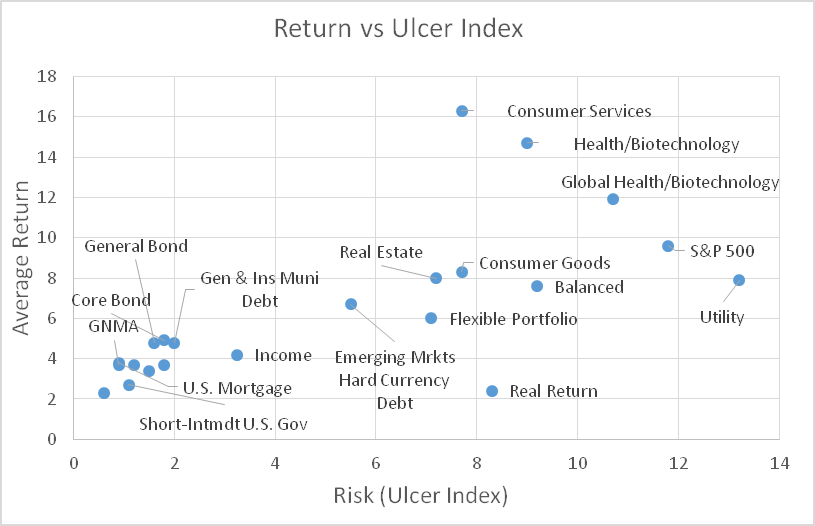
I created Chart #11 to look at how Fidelity funds performed during the 2007 recession when the S&P 500 lost about 42% using Mutual Fund Observer’s down market statistics. These are the funds that outperformed the S&P 500. The chart represents the average return for the past 12 years compared to the Ulcer Index (Risk).
Chart #13: Performance of Fidelity Funds Since the 2007 Bear Market
Source: Author Based on Mutual Fund Observer
3. Allocation
BlackRock Investment Institute’s 2020 Global Outlook is an interesting read as they have a wealth of information including risks and, of course, the shorter term 2020 outlook. BlackRock is positive on the following assets:
-
- EM equities as beneficiaries from the global recovery.
- Value due to its pro-cyclical nature and a steepening yield curve.
- Quality as valuations have modestly cheapened including global firms that stand to benefit from improving trade activity.
- Short term U.S. Treasuries
- TIPS due to cheap valuations relative to current inflation levels – and potential for more price pressures due to wage pressures, an uptick in activity and longer-term deglobalization.
- Global high yield, supported by stable monetary policy and the prospect of a growth inflection.
- Hard-currency EM debt against a backdrop of dovish EM central banks, an improving growth outlook and a stable to somewhat weaker U.S. dollar.
- Local-currency EM debt
2020 Global Outlook, BlackRock Investment Institute
4. Diversification
Jurrien Timmer, at Fidelity makes the case in 2020: Play the Middle, Protect The Tails for protecting against both deflation by owning longer duration bonds and inflation by owning gold and inflation protected bonds.
Daniel Loewy and Karen Watkin of AllianceBernstein wrote Five Multi-Asset Strategies for 2020’s Challenges. They advocate two straight forward strategies of considering investing in Europe and emerging markets and holding on to longer duration fixed assets. Strategies that some investors may be less familiar with are investing in alternative strategies such as funds that benefit from volatility and merger arbitrage strategies. Examples of funds that that reduced volatility in my portfolio this past two weeks are The Merger Fund (MERFX), IQ Merger Arbitrage ETF (MNA), iShares Gold Trust (IAU), and AGFIQ US Market Neutral Antibeta Fund (BTAL). They also advocate strategies that are based on fundamentals like valuations, balance sheets stimulation and inflation.
Funds for Uncertain Times
Each month, I extract data on about a thousand funds from the Lipper database using Mutual Fund Observer screens. I rate funds and objectives based upon risk, risk-adjusted return, income, momentum, and quality factors including bond quality and stock price to earnings ratio. Table #1 contains the top Lipper Objective along with a representative component of the factors. The objective of this ranking system is to build a low-risk portfolio with high risk adjusted returns. The way to read the table is that the S&P 500 had an Ulcer Index (Risk) of 4.4 and an average return (APR) of 21.7, a risk adjusted return (Martin Ratio) of 1.6% for the past two years. I look for funds with lower risk and higher risk adjusted returns in each of the nine buckets.
Table #1: Top Performing Lipper Objectives – 24 Months Ending February 2020
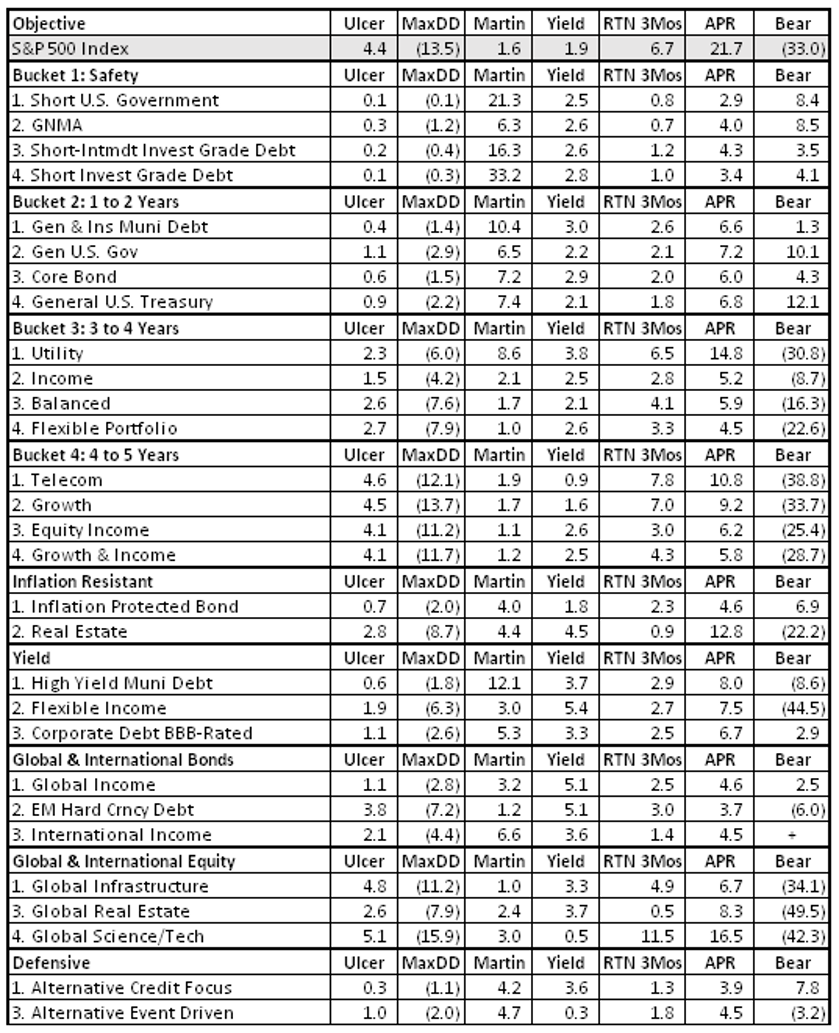
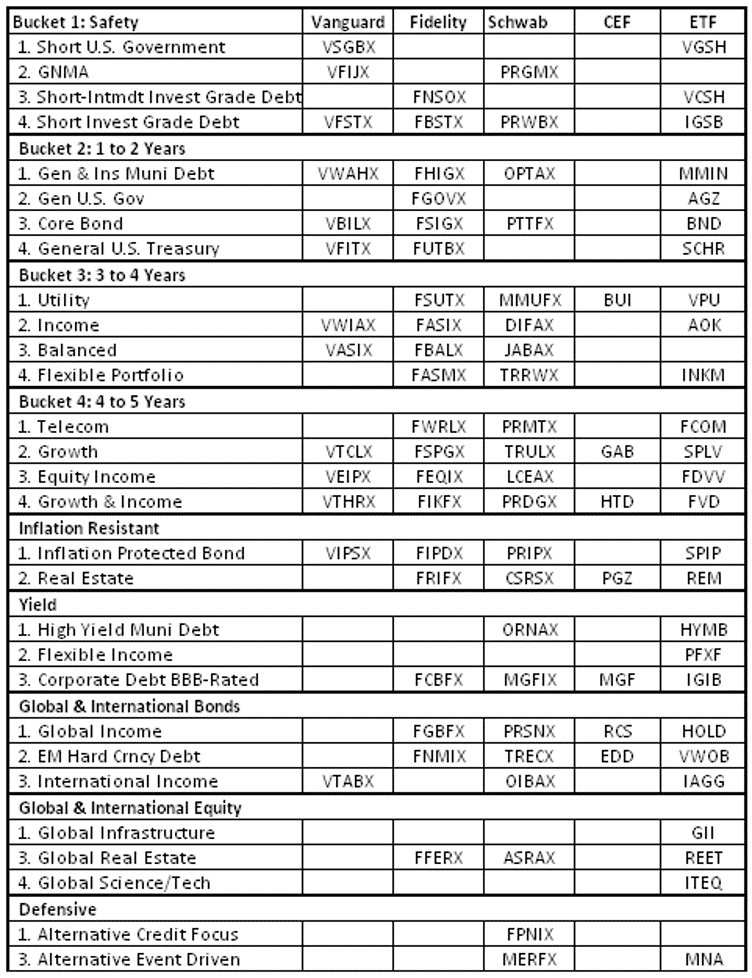
Table #2 contains the top funds for each of the Top Lipper Categories for mutual funds at Vanguard, Fidelity and those available at Charles Schwab, along with closed end funds and exchange traded funds. I use the ranking system to assess my own funds in comparison to top funds as identified in Table #2. I make one or two small changes each month when appropriate.
Table #2: Top Performing Funds by Top Performing Objectives
Closing
I have been positioning my portfolio optimistically and cautiously for a slow growth, high risk environment. This month, while the S&P 500 was down 7%, my portfolio was down 1.5%. The dip has been a good laboratory to see how my funds will perform in a down market. In March, I will use Mutual Fund Observer to identify potential funds to replace one or two of my riskier funds. I find the new Mutual Fund Observer Portfolio Tool (MFO Premium access required) to be one of the best “keep it simple” tools for the individual investor. It gives me a quantitative method for pruning funds that no longer fit into my “sleep at night” lifestyle.
Disclaimer
I am not an economist nor an investment professional. I became interested in economic forecasting and modeling in 2007 when a mortgage loan officer told me that there was a huge financial crisis coming. There were signs of financial stress if you knew where to look. I have read dozens of books on business cycles since then. Discovering the rich database at the St. Louis Federal Reserve (FRED) provides most of the data to create an Investment Model. The tools at Mutual Fund Observer provide the means for implementing and validating the Investment Model.