


In this article, I look at Janus Henderson Flexible Bond (JANFX), BlackRock iShares Aaa – A Rated Corporate Bond ETF (QLTA), Carillon Reams Unconstrained Bond (SUBFX), BBH Income (BBNIX), T Rowe Price Multi-Strategy Total Return (TMSRX), Advisory Research Strategic Income (ADVNX), and Vanguard LifeStrategy Income Inv (VASIX) as potential income funds to own during a lost decade that starts with high valuations and low interest rates. The second section looks at why I expect the next decade to have low returns for equity and bonds. The third section looks at Risk to Reward comparisons for income funds from 2007 to 2019, followed by the same comparison for the past twelve months. The final section looks at other top income funds that should be suitable for most investors.
The criteria that I used for selecting the funds in this article are long term performance of Lipper Category, low drawdown, a minimum yield of 2%, and very conservative or conservative MFO Risk classification. I also included performance during the past six months when bonds were not benefiting from falling rates. The starting point was my Fund Ranking system, which is based on MFO metrics.
As a quick update on funds from previous articles, Columbia Thermostat Fund (CTFAX) is now available as a no-load, no transaction fee fund at Fidelity, and (COTZX) is available through Vanguard. KL Allocation Fund Institutional Class (GAVIX) will have its minimum required investment lowered to $5,000 at the beginning of next year.
Top Low Risk Income Funds
The following funds are selected to be the finalist funds for this article and are now on my shopping list. VASIX is used as a baseline fund in the following figures. Note that the funds are from different Lipper Categories for comparison purposes. All funds are available at Charles Schwab, and all funds except BBNIX and TMSRX have inception dates older than seven years.
Table #1: Finalist Funds
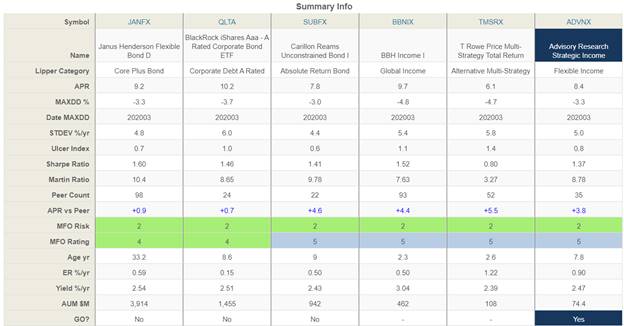
Source: Mutual Fund Observer
Table #2 shows that all five funds have great long term performance and lower risk.
Table #2: Finalist Funds Composite Ratings
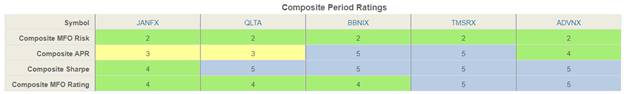
Source: Mutual Fund Observer
Table #3 shows that all funds, with the exception of TMSRX, will tend to rise when the S&P 500 falls and to be more volatile than the bond market.
Table #3: Finalist Funds Capture Metrics
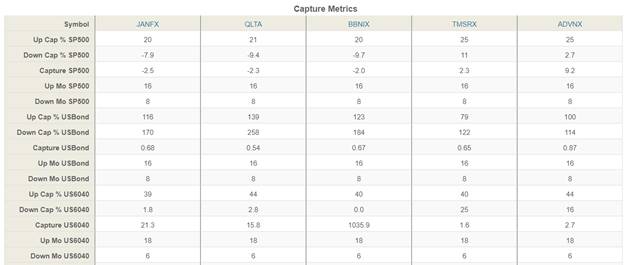
Source: Mutual Fund Observer
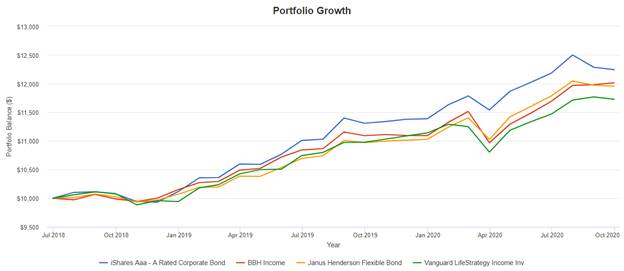
Figure #1 shows the long term performance of Janus Henderson Flexible Bond (JANFX), Carillon Reams Unconstrained Bond (SUBFX), Advisory Research Strategic Income (ADVNX), and Vanguard LifeStrategy Income Inv (VASIX). VASIX and ADVNX have comparable performance and both have about 15% allocated to stocks.
Figure #1: Finalist Funds Long Term Performance
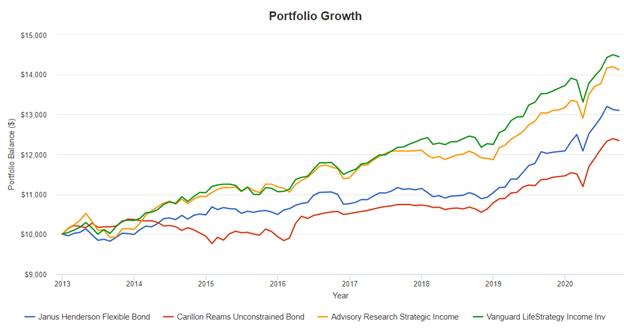
Source: Created by the Author Using Portfolio Visualizer
Figure #2 shows the best performing Finalist Funds for the past two years. ADVNX had comparable performance but is not shown. The link to Portfolio Visualizer is here, and you may substitute your own selection of funds.
Figure #2: Finalist Funds Short Term Performance
Source: Created by the Author Using Portfolio Visualizer
The Coming Lost Decade
Lost decades come from many circumstances, and we now have high valuations and low-interest rates which is a common setting for lost decades. This is a perfect storm. Vanguard writes in The New Age of Uncertainty that it estimates US equity returns to be in the mid-single digits over the coming decade. GMO 7-Year Asset Class Forecast: 2Q 2020 describes that 7-year equity returns will be negative, as well as John Hussman in Herd Mentality who estimates negative returns over the next 12 years. The reason is simple: high valuations in a low growth environment. This is best explained by Ed Easterling, from Crestmont Research as shown in Figure #3. Long periods of high increases in valuations (green bars) are followed by long periods of declining valuations (red bars). Secondly, note that dividend yields (brown bars) and earnings growth (blue bars) are near historical lows. Compound this pessimistic situation with rising COVID infections.
Figure #3: Valuations, Yield and Earnings Growth
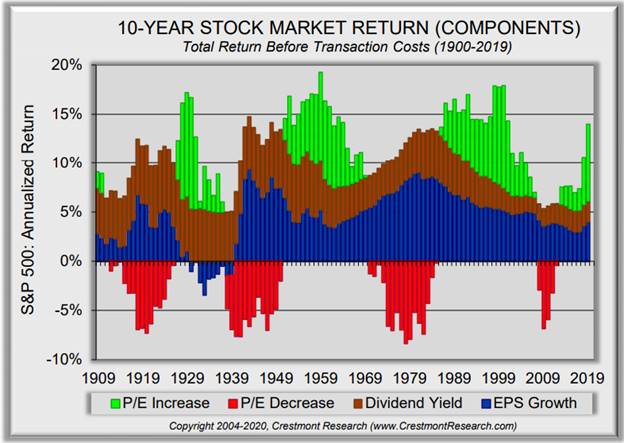
Source: Crestmont Research
Figure #4 shows the 1960’s and 70’s as an example when stocks (blue line) did not keep pace with inflation (green line), and rising interest rates (blue line) lowered the market value of bonds. Here we are 40 years later with most yields at or below inflation.
Figure #4: Secular Bear Market of the 1960’s and 1970’s
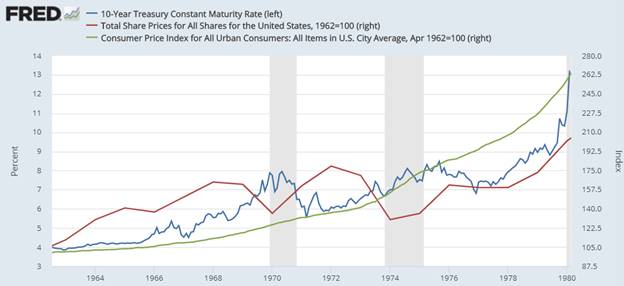
Source: Created by the Author Based on the St. Louis Federal Reserve FRED database.
Historical Bond Fund Performance (2007 – 2019)
Figure #5 shows the average annualized return of over three hundred bond funds in twenty Lipper Categories plus the S&P 500 as a baseline compared to Risk as measured by the Ulcer Index for the 12 years from 2007 through 2019. The size of the bubble is proportional to the yield.
Figure #5: Risk vs Reward of Income Funds (2007 to 2019)
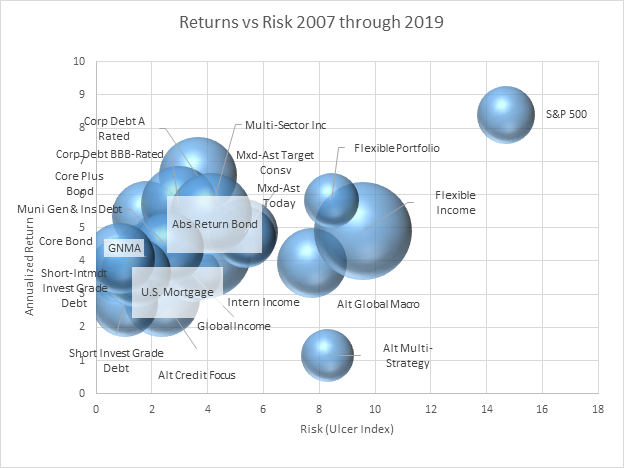
Source: Created By the Author Based On Mutual Fund Observer
Table #4 contains the metrics for the Lipper Categories sorted from highest Yield to Ulcer Ratio to the lowest. The Categories at the top paid the highest yield for the risk taken for this time period.
Table #4: Twelve Year Metrics of Income Funds
| #Funds | Return | Ulcer | Yield | Yield/Ulcer | |
| U.S. Mortgage | 8 | 4.1 | 0.9 | 2.5 | 2.9 |
| GNMA | 11 | 3.7 | 0.9 | 2.2 | 2.4 |
| Short Invest Grade Debt | 27 | 2.7 | 1.0 | 2.2 | 2.1 |
| Short-Intmdt Invest Grade Debt | 16 | 3.7 | 1.4 | 2.4 | 1.7 |
| Core Plus Bond | 15 | 5.4 | 1.8 | 2.4 | 1.3 |
| Core Bond | 50 | 4.1 | 1.8 | 2.3 | 1.3 |
| Alt Credit Focus | 3 | 2.9 | 2.4 | 2.9 | 1.2 |
| Intern Income | 5 | 4.3 | 3.9 | 4.8 | 1.2 |
| Muni Gen & Ins Debt | 47 | 4.4 | 2.6 | 2.6 | 1.0 |
| Abs Return Bond | 2 | 4.5 | 2.5 | 2.5 | 1.0 |
| Corp Debt BBB-Rated | 22 | 5.7 | 3.0 | 2.9 | 1.0 |
| Corp Debt A Rated | 6 | 6.6 | 3.7 | 3.1 | 0.8 |
| Multi-Sector Inc | 19 | 5.4 | 4.1 | 3.4 | 0.8 |
| Flexible Income | 4 | 4.9 | 9.6 | 4.9 | 0.5 |
| Global Income | 7 | 3.6 | 3.5 | 1.6 | 0.4 |
| Mxd-Ast Target Consv | 34 | 4.9 | 5.3 | 2.3 | 0.4 |
| Mxd-Ast Today | 5 | 4.7 | 5.4 | 1.9 | 0.3 |
| Alt Global Macro | 9 | 3.9 | 7.7 | 2.5 | 0.3 |
| Flexible Portfolio | 23 | 5.8 | 8.4 | 1.5 | 0.2 |
| Alt Multi-Strategy | 2 | 1.2 | 8.3 | 1.4 | 0.2 |
| S&P 500 | 1 | 8.4 | 14.7 | 1.69 | 0.1 |
Source: Created By the Author Based On Mutual Fund Observer
COVID Induced Recession Metrics (12 Months)
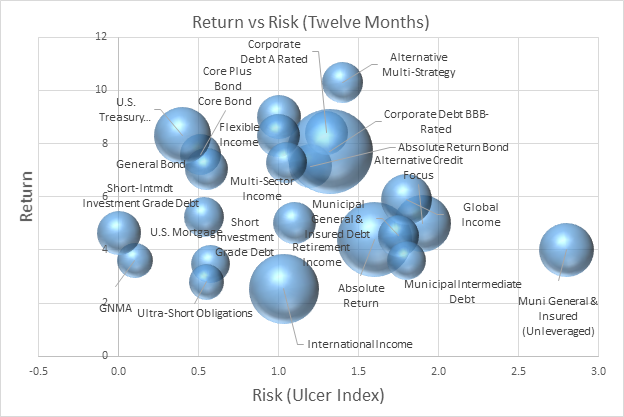
Figure #6 represents 57 top funds for the past 12 months from the same Lipper Categories. The funds that I am most interested in are in the upper left-hand corner representing higher return, lower risk categories. While I own funds in many of the categories, I am looking for funds in the upper left-hand corner representing low risk income funds with higher returns. One caution worth noting is that some categories have benefited from the recovery from the correction earlier this year.
Figure #6: Performance of Top, Low Risk Income Funds
Source: Created By the Author Based On Mutual Fund Observer
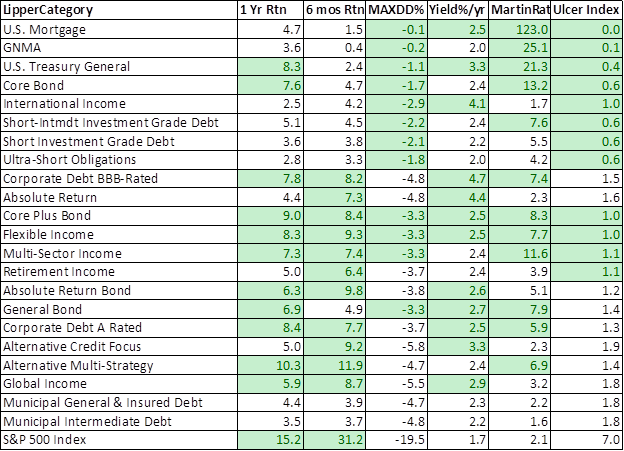
Table #5 contains the metrics for the funds in the previous figure. The green shaded cells are the 12 best categories for the column.
Table #5: Top Lipper Categories Income – 12 Months
Source: Created By the Author Based On Mutual Fund Observer
Other Top Low Risk Income Funds
The following 35 funds are a subset of those used to create the previous table. They were chosen because they have annualized six-month returns when interest rates were not falling off 2% or more, maximum drawdowns of 5% or less, among a few other criteria. They are sorted from with the highest yield to Ulcer Index Ratio to the lowest. This provides an estimate of how much risk the fund took over the past year for the yield paid. The first two are closed-end funds. The fund names shaded green are 10 years old or older. The names shaded in yellow are less than 5 years of age.
Table #6: Top Low Risk Income Funds
| Symbol | Name | Rtn 1 Yr | Ulcer Index | Martin Ratio | Yield |
| MGF | MFS Government Mrkts Inc Trust | 7.1 | 0.3 | 19.1 | 7.3 |
| MIN | MFS Interm Inc Trust | 7.0 | 0.7 | 9.6 | 8.6 |
| ISTB | BlackRock Core 1-5 Year USD Bond | 4.6 | 0.3 | 11.5 | 2.4 |
| SPAB | State Street Port Agg Bond | 6.8 | 0.4 | 15.0 | 2.6 |
| SCHZ | Schwab US Agg Bond | 7.0 | 0.4 | 17.0 | 2.5 |
| SWAGX | Schwab US Agg Bond | 6.8 | 0.4 | 17.0 | 2.5 |
| VCOBX | Vanguard Core Bond | 9.1 | 0.4 | 21.0 | 2.1 |
| FNDSX | Fidelity Sustainability Bond | 7.1 | 0.4 | 17.7 | 2.1 |
| FIXD | First Trust TCW Opportunity Fixed Inc | 8.2 | 0.4 | 19.9 | 2.0 |
| PFORX | PIMCO Intern Bond (US Dollar-Hedged) | 3.3 | 1.2 | 2.1 | 5.9 |
| VTBIX | Vanguard Tot Bond Market | 6.6 | 0.5 | 12.4 | 2.3 |
| IUSB | BlackRock Core Tot USD Bond Market | 6.7 | 0.6 | 9.4 | 2.7 |
| VNLA | Janus Henderson Short Dur Inc | 3.0 | 0.5 | 4.3 | 2.2 |
| BNDC | Northern Trust Core Select Bond | 7.4 | 0.5 | 12.2 | 2.2 |
| PBDIX | T Rowe Price US Bond Enh | 7.3 | 0.6 | 11.7 | 2.4 |
| SHAG | WisdomTree Yld Enh US Sht-Term Agg Bond | 4.6 | 0.6 | 6.4 | 2.3 |
| FBNDX | Fidelity Invest Grade Bond | 8.9 | 0.6 | 13.7 | 2.1 |
| FTHRX | Fidelity Intermediate Bond | 6.5 | 0.7 | 7.8 | 2.2 |
| DODIX | Dodge & Cox Inc | 7.7 | 0.9 | 7.6 | 2.6 |
| PMZIX | PIMCO Mort Opportunity and Bond | 4.4 | 1.6 | 2.3 | 4.4 |
| VFSTX | Vanguard Short-Term Invest-Grade | 4.8 | 0.9 | 4.4 | 2.4 |
| SUBFX | Carillon Reams Unconstrained Bond | 8.5 | 0.9 | 8.9 | 2.4 |
| PRWBX | T Rowe Price Short-Term Bond | 4.3 | 0.8 | 4.3 | 2.1 |
| JANFX | Janus Henderson Flexible Bond | 9.0 | 1.0 | 8.3 | 2.5 |
| TRBUX | T Rowe Price Ultra Short-Term Bond | 3.1 | 0.8 | 3.1 | 2.0 |
| ADVNX | Advisory Research Strategic Inc | 8.3 | 1.0 | 7.7 | 2.5 |
| SWLRX | Schwab Monthly Inc — Max Payout | 5.0 | 1.1 | 3.9 | 2.4 |
| BSCN | Invesco BltShrs 2023 Corp Bond | 5.4 | 1.2 | 4.1 | 2.6 |
| BBNIX | BBH Inc | 8.3 | 1.5 | 5.1 | 3.0 |
| QLTA | BlackRock Aaa – A Rated Corp Bond | 8.4 | 1.3 | 5.9 | 2.5 |
| EXCPX | Manning & Napier Unconstrained Bond | 5.8 | 1.5 | 3.3 | 2.6 |
| TMSRX | T Rowe Price Multi-Strat Total Return | 10.3 | 1.4 | 6.9 | 2.4 |
| MMIN | IQ MacKay Muni Ins | 6.0 | 1.4 | 3.8 | 2.3 |
| VWITX | Vanguard Interm-Term Tax-Ex | 4.1 | 1.6 | 2.1 | 2.4 |
| TFI | State Street Muni Bond | 4.5 | 1.5 | 2.5 | 2.0 |
Source: Created By the Author Based On Mutual Fund Observer
Wishing You a Safe Holiday Season
I look forward to the holiday season and wish all readers a safe and pleasant holiday season. Stay safe and be well.
Disclaimer
I am not an economist nor an investment professional. I became interested in economic forecasting and modeling in 2007 when a mortgage loan officer told me that there was a huge financial crisis coming. There were signs of financial stress if you knew where to look. I have read dozens of books on business cycles since then. Discovering the rich database at the St. Louis Federal Reserve (FRED) provides most of the data to create an Investment Model. The tools at Mutual Fund Observer provide the means for implementing and validating the Investment Model.