Monthly Archives: February 2020

February 1, 2020

By David Snowball

Dear friends,

Focus, people! Focus!

It’s never wise to focus on just a single trading day, especially one like the last day of January 2020:

Goodness, no. That will surely lead you to all sorts of bad decisions: selling your portfolio, readying Yahoo Finance, rending your garments, drinking a Keystone (or a Natty Bo, a Natty Lite, a Genny Cream…).

God forfend.

One alternative is to focus on stuff that matters:

January indicator: the performance of the market in January foretells its performance in the next 11 months. Oops … the Vanguard Total Stock Market Index fell just -0.08% in January 2020 (Thanks, Rao!).

Super Bowl indicator: an NFC win is positive for the markets, an AFC win is negative. It turns out to be a lot more accurate than most paid market gurus: the Super Bowl indicator has been right 50% of the time.

The “logic” behind it was that the NFC cities were predominantly the “real economy” Rust Belt cities (Detroit, Chicago, Green Bay) while the AFC upstarts represented whatever belt Oakland’s Al Davis was in. Fellow Pittsburghers will remember the curious contortion that occurred at the indicator’s birth. The sportswriter behind it (a New Yorker) designated the Steelers – an AFC team that had won three Super Bowls – as an NFC team because it was one of the original NFL franchises.

The Year of the Rat: within the Chinese zodiac, the rat – the 2020 sign – represents wealth and generosity, though the last Rat year was 2008. One feng shui practitioner explains that “rats are respected in the East for being resourceful, skillful, open-minded and one of nature’s greatest survivors in times of danger and scarcity.” Rat years favor well-laid plans. So, plan for a prosperous year, just like 2008!

The Year of the Metal Rat: the Chinese calendar also includes a polarity (yin or yang) and an element (representing heaven) with an animal (representing earth). This year, Yang plus Metal, making it the Year of the Metal Rat. (If any of you folks work for Netflix and are casting about for new shows, I’ve already trademarked this one.) Yang is the boisterous, active principle. Metal is the strong element. Put them together and what do you have?

(I don’t know. I’m asking.)

Short-term noise, longer-term caution

Thomas Putnam, founder of Fennimore Asset Management, advisor to the FAM funds, shared a thoughtful reflection on the horrendous and dispiriting noise (from debasement in Washington and disengagement in London to disease in Wuhan and despair about climate) around us.

There is never a shortage of geopolitical and macroeconomic topics to engross the financial markets. In the 2009 Chairman’s letter we wrote, “The topics constantly at the forefront include excessive government debt, future tax increases, ‘Obamacare,’ the jobless recovery, and the ticking time bombs of potential budget disasters in many states including our domicile, New York.” What followed was a decade in which the S&P 500 returned 13.6% annualized — the fifth-best decade of the last 140 years.

As we enter this next decade, tensions between America and Iran are mounting, we are in our third year of a trade dispute with China, the fate of what’s left of Obamacare are is still unknown, and our upcoming presidential election is shaping up to be extremely divisive. As we did in 2009, we pay attention to these matters — assessing them for their potential long-term impacts — but they do not drive our investment decisions.

That said, our recent experiences have a hand in shaping prudent long-term investing. Booking 30% gains in a year with minimal earnings growth, as we did last year, is pretty much a signal that you’re booking part of your expected future gains in the present.

Rob Arnott and Cliff Asness aren’t exactly Abbott and Costello, but one does get a sense of half-playful, half-competitive sparring between the two. Articles featuring the two have title words like raging, slamming and blasting. As a result, it’s striking when the two of them publish complementary warnings in the same month.

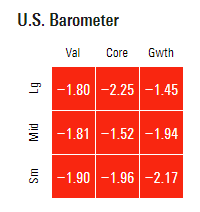
Arnott’s updates “asset allocation interactive” continues to project declining long-term real returns (i.e., 10 year, after inflation) for a range of asset classes:

Translation: if you’re looking for 5% real returns, (1) get out of the US market and (2) expect substantial turbulence.

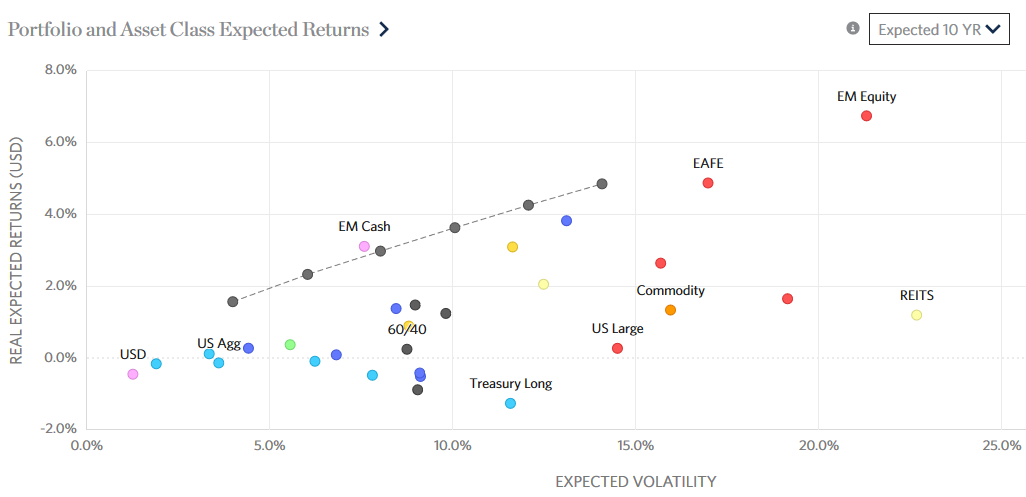
At the end of January, Mr. Asness’s AQR firm published projections that were (1) barely more encouraging and (2) falling.

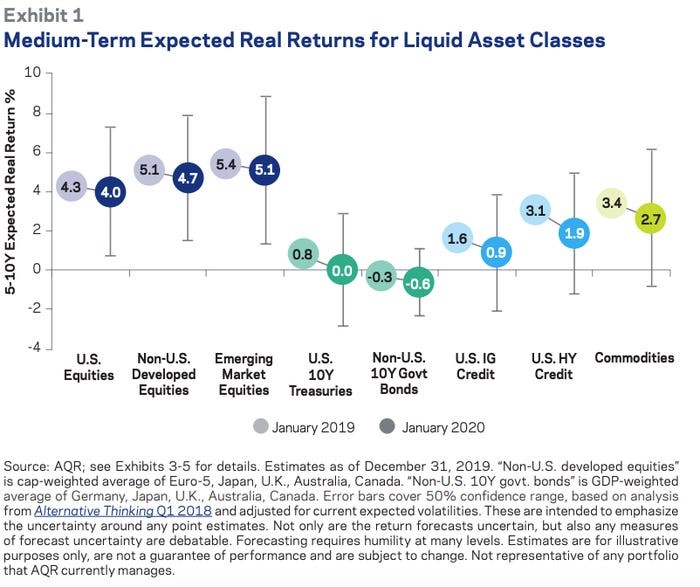
The dot signals projected returns, the length of the line reflects the uncertainty (or volatility) around those projections. Mr. Asness referred to those returns as “soberingly low.”

AQR’s bottom line here is very close to Research Affiliates: low returns across the board, better equity returns outside the US, considerable volatility.

AQR’s recommendation: “it is high time to reevaluate your investing objectives, even if this means expecting lower payouts while putting more money to work in markets.” Be reasonable. Live frugally. Save conscientiously. Sounds doable, though daunting.

The robo-writers are everywhere!

Except here.

Back in December, we fulminated about an article on Leuthold Global that began with the phrase, “Without even doing any in-depth analysis …” The article was nominally the product of Zacks Equity Research. Our response was:

Thank goodness they didn’t waste time with any of that in-depth research stuff that might have noted that this is a conservatively managed quant fund, that it currently holds 32% cash, that its risk-adjusted returns are strong, and that its total returns have pretty much clubbed its peers since inception.

Our suggestion was that if you ever see an article that begins “we haven’t done any in-depth analysis,” you should hit “delete.”

Victoria Odinotska offered a fascinating coda to that piece. Victoria is president of Kanter & Co., which does media relations work for investment firms. (And, based on our experience, does it really well.) She’s also an exceptional person. In any case, Victoria reports that “we are convinced that most of the Zacks articles are written by a machine using a template. It doesn’t matter which fund they write about in one of these write-ups the language is the same.” In a test of Victoria’s suspicion, we searched the phrase “without even doing any in-depth” within the site finance.yahoo.com. The result:

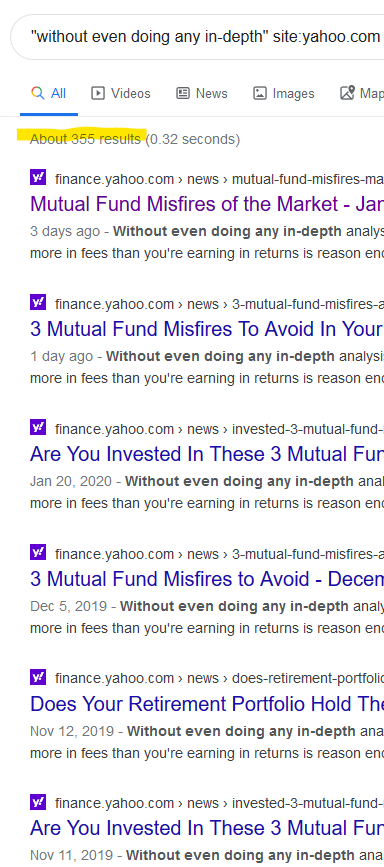
Yep, 355 robo articles keyed to the same phrase and same template. 355 times that Yahoo thought their readers deserved articles “without any in-depth analysis.” I wonder how many of us still remember the ancient times when Yahoo was a bright, hopeful spot on the internet?

Thanks to …

Fitz, Wilson, Eric (challenge met!), Joseph, Barry, Andrew, K. Poody (we’re glad you enjoy the Augie pics), Martin (we appreciate your generosity), Zeke (curious about your adventures Down Under and hopeful that retirement is treating you well and that we’re able to trick you into something), Marvin, James (in memory of Ted Didesch), Mayson (Charles is, indeed, a gem) and the good folks at S&F Investment Advisors out in L.A.

Thanks, most especially, to our faithful subscribers, Gregory, James, William, Matthew, Brian, the other William, Seshadri, David, and Doug.

We are always sad to see one of our subscribers (an informal designation for the folks who make an automated monthly contribution through PayPal) go, but deeply grateful for the support they’ve provided and 100% supportive of their decision. That said if there’s something at MFO that concerns you or something you’d really like to see but haven’t, write me! Your guidance helps us be better.

Starting to think about the Morningstar Investment Conference, 3-5 June. Meet us there, if you can. Working on a profile of Laura Geritz’s Rondure funds, which are coming up on their third anniversary and performing admirably. And finishing a piece on Yacktman Focused (YAFFX) and YCG Enhanced (YCGEX), one famously excellent, the second an intriguing option and both run by guys named Yacktman. March is the month to walk through my personal portfolio. And to consider whether the “Potemkin” that best helps us think about the ETF industry is the Village or the Battleship.

Cheers,

david's signature


Rule #2: Know the Short and Long Term Investment Environment

By Charles Lynn Bolin

While writing this article, I am reminded of Alan Greenspan’s comment about “irrational exuberance” in 1996 and Ben Bernanke coining the phrase “global savings glut” in 2005. Roughly three years later we had the bursting of the Technology Bubble and the Housing Crisis. We now have inflated asset prices due to nearly of decade of “Quantitative Easing”. The CNN Fear and Greed Index is a timely figure for this article showing “Extreme Greed” in the markets.

“We stay irrationally bullish until peak positioning & peak liquidity incite [a] spike in bond yields & 4-8% equity correction,” – January 19, 2020, Bank of America, MarketWatch

Source: CNN Fear & Greed

In this article, I cover the second of the Six Rules of Investing, “Know the Short and Long Term Investment Environment”, which I introduced in the Mutual Fund Observer January Issue.

Here are the 6 Rules for Investing that I follow.

Rule #1: Develop a Financial Plan

Rule #2: Know the Short and Long Term Investment Environment

Rule #3: Manage Risk First

Rule #4: Invest Appropriate for the Business Cycle and Long Term Trends

Rule #5: Understand the Impact of Taxes on Investments

Rule #6: Develop a Simple Investment Process Based on Rules and Guidelines

The first section of this article looks at long term markets known as secular markets and the second part dives into cyclical markets. The final section looks at current trends in funds and categories that I rank based on the data from Mutual Fund Observer screens.

Why should we care whether the current bull market is in a secular bear market? Ed Easterling says that rowing works best in secular bear markets and sailing works best during secular bull markets. Mr. Easterling founded Crestmont Research and is the author of Probable Outcomes: Secular Stock Market Insights and Unexpected Returns: Understanding Secular Stock Market Cycles. These books were particularly enlightening for me when I began researching investment cycles. In Half & Half: Why Rowing Works, he explains that different approaches work well in secular cycles:

“Hedged portfolios outperform market portfolios in secular bear markets because of the disproportionate impact of losses relative to the gains required to recover losses. Most significantly, as the magnitude of the loss increases, the required recovery gain exponentially increases.

In secular bull markets, on the other hand, gains significantly overpower losses. So although cyclical swings deliver the occasional ‘correction,’ the recoveries far exceed the losses. The result is that above-average returns from sailing cumulatively exceed those from hedged rowing. In secular bear markets, however, gains across the secular period are cumulatively fairly modest or nonexistent. The result is that losses during secular bears well overpower the gains.”

Secular Markets – The Long Term Environment

With hindsight, if you read the following quote from Martin J. Pring on June 17th, 2006, would you have been better prepared for the housing bubble and financial crisis that were beginning to unravel?

“There are occurrences in the business cycle when the consensus of my proprietary primary trend indicators find themselves within the confines of the bearish camp. Unfortunately, now seems to be one of those occasions. The last time the technical, economic, and monetary indicators aligned themselves in such a negative way was the turn of the millennium. Then, as now, for the benefit of my subscribers, and their valued clients and investments, I feel duty-bound to publish a Special Report setting out the arguments for the impending scene about to unfold.

How did Mr. Pring know? We can improve our investment performance by being students of the market. To better understand the markets, I will start with secular trends. Here is a good definition of secular bear markets by Jurrien Timmer at Fidelity in 2013.

 “I define a secular bear market as a prolonged period spanning several business cycles of below-average—although not necessarily negative—nominal returns, an outright decline in real (inflation-adjusted) returns, and a sustained compression in price-to-earnings (P/E) ratios. By that definition, we’ve been in a secular bear market since 2000.”

The key to understanding long term trends is inflation and valuations. The following chart from Crestmont Research shows stock market returns for rolling 20 year periods. For example, the stock market returns for the twenty years prior to 200o was approximately 17% while the return over the past 20 years currently is about 7 percent. The red line is the change in the cyclically adjusted price to earnings ratio (CAPE) over the 20 year period. In the 20 years prior to 2000, the CAPE multiple increased by about 35 points while over the current 20 year period the CAPE has fallen by about 15 points. The chart in the lower left-hand corner shows the starting CAPE on the vertical axis compared to the returns over the next 20 years. With today’s CAPE at about 30, the returns over the next twenty years will be in the low single digits based on historical relationships.

Chart #1: Rolling 20-Year Stock Market Returns

Jill Mislinski produced the following chart for Advisor Perspectives that shows four different valuation methods are historically higher than over the past 120 years. Ms. Mislinski is the Research Director for Adviser Perspectives. She holds a Master of Science from the University of Chicago. Valuations are higher than prior to the 1929 stock market crash and the 2007 Great Recession, but lower than during the Technology Bubble.

Chart #2: Stock Market Valuations Are High

Another great chart by Jill Mislinksi shows that when the stock market is adjusted for inflation, it rises on average 1.86% per year. Chart #3 shows that the trend stays within ranges, and the current market is 30% higher than the trend, and at the high end of the trend. During the next recession, it will likely revert beyond 30% to the mean and fall further.

Chart #3: Inflation-Adjusted Stock Market Returns

Lance Roberts from Real Investment Advice published the following chart showing secular bull and bear markets since 1871. The key take away is that the current market is a cyclical bull market within a secular bear market, based on the CAPE. Mr. Roberts points out that the current bull market is driven largely by monetary policy leading to inflation of assets, and not from fundamental growth.

Chart #4: The Current Bull is in a Secular Bear Market

Both Ms. Mislinski and Crestmont Research show great charts of the impact of valuations on 10-year returns, but my favorite is the following chart by John Hussman which shows that future stock market returns over the next 12 years will be about zero-based on historical data. Dr. John Hussman is the president and principal shareholder of Hussman Econometrics Advisors.

Chart #5: Estimated 12 Stock Market Year Returns

The key take away from this section is that long term trends show that the current markets are highly valued which will result in lower returns over the next one or two decades. This calls for a more active and defensive approach to investing instead of the buy and hold that does so well during secular bull markets.

Cyclical Markets – The Medium Term Environment

In my view, the greatest way to optimize the positioning of a portfolio at a given point in time is through deciding what balance it should strike between aggressiveness/defensiveness. And I believe the aggressiveness/defensiveness should be adjusted over time in response to changes in the state of the investment environment and where a number of elements stand in their cycles.

Mastering the Market Cycle: Getting the Odds on your Side, Howard Marks

I built an Investment Model to estimate an allocation to stocks and bonds that takes a six-month look into the investment environment. It is based on over thirty indicators including stock and bond returns, leading and coincident indicators, the U.S. and global economic growth, financial risk, interest rates, monetary policy, valuations, inflation, among others. The main index is the dashed blue line. With interest rates falling, last year was a good year for bond returns. As the economy continues to improve bonds will be less attractive. On the positive side, financial risk is low, the stock market is surging, coincident activity is moderate, and housing is improving. On the negative side, corporate health, orders, construction, shipments, and leading indicators are negative. Productivity, income, and investments are declining. Gross domestic product is near its potential with tight labor markets suggesting further improvements in the economy will result in inflation. Valuations are high. The model estimates a defensive allocation to stocks.

Chart #6: Author’s Investment Model

John Butters updates market earnings and revenues for FactSet. I summarize below with a few excerpts.

For the fourth quarter, the S&P 500 is reporting a year-over-year decline in earnings of -2.1%, but year-over-year growth in revenues of 2.7%. Given the dichotomy in growth between earnings and revenues, there are concerns in the market about net profit margins for S&P 500 companies in the fourth quarter.

The blended net profit margin for the S&P 500 for Q4 2019 is 10.7%. If 10.7% is the actual net profit margin for the quarter, it will mark the first time the index has reported four straight quarters of year-over-year declines in net profit margin since Q4 2008 through Q3 2009.

Looking ahead, analysts see mid-single-digit earnings growth for Q1 2020 and Q2 2020.

The forward 12-month P/E ratio is 18.6, which is above the 5-year average and above the 10-year average.

The following two charts by Charles Schwab are of particular interest as they show that stock market prices far exceed the trends in profits and that many measures of inflation are higher than the Fed’s 2% target. They suggest keeping bond durations “slightly lower than average” and adding a small allocation to Treasury Inflation-Protected Securities.

Chart #7: Divergence of the S&P 500 and Corporate Profits

Chart #8: Inflation Estimates Are Higher Than Fed Targets

In the previously cited article, Mr. Hussman estimates that based on historical performance, a conventional 60% stock/40 bond portfolio will have a return near zero, before adjusting for inflation, over the next 12 years. Morgan Stanley also cautions investors that the return on a traditional 60% stock/40 bond portfolio could be in the low single digits over the next decade. Alpha Gen Capital is also of the opinion that a “60/40 portfolio is likely to produce much lower returns in the coming decades” as valuations and returns revert to the mean. Part of Alpha Gen Capital’s solution is to reduce exposure to equity while increasing yield from closed-end funds.

Similar to Mr. Easterling’s philosophy of rowing during secular bear markets and sailing during secular bull markets, Mr. Hussman describes an alternative approach to investing over the next decade.

 “Nothing demands that investors ‘lock-in’ the lowest investment prospects in U.S. history. The alternative that investors have is flexibility. The alternative they have is the capacity to imagine a complete market cycle. The alternative investors have is discipline – the willingness to lean away from risk when it is richly valued and unsupported by uniformly favorable internals, and to lean toward risk when a material retreat in valuations is joined by an improvement in the uniformity of market internals.”

The Current Environment – Rowing Instead of Sailing

Irrational exuberance is a state of mania. In the stock market, it’s when investors are so confident that the price of an asset will keep going up, they lose sight of its underlying value. The phrase was coined by former Federal Reserve Chairman Alan Greenspan in 1996. It’s also a book by Robert Shiller describing the 2000 stock market bubble.

Irrational Exuberance, Its Quotes, Dangers, and Examples, The Balance, Kemberly Amadeo

In Winning The Loser’s Game, Charles D. Ellis points out the disadvantages that individual investors face against the investment teams of professionals at investment companies. The best way to win is just not to play the game. In the current market that is “irrationally bullish” and highly valued, I choose to be more on Howard Marks’s “defensive” spectrum – to protect assets rather than speculate on the earnings catching up to market prices.

We don’t know what will cause the current bubble to burst or when it will occur, but the next quote is worth heeding to keep bond quality high.

With $9.2 trillion outstanding as of the end of 2018, the size of the corporate bond market in the U.S. rivals that of the mortgage-backed securities market. In this post, we argue that, although much of the post-crisis issuance has been in the investment-grade segment of the market, the large volume of issuance with a BAA credit rating may pose a financial stability concern. Moreover, the maturity and firm-characteristic mismatch between bonds with AAA and BAA ratings reduce the usefulness of the BAA – AAA spread as an indicator of investors’ aversion to credit risk.

What’s In AAA Credit Rating?, Liberty Street Economics, Federal Reserve Bank of New York

Each month, I extract data on about a thousand mutual funds available to individual investors, exchange-traded funds, and closed-end funds from Mutual Fund Observer. I rate funds and objectives based upon risk, risk-adjusted return, income, momentum and quality factors. Table #1contains the top Lipper Objective along with a representative component of the factors. I break them out by nine different buckets including inflation protection, global bonds and income, income and commodities.

Table #1 contains the top-ranked funds for each of the top-ranked Objectives broken out by Vanguard and Fidelity mutual funds and no-load, no-fee funds available through Charles Schwab, exchange-traded funds and closed-end funds. In the current market, I look to diversify away for U.S. equities and longer duration bonds into international funds, income, inflation protection and commodities. Table #2 contains the Top Ranked Funds for the Top Ranked Objectives in Table #1.

Table #1: Top Ranked Objectives (Jan 2018 – Dec 2019)

Source: Created by the Author Based on Mutual Fund Observer

Table #2: Top Rated Funds in Top Rated Objective

Source: Created by the Author Based on Mutual Fund Observer

Suppose that you prefer investing in mutual funds at Fidelity, how might a person build a portfolio based on this article? It would be a conservative portfolio with a tilt toward global funds, inflation-protected bonds, and possibly commodities. Table #3 contains the funds that I would choose and the metrics for the past 12 months. The funds highlighted in blue have the MFO Great Owl classification. The MFO Portfolio Tool classifies the portfolios as Conservative (MFO Risk = 2), with a maximum drawdown of 1.6% and an Ulcer Index of 0.5, yet the portfolio would have returned nearly 18% in 2019. The Martin Ratio is risk-adjusted returns and is a high 34 for the portfolio. Fidelity Strategic Real Return (FSRRX) is about a third inflation-protected bonds and a third commodities, however, the remainder is in floating rate bonds which appear to be lower quality. FIGFX, FSGGX, FIREX, and FPHAX are global funds.

Table #3: Hypothetical Fidelity Portfolio

Closing

John Maynard Keynes (1883 – 1946) was attributed with saying, “The market can stay irrational longer than you can stay solvent.” Institutions have increased money funds by $400 billion since April 2019.  They typically increase cash at the tops of markets prior to recessions. What I appreciate about Mutual Fund Observer is that it provides the tools to measure the risk and risk-adjusted performance of a portfolio.

Disclaimer

I am not an economist nor an investment professional. I became interested in economic forecasting and modeling in 2007 when a mortgage loan officer told me that there was a huge financial crisis coming. There were signs of financial stress if you knew where to look. I have read dozens of books on business cycles since then. Discovering the rich database at the St. Louis Federal Reserve (FRED) provides most of the data to create an Investment Model. The tools at Mutual Fund Observer provide the means for implementing and validating the Investment Model.

The Quality of Research

By Edward A. Studzinski

“Until life goes out

Memory will not vanish

But grow stronger

Day by day.”

   -Anonymous

Right after the end of the year, I was speaking with a friend who is a senior portfolio manager at a private, employee-owned, independent investment firm in New York, with approximately $450B in assets under management. As such they are not beholden to either public shareholders (and quarterly earnings) or a parent entity off in some other part of the world, with different and often conflicting priorities. In that conversation, I was grousing about what I saw as a marked deterioration in the quality of buy side investment research. This is driven by a generational shift to analysts who often feel they can learn all they need to know about a business or industry remotely. They do this by accessing information on their Bloomberg terminals as well as listening to company presentations on the internet or through conference calls.

Some of this I blamed on the desire of corporations to limit and control access to executives for reasons of time management. Moreover, there are also the twin requirements of governance and compliance with securities laws such as Regulation FD. And lastly, there is the huge increase in investment personnel seeking access for their research, either as shareholders, or alternatively, as prospective shareholders.

There is also the difficulty of gaining access to the desired individuals in senior management, since investment or analyst days tend to be held in locations such as Boston, New York City, or Los Angeles. Attendance at a day-long set of presentations and meetings often requires an additional two days of travel if one is not making use of private planes and the like. This is appreciated by anyone who has suffered through travel to New York recently, as New York City airports try to rise above being compared unfavorably to the Third World.

And finally, some of it is attributable to the hubris of investment managers. As a group, they often think there is little value in using their time for direct one-on-one contact with the chief executive officer or chief financial officer of a corporation at his headquarters. Alternatively, they often feel there is no value to sitting through a highly scripted set of presentations at an analyst day.

My friend disabused me of my prejudices quickly, as at his firm, analysts were still willing to travel and seek out meetings AT companies. Companies when they were coming to New York often called indicating that they would like to come into his firm’s offices and visit, either with current or potential shareholders. And finally, sometimes the analysts limited themselves to performing their due diligence remotely, which allows them to filter out both white noise and extraneous distractions. At day’s end, it came down to what methodology worked best for helping an analyst to obtain an understanding of a business or industry that gave a competitive edge to the firm and its investor clients.

I have another friend who has a much smaller shop and set of clients. But he also has more clearly defined and limited his circle of competency. This is a driving force in making him want to know more about his companies and their competitors in his tightly limited universe than others. And usually he is highly successful in that. But it requires constant discipline and focus. If there is an investor analyst day being given by an investment or industry he is interested in, he will arrive at the continental breakfast before anyone else. He will have previously identified the members of management that he is interested in meeting or speaking with. And over the course of that breakfast and on through the day he will be glued to the people he is interested in meeting and getting to know. This often causes a corollary as scuttlebutt, insights and snippets of information that don’t make their way into the Q&A for the masses. As a result of his constant striving for the informational edge, he has achieved superb long-term results for his clients. And since it is his firm and he is also beholden to no one, he gets to do things his way, making his fees all in all quite reasonable.

So how do you, as an investor, figure out whether the investment research methodology at a firm or fund is one you are comfortable with? Like many things, it’s not easy to get your head around. You can ask the question, but generally the marketing people at the custodian are going to give you the prospectus answer. How things are really done is more difficult to suss out. And while people will not necessarily lie, you won’t be able to determine that what they say they do isn’t what really is going on.

Probably the most valuable question you can ask is how the analysts are compensated. Some firms look at how many new ideas an analyst comes up with over a fiscal year, how many of them are invested in for clients (with invested asset totals), and what is the performance over the measurement period. What should follow is what is an appropriate measurement period for analyst’s universe? I am familiar with one firm where the organization’s “Guru” insisted that three years was adequate to know the good analysts from the bad. Humorously, a new research director was named and had the numbers redone but for longer periods of time. The four-year numbers almost totally reversed who was at the top and bottom from the three-year performance calculations. And for longer periods, the returns, as with fund returns, tended to smooth out with some degree of stability. Sadly the “Guru” refused to accept what the numbers showed. The resulting toxic environment caused the loss to the firm of two of its most talented thought leaders, an irreplaceable drain of intellectual capital. Those two individuals, tiring of the intellectual dishonesty and pre-vetting of ideas, went off to chart their own courses and are flourishing.

One of the most thoughtful analyses of this issue that I have seen was an interview in the “Graham and Doddsville Newsletter” of Columbia Business School, which in the Winter 2018 issue had an interview with C.T. Fitzpatrick of Vulcan Value Investors. Fitzpatrick indicated that while the focus of his team’s analysis is quantitative, the thing they spend the most time on and where they feel they add value is on the qualitative aspects of valuation. Specifically, they are looking for companies that have a sustainable margin of safety, that they would feel comfortable owning for five years if the public markets were closed. To that end, they have a universe of approximately five hundred names that are followed that meet their criteria. All names are not invested in currently, especially as the discount to valuation needed to purchase is not there. But because the businesses have the criteria they search for, they are all followed. He indicated that analysts are rewarded for adding names to that universe, and doubly rewarded for removing names from that universe. But no one is rewarded for following companies that are currently owned, as there is group involvement in looking at the companies. Someone who is following a company that is owned (maintenance coverage) is not going to be rewarded just for being around when the discount widened to the point where it could be bought.


Choppy Markets or Black Swans

The shift from active managers to passive was already making life interesting in the investment world.

The concern about coronavirus from China and its impact on economies and countries is an unknowable, no matter what the investment style. In the year-end Barron’s Roundtable interviews, when James Anderson of Baillie Gifford (another independent, employee-owned investment firm in Scotland, again beholden to no one) was asked what in his forecasts he saw for 2020, he said: “One of the main reasons, if not THE main reason, that active managers have struggled is because they ask these types of questions, with unknowable answers, where they have a very low probability of being right, and a low connection to the stock markets. It would be better for us all to concentrate on the underlying structural changes in the economy.”

He went on to say that he was optimistic, as over the next ten years, disruptive activity will accelerate, presenting great investment opportunities in equities.

We can’t know what will happen with coronavirus. But one would be better advised to think about it as a disruptive activity, like certain aspects of technology, and be prepared to seek out and take advantage of opportunities as they arise. Burying one’s head in the sand is not an investment strategy. Put differently, as Warren Buffett has often said, where others are fleeing, look at and examine whether it is where you should be looking to invest. But not everyone has the constitutional and intellectual makeup to run towards the fire, rather than away from it.

Biggest Bang for your Buck

By David Snowball

20 Equity funds with the best capture ratios over the entire market cycle

Capture ratio is a sort of “bang for your buck” summary. It’s calculated by dividing a fund’s upside capture (a fund that typically rises 1.1% when the market rises 1% has an upside capture of 1.10) by its downside capture (a fund that typically falls 1.1% when the market falls 1% has a downside capture of 1.10). Capture ratios greater than 1.0 reflect funds that produce more gains than losses; all other things being equal, high capture ratio funds are offering you the greatest reward for every unit of risk you’ve been subjected to.

Capture ratios even the playing field for cautious and aggressive investors. A cautious investor might look for a fund with a downside capture of no more than 0.80. Given that constraint, anything above 1.0 is a winner! Aggressive investors might be willing to accept downside captures of 1.10 as long as they’ve been duly compensated. So, for them too, anything above 1.0 is a winner.

I screened for:

    1. equity-oriented domestic funds, which included “flexible portfolios” and “aggressive allocation” funds but excluded global,
    2. with a capture ratio 1.0 or greater,
    3. with a downside capture ratio of 0.9 or less,
    4. over the entire market cycle, including both the 2007-09 crash and the 2009-present bull.

I excluded closed funds and high-minimum ones. I also excluded Copley Fund (COPLX), historically a freakishly excellent fund that lost its manager of 40 years recently. All data is current as 0f 12/31/2019.

Here are the ten best funds, ranked in order of descending capture.

Yacktman Focused (YAFFX)

Capture 1.3

Downside capture 0.70

APR 10.9%

Great Owl

Monetta Core Growth (MYIFX)

Capture 1.2

Downside capture 0.89

APR 11.6

Reynolds Blue Chip (RBCGX)

Capture 1.2

Downside capture 0.80

APR 11.0

The appeal of the Reynolds BCG fund is almost entirely driven by its performance during the 2007-09 crash. It appears to have been almost entirely in cash and simply sailed through it. $10,000 invested in RBCGX at the peak of the last market would be worth $36,000 today, the same investment in the S&P 500 index would be $26,000. Since then it’s been entirely uninspiring.

Parnassus Core Equity (PRBLX)

Capture 1.17

Downside capture 0.79

APR 10.1

Great Owl

It, along with the Yacktman funds, are the only funds in the lower downside capture group to exceed 10% annual returns over the full market cycle. It adds the attraction of a long-standing commitment to an ESG-screened portfolio.

Provident Trust (PROVX)

Capture 1.17

Downside capture 0.79

APR 10.1

Madison Dividend Income (BHBFX) ($25,000 minimum, $500 for an IRA but $100 at Schwab)

Capture 1.20

Downside capture 0.66

APR 8.9

Great Owl

Bruce (BRUFX)

Capture 1.2

Downside capture 0.58

APR 7.5

Great Owl

AMG Chicago Equity Partners Balanced (MBEAX)

Capture 1.2

Downside capture 053

APR 6.9

Intrepid Endurance (ICMAX)

Capture 1.2

Downside capture 0.46

APR 6.2

I hesitated to include ICMAX despite its long-term record. I love the absolute-value discipline and willingness to hold cash until the market offers rationally priced stocks. Cash is down to 42% of the portfolio now. That said, it’s made about 1% a year over the past 3- and 5-year periods and has undergone three sets of manager turnovers: Cinnamond to Wiggins to the current team, with president Mark Travis in and out, in and out.

Investors consciously looking to keep their downside capture as low as they can, would start with the Yacktman and Madison funds but might add . . .

First Trust Value Dividend ETF (FVD)

Capture 1.17

Downside capture 0.72

APR 9.2

Great Owl

Prospector Opportunity (POPFX)

Capture 1.14

Downside capture 0.75

APR 9.0

Great Owl

The international version of the list is a bit more challenging. Many of these funds focus on a niche, which makes the statistical analysis iffy. The capture ratios are computed against a broad international average, just as the domestic capture ratios are captured against the broad S&P 500 index. If their niche is too far afield from a broad index (for example, MAPIX or any of the funds with “small” in the name), you might find that they have major drawdowns which simply don’t correlate with the index.

Matthews Asia Dividend (MAPIX)

Capture 1.4

Downside capture 0.59

APR 7.0

First Eagle Overseas (SGOVX)

Capture 1.3

Downside capture 0.52

APR 4.5

Forester Discovery (INTLX)

Capture 1.3

Downside capture 0.36

APR 3.1

Buffalo International (BUFIX)

Capture 1.2

Downside capture 0.82

APR 5.0

Great Owl

Driehaus International Small Cap Growth (DRIOX)

Capture 1.2

Downside capture 0.81

APR 4.9

Harding Loevner International Small Companies (HLMRX)

Capture 1.2

Downside 0.80

APR 5.5

Aberdeen International Small Cap (WVCCX)

Capture 1.2

Downside 0.76

APR 5.0

BNY Mellon International Stock (DISAX)

Capture 1.2

Downside 0.73

APR 4.9

Tweedy Browne Global Value (TBGVX)

Capture 1.2

Downside 0.57

APR 4.2

Great Owl

Bottom Line:

Statistical screens offer leads, not answers. Your next step is understanding the portfolio behind the excellent numbers. Lewis Braham, a very good financial journalist and frequent contributor to MFO’s discussion board, argues:

I think it is important to analyze sector exposures within funds that performed in the last cycle and analyze how those sectors might perform in the next cycle. Yacktman, for instance, has long held exposure in consumer defensive or staples stocks such as Proctor & Gamble, Coca-Cola, Pepsi, Johnson & Johnson in addition recently to a large slug in Samsung.

The question to ask is has anything changed in the commercial outlook for such steady-eddies? I would argue for instance a lot has changed for a company like Proctor & Gamble as thanks to the Internet the competitive landscape for purchases like razor blades and soap is different. The question then becomes is the money manager aware of these changes. In Yacktman’s case, I think the answer is “yes,” from my experience with them.

Yet just because you’re aware of significant changes in the mainstays of your portfolio, doesn’t mean you have figured out what suitable replacements might be yet. That can be quite challenging.

Looking Under the Hood at Holdings

By Charles Boccadoro

“Don’t trust everything you see. Even salt looks like sugar.” ― Anonymous

The MFO Premium site now has fund holdings; specifically, top-ten holdings for equities and fixed-income securities, countries, and main industry sectors … thanks to our expanded Lipper (now Refinitiv) Global Data Feed.

What’s more, all are searchable with the site’s main tool MultiSearch. Here’s a screenshot of the new holdings metrics on the search page:

How many funds own Berkshire Hathaway as a top ten? 492. A lot!

The company is itself a top-ten U.S. large cap. There are 163 large cap index funds, which means most of the owners are “active” managers. Of these, American Funds Balanced (ABALX) and Fidelity Contrafund (FCNTX) are the two largest.

One fund, Check Capital’s Blue Chip Investor (BCIFX), has more than a third of its holdings in BRK.A, or 34.2%. It charges investors 1.16% per year. (I have a good idea on how investors in the fund could reduce their expense ratio by 40 basis points … a year!)

Speaking of Berkshire Hathaway, how many funds have Apple (AAPL) as a top position? 1219, including 869 active (non-index) funds.

One last: How many funds own Apple, Microsoft, and Alphabet (Google)?  869, including 530 active funds. Here are the lifetime risk and return summary metrics for the largest five, with T Rowe Price’s Blue Chip Growth (TRBCX) in top spot:

This new feature in MultiSearch now makes it pretty easy to look for holdings overlap in the broad swath of fund offerings today … more than 12,000!

Similarly, we’ve also added several new purchase and portfolio metrics, at the request of subscribers, including growth, capital gains, and quality. Here’s a summary of portfolio metrics now available in MultiSearch, nearly all searchable:

  • Managed Volatility – Employs strategy to mitigate volatility, including but not limited to risk parity, minimum volatility and fundamental.
  • Cash – Cash portfolio asset allocation.
  • Equity – Equity portfolio asset allocation.
  • Bond – Bond or fixed income portfolio asset allocation
  • No. of Holdings – Number of holdings in portfolio.
  • Holdings Weight – Weight of top ten holdings, based on portfolio value, %.
  • Turnover – Fund assets that were sold during the most recent fiscal year.
  • Cap Avg – Dollar-weighted average market capitalization of equities within the portfolio.
  • P/B – Latest price-to-book value of equities within the portfolio, per share, dollar-weighted average.
  • P/E – Latest price-to-earnings of equities within the portfolio, per share, dollar-weighted average, trailing 12 mo.
  • P/S – Latest price-to-sales ratio of equities within the portfolio, per share, dollar-weighted average, trailing 12 mo.
  • P/C – Latest price-to-cash flow ratio of equities within the portfolio, per share, dollar-weighted average, trailing 12 mo.
  • D/E – Total debt to total market capitalization ratio of equities within the portfolio, latest quarter, dollar-weighted average.
  • ROA – Average annual return on assets [ROA, net income divided by total assets] of equities in portfolio over past three years, dollar-weighted average, %/yr.
  • ROC – Average annual return on capital [ROC, earnings before interest and taxes divided by capital employed plus short-term loans minus intangible assets] of equities in portfolio over past three years, dollar-weighted average, %/yr.
  • ROE – Average annual return on equity [ROE, net income divided by common stockholder equity] of equities in portfolio over past three years, dollar-weighted average, %/yr.
  • ROI – Average annual return on investment [ROI, income after taxes divided by the average total long-term debt and other liabilities and shareholder’s equity] of equities in portfolio over past three years, dollar-weighted average, %/yr.
  • Cash Growth – Compound annual growth of total cash flow growth from operations of equities in portfolio over past three years , dollar-weighted average, %/yr.
  • EPS Growth – Compound annual growth of earning per share [EPS] of equities in portfolio over past three years, dollar-weighted average, %/yr.
  • Sales Growth – Compound annual sales growth of equities in portfolio over past three years, dollar-weighted average, %/yr.
  • Sales/Share Growth – Compound annual sales per share (SPS) growth of equities in portfolio over past three years, dollar-weighted average, %/yr.
  • Dividend Growth – Compound annual dividend per share (DPS) growth of equities in portfolio over past three years, dollar-weighted average, %/yr.
  • Yield – Dividend payout over past 12 months.
  • Dividend Frequency – Frequency of fund dividend distribution.
  • Dividend Payout Ratio – Dividends paid to earnings made of equities in portfolio, dollar-weighted average, trailing 12 mo, %.
  • Effective Maturity – Dollar-weighted measure of maturity of bonds in portfolio, calculated to first call or effective life.
  • Quality – Relative credit quality of bonds in portfolio, based on dollar-weighted average.

Another new feature is the ability to screen for Multi-Year Ratings, which now makes it convenient to apply the criteria discussed in last month’s post: “MFO Premium’s Best Fund of the Decade.” Here’s a screenshot of the new selection criteria:

One final upgrade worth calling attention to: Ferguson Ratings! We first exposed readers to terms like “Outperformance Measure” and “Consistency Index” in last year’s piece, entitled “Introducing Ferguson Metrics.”  Adding ratings now enables users to search for top (or other) quintile Ferguson metrics.

These metrics can be combined with the nearly 100 other metrics in the screener to develop some pretty compelling candidate fund lists. For example, there are 68 mutual funds that have combined 3, 5, and 10-year top quintile performance for both Ferguson’s outperformance ansd consistency metrics, plus absolute return, risk adjusted return, and rolling average return.

I’ll coin them: Ferguson MFO Premium Select Funds. (Thank you Brad!) Here are the top five performers this past decade, based on absolute return, which includes Akre Focus Retail (AKREX):

Please enjoy these new data and search features.

FAM Dividend Focus (FAMEX) Prior to 2019, this was FAM Equity-Income, February 2020

By David Snowball

Objective and strategy

The strategy attempts to provide current income as well as long-term capital appreciation by investing primarily in stocks that pay dividends. The managers think of themselves as value investors and attempt to answer the question, “if I could buy the whole company at these prices, would I?” That means calculating its “true business worth” and comparing that to the current stock market cap. They attempt to remain fully invested in stocks and convertibles. They tend to buy mid-caps, though their willingness to let winners run means that the portfolio has a fair large-cap component. The portfolio is compact and relatively low turnover.

Adviser

Fenimore Asset Management. Fenimore was founded by the Putnam family in 1974 and is headquartered in Cobleskill, New York. The firm advises three mutual funds and the Private Fund (which appears to have no name other than “the Private Fund”), as well as a variety of separately managed accounts. The firm appears to be steadily growing and managing a transition to a new generation of senior leadership. The firm reports total assets of $3 billion (as of September 30, 2018) and Morningstar reports total mutual fund assets of $2 billion (as of December 31, 2019).

Manager

Paul C. Hogan and Thomas O. Putnam. Mr. Hogan joined the firm in 1996 and handles the day-to-day management of the portfolio. Mr. Putnam founded Fennimore and is listed as co-manager on each of the firm’s three funds, but has reduced his firm-wide role in the past year as part of a long-planned management transition. Both managers have served since inception.

Management’s stake in the fund

Each of the managers has invested over $1 million in the fund. Mr. Putnam is by far the fund’s largest shareholder, contributing 8.6% of its assets, per the most recent SAI. In addition, every member of the Board of Trustees has a substantial investment in the fund.

Active share

95.6. “Active share” measures the degree to which a fund’s portfolio differs from the holdings of its benchmark portfolio. High active share indicates management which is providing a portfolio that is substantially different from, and independent of, the index. An active share of zero indicates perfect overlap with the index, 100 indicates perfect independence. The “active share” research done by Martijn Cremers and Antti Petajisto finds that only 30% of U.S. fund assets are in funds that are reasonably independent of their benchmarks (80 or above) and only a tenth of assets go to highly active managers (90 or above).

FAMEX has an active share of 95.6, which reflects a very high degree of independence from the benchmark assigned by Morningstar, the iShares Russell Mid-Cap.

Opening date

April 1, 1996

Minimum investment

$500

Expense ratio

1.23% on assets of $611.1 million, as of July 2023. 

Comments

If we were to write an article entitled, “The Best Fund You Aren’t Invested In,” there’s about a 50/50 chance that it would be an article about FAM Dividend Focus. That suspicion arises from the fact that FAM Dividend Focus has appeared in so many MFO articles on funds with exceptional, and exceptionally risk-aware, performance. Those include:

Learning from the fall fall,” April 2019. The market crashed in the fourth quarter of 2018, then recovered by the end of the first quarter of 2019 and we identified the ten funds (well, nine funds and an ETF) that had the best risk-adjusted performance during that mini-cycle. FAMEX is there.

Overachieving defenders: Your late-cycle shopping list,” August 2019. There are tensions between short- and long-term excellence, and between pure and risk-adjusted returns. We looked for equity-oriented funds on both the MFO Honor Roll (top 20% pure returns over 1, 3 and 5 years) and its Great Owls list (top 20% risk-adjusted returns for 3, 5, and 10 years), which has been for the whole market cycle. 1944 equity-oriented funds were old enough, only 13 – 0.06% – made the cut. FAMEX is there.

“We’re here because you’re looking for the best of the best of the best, sir!” January 2020. We identified the 10 best equity-oriented funds of the past decade based on each of three different downside measures. Downside deviation: FAMEX is #5 (of thousands). Downmarket deviation: #6. Bear market deviation: #5.

FAMEX is also a Great Owl. It’s an MFO Honor Roll fund. It has a five-star rating from Morningstar. Though Morningstar’s analysts stopped covering the fund in 2010 (the last analyst report forecast “middle of the pack” returns for 2010-20 which turned out to be “top 7% returns”), their machine-learning model assigns it a Silver rating. It is a Lipper Leader for every trailing period for total returns, consistency, and preservation of returns.

  Total return Consistent return Preservation
3 year 5 / 5 5 / 5 5 / 5
5 year 5 / 5 5 / 5 5 / 5
10 year 5 / 5 5 / 5 5 / 5
Overall 5 / 5 5 / 5 5 / 5

(ratings as of 12/31/2019)

In general, Lipper’s equity-income group is the home of many of the industry’s ETFs and funds with the best long-term risk-adjusted rewards. That seems to be driven by the fact that equity-income funds invest a lot in dividend-paying firms which are often less sexy, less volatile, more seasoned and more stable than average.

Here is the 20-year performance of FAMEX against a strong peer group.

  20-year equity-income group average FAMEX Rank
Total return 7.0% 9.7% #1 of 44 funds
Batting average 50 57 #2
36-month rolling average 7.5 8.9% #6
       
Sharpe ratio 0.40 0.61 #3
Sortino ratio 0.57 0.91 #3
Martin ratio 0.44 0.71 #5
Capture ratio 1.11 1.34 #2
       
Downside dev 9.7 8.9 #12
Bear market dev 11.1 7.9 #12
Down month dev 11.9 8.5 #12
       

Here’s how to read that chart. The fund has returned, on average, 9.7% annually over the past 20 years. That’s the best in its class. It beat its peer group in 57% of all months over the past 20 years, which we take as a measure of its consistency and which is #2 in its group. The 36-month rolling average looks at every 36 month period for the last 20 years and calculates the average return you might expect if you held the fund for three years; FAM averages 8.9% annually, measured over 205 36-month rolling periods.

The next four entries are risk-return measures. Martin is the most risk-averse of the three, then Sortino and then the widely used Sharpe ratio. In each case, it’s a top-five fund. Capture ratio simply divides the percentage of the market’s downside captured by the percentage of the upside captured. So if you fall 0.66% when the market falls 1.0%, you’ve got a downside capture of 0.66. If you rise 0.9 when it rises 1.0, you’re at 0.9 on the upside. 0.9 on the upside divided by 0.66 on the downside gives you a capture ratio of 1.36. In general, any capture ratio above 1.0 means you’re winning, and FAMEX is the second-best capture ratio in its group.

The final set of calculations show how the fund performed on three measures of downside performance: downside deviation which measures “day-t0-day” downside, down month deviation measures downside in any month where the market was even a little bit negative and bear month deviation measures performance when the market fell 3% or more. In each case, FAMEX was 12th of 44 funds.

What do they do?

Everything above answers the question, how do they do? The more fundamental question is “what do they do” since that explains both their performance and their potential relevance to your portfolio.

Here’s the secret strategy: “The Dividend Focus Fund invests primarily in dividend-paying, mid-cap companies that have a history of consistently growing their dividend over time.”

It’s a low turnover strategy where the managers have learned to let their winners run a bit, but where they’re also pretty quick to eliminate firms whose prospects have fallen.

Hmmm … typically 30-4o stocks. Almost all domiciled in the US. About three times likelier to have a defensible “wide moat” than the average fund in its Morningstar mid-cap peer group. Also better financial health, higher returns on capital, greater growth and stronger profits than its Morningstar peers.

Bottom Line

There’s a lot to like here. Three things stand out:

    1. a consistent and understandable investment discipline: it’s been 45 years of “buy stock in quality companies with strong financials run by superb management teams at prices below what we estimate the businesses are worth.”
    2. an extraordinarily stable management team: both guys have been on board since inception, 23 years ago.
    3. extraordinary levels of insider ownership: the research unequivocal, it’s really good when the manager’s money is invested alongside yours and it’s even better when his boss’s money is invested alongside yours. (It turns out that the prospect of losing your boss’s or your mother-in-law’s money wonderfully focuses the mind and instills prudence.) The ownership among members of the board of trustees is very high, which is rare.

That’s translated to exceptional returns, delivered by extra-ordinary consistency and exemplary caution. Given especially the rich and accessible writing provided by the adviser, conservative equity investors owe it to themselves to look closer.

Fund website

FAM Funds. It’s a very clean, well-designed website with a lot of approachable content. By “approachable,” I mean that it’s more about the people and the process than about providing reams of obscure stats and “mountain charts.” I’d commend, especially, Lewis Braham’s very fine piece from the December 4, 2019 issue of Barron’s, “This fund manager has beaten 99% of his peers. Here’s how he picks winning dividend stocks.”

Funds in Reg

By David Snowball

The funds in registration with the SEC in January will launch right around April Fool’s Day. For some, that’s probably foreshadowing.

Two particularly interesting sets of launches:

American Century has debuted two actively-managed, non-transparent ETFs, both with ESG screens.

WCM is launching three new funds, all international, all quality-focused, two explicitly ESG-focused. WCM has a really outstanding, off-the-radar record. The non-ESG versions of these funds are both five-star and Great Owl funds. They deserve to be taken quite seriously.

American Century Mid Cap Growth Impact ETF

American Century Mid Cap Growth Impact ETF (MID), an actively-managed non-transparent ETF, seeks long-term capital growth. The plan is to invest in 20-40 midcap stocks that (a) are posed to sustainable growth and (b) conformity with United Nations Sustainable Development Goals. The fund will be managed by Rob Brookby, Rene P. Casis, and Nalin Yogasundram. Its opening expense ratio has not been disclosed.

American Century Sustainable Equity ETF

American Century Sustainable Equity ETF, an actively-managed, non-transparent ETF, seeks long-term capital growth. The plan is to use a quant model to buy large cap, ESG-screened GARP-y stocks. The fund will be managed by a five-person team from American Century. Its opening expense ratio has not been disclosed.

Blueprint Growth Fund

Blueprint Growth Fund will seek capital appreciation while managing risk. The plan is to construct a portfolio using both individual securities and various sorts of funds (OEFs, CEFs, ETFs). It will be multi-asset and, so far as I can tell, momentum-based. The fund will be managed by Jon Robinson and Brandon Langley of Blueprint Investment Partners. Its opening expense ratio is 1.63%, and the minimum initial investment will be $5,000.

First Trust TCW Securitized Plus ETF

First Trust TCW Securitized Plus ETF, an actively-managed ETF, seeks maximize long-term total return. The plan is to buy asset-backed securities. Two small twists on the vanilla strategy: up to 50% might be non-investment-grade and 25% might be in derivatives used to hedge the portfolio. The fund will be managed by a four-person TCW team. Its opening expense ratio has not been disclosed.

Hartford Schroders China A Fund

Hartford Schroders China A Fund will seek long-term capital appreciation. The plan is to invest in the “A” class shares of Chinese firms based on several criteria: “the likelihood of the company to grow shareholder value in the long term; the return on invested capital of the company; the relative valuation of the company; the quality of the company, including the sustainability of its business model; and whether the company has any proprietary competitive advantages.” The fund will be managed by an as-yet undisclosed person or team. Its opening expense ratio has not been disclosed, and the minimum initial investment  will be $2,000 for the fund’s own “A” shares.

Leader Government Bond Fund

Leader Government Bond Fund  will seek to “maximize total return consistent with income generation and prudent investment management.” (One wonders how many funds don’t advertise a commitment to “prudent investment management”? One so rarely sees, “give us your money quick, the plane leaves for Vegas in an hour!”) The plan is to buy Treasuries and agency mortgage-backed securities (that is, securities based on pools of Fannie Mae-backed mortgages). The fund will be managed by John E. Lekas, founder of Leader Capital. Its opening expense ratio has not been disclosed, and the minimum initial investment will be $2,500.

Syntax Stratified U.S. Hedged Equity ETF  

Syntax Stratified US Hedged Equity ETF, an actively-managed ETF, seeks seeking risk-managed growth. It’s competing with the S&P 1500 and is hoping to be less volatile than the index. It’s going to be a fund of Syntax Stratified ETFs plus put options for hedging. The fund will be managed by the Vantage Consulting Group (the equity portion) and Swan Global Investments (the options portfolio). Its opening expense ratio has not been released.

USCF Energy Strategy Absolute Return Fund

USCF Energy Strategy Absolute Return Fund, an actively-managed ETF, will seek long-term total return. The plan is to buy futures contracts including, but not limited to, WTI crude oil, Henry Hub natural gas, NY Harbor ultra-low sulfur diesel (formerly heating oil), RBOB gasoline, Brent crude oil and gasoil. The fund will be managed by John Love and Ray Allen of USCF Advisers. Its opening expense ratio might be 0.75% (the number is in bracketed in the prospectus, which makes it seem tentative).

WCM China Quality Growth Fund

WCM China Quality Growth Fund will seek long-term capital appreciation. The plan is to invest in 35-50 which quality Chinese growth companies which: “(i) have a history of predictable and consistent earnings growth; (ii) have regular, growing dividend payments; (iii) be industry leaders with sustainable competitive advantages; (iv) have corporate cultures emphasizing strong, quality and experienced management; (v) have little or no debt; (vi) have attractive relative valuations; and (vii) have potential for asset base growth.” The fund will be managed by Michael Tian. Its opening expense ratio has not been disclosed, and the minimum initial investment will be $1,000.

WCM Focused ESG Emerging Markets Fund

WCM Focused ESG Emerging Markets Fund will seek long-term capital appreciation. The plan is to invest in 25-50 quality growth companies that have passed growth, valuation and ESG screens. The fund will be managed by Pablo Echavarria and Rolf Kelly. Its opening expense ratio has not been disclosed, and the minimum initial investment will be $1,000.

WCM Focused ESG International Fund

WCM Focused ESG International Fund will seek long-term capital appreciation. The plan is to invest in 30-60 quality growth companies, in both developed and developing markets, that have passed ESG, growth and valuation tests. The manager prioritizes reduced greenhouse gas emissions in the portfolio construction process. The fund will be managed by Pablo Echavarria and Rolf Kelly. Mr. Echavarria has worked at both Thornburg and Turner as an equity analyst and portfolio manager. Its opening expense ratio has not been disclosed, and the minimum initial investment will be $1,000.

Manager Changes, January 2020

By Chip

Every month we track changes to the management teams of equity, alternative and balanced funds, along with a handful of fixed-income ones. Why “a handful”? Because most fixed-income funds are such sedate creatures, with little performance difference between the top quartile funds and the bottom quartile, that the changes are not consequential. Even in the realms we normally cover, the rise of management committees dilutes the significance of any individual’s departure or arrival.

Chip tracked down 74 funds with manager changes this month. Most of the changes are low-key, though it is interesting that Oakmark (OAKMX) has added another co-manager.

Ticker Fund Out with the old In with the new Dt
TNYAX 1290 Global Talents Fund Mark Beveridge will no longer serve as a portfolio manager for the fund. Alwi Chan, Kenneth Kozlowski, and Anne Tolmunen will continue to manage the fund. 1/20
WLDR Affinity World Leaders Equity ETF Effective immediately, Pushkar Murthy no longer serves as a portfolio manager. Gregory Lai, continues to serve as a portfolio manager of the fund. 1/20
PALAX AllianzGI Global Allocation Fund Giorgio Carlino is no longer listed as a portfolio manager for the fund. Carl Pappo joins Paul Pietranico, Rahul Malhotra, Heather Bergman, and Huy Thanh Vo on the management team. 1/20
MRLTX AMG Renaissance Large Cap Growth Fund No one, but . . . Andy Eng joins Michael Schroer in managing the fund. 1/20
MEMKX BNY Mellon Emerging Markets Fund Sean Fitzgibbon, Jay Malikowski, and George DeFina are no longer listed as portfolio managers for the fund. Julianne McHugh and Chris Yao will now manage the fund. 1/20
CAMIX Cambiar International Equity Fund Jennifer Dunne will no longer serve as a portfolio manager for the fund. Brain Barish, Anna Aldrich, Andrew Baumbusch, Alvaro Shiraishi, and Todd Edwards will continue to manage the fund. 1/20
CAMFX Cambiar International Small Cap Fund Jennifer Dunne will no longer serve as a portfolio manager for the fund. Brain Barish, Alvaro Shiraishi, and Todd Edwards will continue to manage the fund. 1/20
HFXAX Catalyst Hedged Futures Strategy Fund Edward Walczak will no longer serve as a portfolio manager for the fund. Scott Kimple and Mark Adams will now manage the fund. 1/20
HFXIX Catalyst/Warrington Strategic Program Edward Walczak will no longer serve as a portfolio manager for the fund. Scott Kimple and Mark Adams will now manage the fund. 1/20
CCSZX Columbia Commodity Strategy Fund David Donora and Nicolas Robin will no longer serve as portfolio managers for the fund. Matthew Ferrelli and Marc Khalamayzer now manage the fund. 1/20
DBALX Davenport Balanced Income Fund On December 31, 2019, David M. West retired and is no longer listed as a portfolio manager for the fund. Joel Ray, Kevin Hopkins, Jr., and Christopher Pearson have joined Michael Beall, John Ackerly, E. Trigg Brown, Robert Giles, Charles Gomer, Christopher Kelly, and George Smith on the management team. 1/20
DAVPX Davenport Core Fund On December 31, 2019, David M. West retired and is no longer listed as a portfolio manager for the fund. Joel Ray and Christopher Pearson have joined Michael Beall, John Ackerly, E. Trigg Brown, Robert Giles, and George Smith on the management team. 1/20
DVIPX Davenport Value & Income Fund On December 31, 2019, David M. West retired and is no longer listed as a portfolio manager for the fund. Joel Ray and Christopher Pearson have joined Michael Beall, John Ackerly, E. Trigg Brown, Robert Giles, and George Smith on the management team. 1/20
DMCRX Driehaus Micro Cap Growth Fund No one, but . . . Prakash Vijayan joins Jeffrey James and Michael Buck on the management team. 1/20
DVSMX Driehaus Small Cap Growth Fund No one, but . . . Prakash Vijayan joins Jeffrey James and Michael Buck on the management team. 1/20
DNREX Dunham Real Estate Stock Fund David Wharmby will no longer serve as a portfolio manager for the fund. Burland East and Creede Murphy now manage the fund. 1/20
ETHIX Eaton Vance High Income Opportunities Fund Michael Weilheimer is no longer listed as a portfolio manager for the fund. Jeffrey Mueller, Kelley Baccei, and Stephen Concannon will continue to manage the fund. 1/20
AEPGX EuroPacific Growth Fund No one, but . . . Noriko Chen and Gerald Du Manoir join the other nine managers on the team. 1/20
FAGNX Fidelity Advisor Energy Fund John Dowd will no longer serve as a portfolio manager for the fund. Maurice FitzMaurice now manages the fund. 1/20
FDFAX Fidelity Select Consumer Staples Fund No one, but . . . Ben Shuleva joins Nicola Stafford in managing the fund. 1/20
FSENX Fidelity Select Energy Fund John Dowd will no longer serve as a portfolio manager for the fund. Maurice FitzMaurice now manages the fund. 1/20
FBSAX Franklin Mutual U.S. Value Fund No one, but . . . Srini Vijay joins Grace Hoefig in managing the fund. 1/20
FRVLX Franklin Small Cap Value Fund No one, but . . . Nicholas Karzon joins Steven Raineri and Christopher Meeker in managing the fund. 1/20
GFRAX Goldman Sachs High Yield Floating Rate Fund Effective immediately, Ken Yang will no longer serve as a portfolio manager for the fund. Rachel Golder and Peter Campo will continue to serve as portfolio managers for the fund. 1/20
HMIAX Hancock Horizon Microcap Fund Anthony Slovick no longer serves as a portfolio manager for the fund. Steven Solomon will continue to manage the fund. 1/20
HJIGX Hardman Johnston International Growth Fund Michael Mufson, Ezra Samet, and Donald Smith are no longer listed as portfolio managers for the fund. Cassandra Hardman, James Pontone, and Henry Woo will now manage the fund. 1/20
HRSVX Heartland Select Value Fund No one, but . . . Troy McGlone, Vice President of Heartland Advisors, has joined the team of Will Nasgovitz and Colin McWey in managing the fund. 1/20
HISIX Homestead International Equity Alexander Walsh has retired and Scott Crawshaw is no longer listed as a portfolio manager for the fund. Ferrill Roll, Andrew West, Brian Lloyd, and Patrick Todd will continue to manage the fund. 1/20
IMAAX Ivy Apollo Multi-Asset Income Fund George Noon and Philip Sanders are no longer listed as portfolio managers for the fund. Dan Hanson, Ben Lentz, and Paul Meierdierck join the other eight managers on the team. 1/20
IVJAX Ivy International Small Cap Fund Seamus Kelly is no longer listed as a portfolio manager for the fund. Kalle Huhdanmäki joins Bryan Mattei and Martin Fahey in managing the fund. 1/20
IREAX Ivy LaSalle Global Real Estate Fund George Noon is no longer listed as a portfolio manager for the fund. Ben Lentz and Paul Meierdierck join Matthew Sgrizzi and Lisa Kaufman on the management team. 1/20
IRBAX Ivy Pictet Targeted Return Bond Fund Thomas Hanson is no longer listed as a portfolio manager for the fund. Andres Sanchez Balcazar, David Bopp and Ella Hoxha will continue to manage the fund. 1/20
JAVAX James Aggressive Allocation Fund Matthew Watson will no longer serve as a portfolio manager for the fund. R. Brian Culpepper, David James, Barry James, Ann Shaw, Brian Shepardson, and Trent Dysert will continue to manage the fund. 1/20
GLRBX James Balanced: Golden Rainbow Fund Matthew Watson will no longer serve as a portfolio manager for the fund. R. Brian Culpepper, David James, Barry James, Ann Shaw, Brian Shepardson, and Trent Dysert will continue to manage the fund. 1/20
JMCRX James Micro Cap Fund Matthew Watson will no longer serve as a portfolio manager for the fund. R. Brian Culpepper, David James, Barry James, Ann Shaw, Brian Shepardson, and Trent Dysert will continue to manage the fund. 1/20
JASCX James Small Cap Fund Matthew Watson will no longer serve as a portfolio manager for the fund. R. Brian Culpepper, David James, Barry James, Ann Shaw, Brian Shepardson, and Trent Dysert will continue to manage the fund. 1/20
LDMAX Lord Abbett Emerging Markets Bond Fund No one, but . . . Mila Skulkina joins John Morton and Steven Rocco in managing the fund. 1/20
LCDIX Lord Abbett Emerging Markets Corporate Debt Fund No one, but . . . Mila Skulkina joins John Morton and Steven Rocco in managing the fund. 1/20
LGCAX Lord Abbett Global Equity Research Fund David Linsen and Sue Kim are no longer listed as portfolio managers for the fund. Ryan Howard and Servesh Tiwari will now manage the fund. 1/20
MNCDX Mercer Non-US Core Tuomo Vuolteenaho is no longer listed as a portfolio manager for the fund. Over a dozen managers remain with the fund. 1/20
MALAX Mirae Asset Discovery Asia Fund Effective January 9, 2020, Vineet Thodge will no longer serve as a portfolio manager for the fund. Wei Wei Chua joins Rahul Chadha in managing the fund. 1/20
MALGX Mirae Asset Discovery Emerging Markets Fund Effective January 9, 2020, Vineet Thodge will no longer serve as a portfolio manager for the fund. Wei Wei Chua joins Rahul Chadha and William Malcolm Dorson in managing the fund. 1/20
Various Natixis Sustainable Future 2015 Fund, Natixis Sustainable Future 2040 Fund, Natixis Sustainable Future 2020 Fund, Natixis Sustainable Future 2045 Fund, Natixis Sustainable Future 2025 Fund, Natixis Sustainable Future 2050 Fund, Natixis Sustainable Future 2030 Fund, Natixis Sustainable Future 2055 Fund, Natixis Sustainable Future 2035 Fund, and Natixis Sustainable Future 2060 Fund No one, but . . . Michael Nicolas has joined the other two dozen or so managers on the team. 1/20
NEFSX Natixis U.S. Equity Opportunities Fund No one, but . . . Michael Nicolas has joined Aziz Hamzaogullari, Kevin Grant, M. Colin Hudson, William Nygren, and Michael Mangan on the management team. 1/20
NSOPX North Star Opportunity Fund Effective as of January 15, 2020, Jim Tassoni is no longer a portfolio manager of the North Star Opportunity Fund. Bradley Cohen, Sheldon Goodman, Peter Gottlieb, and Eric Kuby will continue to manage the fund. 1/20
NEKAX Nuveen Emerging Markets Equity Fund David Lund and Reed Walters are no longer listed as portfolio managers for the fund. Barton Grenning and Willis Tsai are now managing the fund. 1/20
OAKMX Oakmark Fund No one, but . . . Michael Nicolas has joined the Kevin Grant and William Nygren in managing the fund. 1/20
PJIAX PGIM Jennison Focused Value Fund Mark DeFranco and Brian Gillott are no longer listed as portfolio managers for the fund. Josheph Esposito and Warren Koontz are now managing the fund. 1/20
PWDAX Power Dividend Index Fund Effective December 31, 2019, Robert Shea no longer serves as a portfoliomanager of the fund. Effective December 9, 2019, Nicholas Lobley has been added as a portfolio manager of the Funds. The rest of the team, John Forlines, Jeffrey Thompson, and Richard Molari have not changed. 1/20
DMCAX Power Dividend Mid-Cap Index Fund Effective December 31, 2019, Robert Shea no longer serves as a portfoliomanager of the fund. Effective December 9, 2019, Nicholas Lobley has been added as a portfolio manager of the Funds. The rest of the team, John Forlines, Jeffrey Thompson, and Richard Molari have not changed. 1/20
FLOAX Power Floating Rate Index Fund Effective December 31, 2019, Robert Shea no longer serves as a portfoliomanager of the fund. Effective December 9, 2019, Nicholas Lobley has been added as a portfolio manager of the Funds. The rest of the team, John Forlines, Jeffrey Thompson, and Richard Molari have not changed. 1/20
GTAAX Power Global Tactical Allocation/JAForlines Fund Effective December 31, 2019, Robert Shea no longer serves as a portfoliomanager of the fund. Effective December 9, 2019, Nicholas Lobley has been added as a portfolio manager of the Funds. The rest of the team, John Forlines, Jeffrey Thompson, and Richard Molari have not changed. 1/20
PWRAX Power Income Fund Effective December 31, 2019, Robert Shea no longer serves as a portfoliomanager of the fund. Effective December 9, 2019, Nicholas Lobley has been added as a portfolio manager of the Funds. The rest of the team, John Forlines, Jeffrey Thompson, and Richard Molari have not changed. 1/20
MOJAX Power Momentum Index Fund Effective December 31, 2019, Robert Shea no longer serves as a portfoliomanager of the fund. Effective December 9, 2019, Nicholas Lobley has been added as a portfolio manager of the Funds. The rest of the team, John Forlines, Jeffrey Thompson, and Richard Molari have not changed. 1/20
PRIAX Principal International Emerging Markets Fund Mihail Dobrinov is no longer listed as a portfolio manager for the fund. Paul Blankenhagen and Jeffrey Kilkenny have joined Alan Wang in managing the fund. 1/20
PINOX Putnam International Growth Fund Jeffrey Sacknowitz will no longer serve as a portfolio manager for the fund. R. Shepherd Perkins now manages the fund. 1/20
HDCAX Rational Equity Armor Fund Timothy McIntosh will no longer serve as a portfolio manager for the fund. Brian Stutland, Luke Rahbari, and Joseph Tigay are now managing the fund. 1/20
SCGVX Sands Capital Global Growth Fund Sunil Thakor will no longer serve as a portfolio manager for the fund. Brain Christiansen joins David Levanson and T. Perry Williams in managing the fund. 1/20
WTMVX Segall Bryant & Hamill Global Large Cap Fund Lisa Ramirez will step down from the management team, effective May 1, 2020. The rest of the team will continue to manage the fund. 1/20
WTMCX Segall Bryant & Hamill Mid Cap Value Dividend Fund Lisa Ramirez will step down from the management team, effective May 1, 2020. The rest of the team will continue to manage the fund. 1/20
WISVX Segall Bryant & Hamill Small Cap Value Dividend Fund Lisa Ramirez will step down from the management team, effective May 1, 2020. The rest of the team will continue to manage the fund. 1/20
WEQRX Segall Bryant & Hamill Workplace Equality Fund Lisa Ramirez will step down from the management team, effective May 1, 2020. The rest of the team will continue to manage the fund. 1/20
SOAEX Spirit of America Energy Fund William Mason is no longer listed as a portfolio manager for the fund. Douglas Revello now manages the fund. 1/20
SOAOX Spirit of America Income & Oppurtunities William Mason is no longer listed as a portfolio manager for the fund. Mark Reilly will now manage the fund. 1/20
TZINX Templeton Global Balanced Fund No one, but . . . Herbert Arnett joins Warren Pustam and Michael Hasenstab in managing the fund. 1/20
TIEWX TIAA-CREF International Equity Fund Chris Semenuk is no longer a portfolio manager of the fund. John Tribolet and Gregory Mancini will now manage the fund. 1/20
TCLCX TIAA-CREF Large-Cap Value Fund Richard Cutler is no longer a portfolio manager of the fund. Charles Carr will continue to serve as portfolio manager 1/20
TCMHX TIAA-CREF Mid-Cap Growth Fund George (Ted) Scalise is no longer a portfolio manager of the fund. Terrence Kontos joins Adrian Almazan on the management team. 1/20
TCMVX TIAA-CREF Mid-Cap Value Fund Richard Cutler is no longer a portfolio manager of the fund. David Chalupnik and Evan Staples will now manage the fund. 1/20
VGENX Vanguard Energy Fund Gregory LeBlanc is no longer listed as a portfolio manager for the fund. G. Thomas Levering joins James Stetler and Binbin Guo in managing the fund. 1/20
VMGRX Vanguard Mid-Cap Growth Fund Stephen Knightly has retired and will no longer serve as a portfolio manager for the fund. Ravi Dabas, Christopher Scarpa, Timothy Manning, Paul Leung, D. Scott Tracy, Christopher Clark, Melissa Chadwick-Dunn, and Stephen Bishop on the management team. 1/20
SCSAX Wells Fargo Common Stock Fund Ann Miletti will no longer serve as a portfolio manager for the fund. Garth Newport joins Christopher Miller in managing the fund. 1/20
WFSMX Wells Fargo Intrinsic Small Cap Value Fund Ann Miletti will no longer serve as a portfolio manager for the fund. Theran Motl joins Christopher Miller in managing the fund. 1/20
SOPVX Wells Fargo Opportunity Fund Ann Miletti will no longer serve as a portfolio manager for the fund. Kurt Gunderson joins Christopher Miller in managing the fund. 1/20


Briefly Noted

By David Snowball

Updates

Effective December 31, 2019, founder Bill Nasgovitz resigned as president of the Heartland Funds and retired from its Board of Directors. He was succeeded, on January 1, 2020, by his son Will.

On December 31, 2019, founder James Oelschlager and his wife Vanita, the owners of Oak Associates, completed the transaction to sell substantially all of their ownership interest to a group led by members of their management team

A quick congratulations to Dennis Baran for being sharp-eyed and active. In December, our Elevator Talk focused on Joe Shaposhnik of the entirely-excellent TCW New America Premier Equities (TGUSX). Dennis, the author of several fine fund profiles for us, was intrigued by what he read, investigated and discovered that while all of the other TCW funds were available through the Vanguard brokerage, TGUSX was not. He poked the TCW reps who said something like “yikes!” and poked the Vanguard reps who said something like, “no problem, we just push this button.” The upshot is that TGUSX is now available with a $2,000 minimum through the Vanguard platform.

Briefly Noted . . .

SMALL WINS FOR INVESTORS

Effective February 28, 2020, the redemption fee for the Fort Pitt Capital Total Return Fund (FPCGX) will be removed.

Effective as of February 10, 2020, Emerald Growth Fund (FFGRX) will reopen to new investors.

On June 29, 2012, PGIM Jennison Health Sciences Fund (PHLAX) closed to most new investors. On February 24, 2020, the fund’s A, C, R, Z, and R6 shares will be reopened to new investors.

The Redwood Funds have reduced the minimum initial investment on the institutional shares of all seven of their funds to $10,000.

RiverPark Short Term High Yield (RPHYX/RPHIX) has reopened to all investors.

CLOSINGS (and related inconveniences)

Driehaus Emerging Markets Growth Fund (DREGX) will close to new investors immediately after 4:00 p.m. Eastern Time on February 28, 2020. It’s a $1.8 billion, five-star fund that has pretty much crushed its peers over the past two decades: its 11.3% annual return beats its peers by 3.9% annually and is the third-best among all diversified EM funds. The fund is distinguished by solid risk management, which is not usually the hallmark of Driehaus funds.

It also appears that Janus Henderson Small Cap Value (JDSAX) will close on February 28, 2020. The phrase in the SEC filing is that, as of that date, “Sales to new investors have generally been discontinued.” It has earned the Great Owl description from MFO for consistently top 10% risk-adjusted returns for the past 3, 5, 10 and 20 year periods. It has the second-highest Martin ratio and 10th highest Sharpe ratio among the 100 small-cap core funds with 20-year records. Morningstar rates it as a five-star fund with a Silver analyst rating.

OLD WINE, NEW BOTTLES

Driehaus Multi-Asset Growth Economies Fund (DMAGX) became the Driehaus Emerging Markets Opportunities Fund, effective as of January 29, 2020. The fund is now ESG-screened with a flexible multi-asset EM portfolio. I’d be cautious about its Morningstar rating since they have it in the (mostly domestic) multi-alternative group.

I learned a new word! “Demerged.” As in: “the Investec Group’s asset management business is expected to be demerged from the Investec Group, and separately listed, on March 13, 2020.” The unit they’re spinning off is renamed Ninety One North America. That implicates two funds.

Current Name New Name
Investec Global Franchise Fund (ZGFIX) Ninety One Global Franchise Fund
Investec Emerging Markets Equity Fund (ZEMAX) Ninety One Emerging Markets Equity Fund

Janus Henderson Global Technology Portfolio (JAGTX) will become Janus Henderson Global Technology and Innovation Portfolio on April 29, 2020.

On or about February 14, 2020, Sage ESG Intermediate Credit ETF (GUDB) becomes Sage ESG Intermediate Term ETF. Not sure of the rationale. Generally, “credit” in a fund’s name signals an emphasis on high-yield bonds since the risk in investing in such securities is more about the firm’s creditworthiness than about interest rates. So, maybe more flexibility to pursue investment grade stuff?

WisdomTree Asset Management is moving three funds from passive to active. WisdomTree Dynamic Currency Hedged International Quality Dividend Growth Fund (DHDG) is making the move from passive to active. Effective March 16, 2020, it becomes the WisdomTree International ESG Fund (RESD), becomes actively-managed and reduces its e.r. from 0.58% to 0.30%. On the same day, WisdomTree Emerging Markets Dividend Fund (DVEM) becomes WisdomTree Emerging Markets ESG Fund (RESE) and WisdomTree U.S. Total Market Fund (EXT, formerly WisdomTree U.S. Total Earnings Fund) goes from losing to the Vanguard Total Market Index to being WisdomTree U.S. ESG Fund (RESP).

OFF TO THE DUSTBIN OF HISTORY

361 Macro Opportunity Fund(AGMQX) was liquidated on or about January 24, 2020.

Altegris Gsa Trend Strategy Fund (TRNAX) and Altegris Managed Futures Strategy Fund (MFTAX) will be liquidated on March 30, 2020.

ETFMG Drone Economy Strategy ETF (IFLY) becomes the completely unrelated ETFMG Cloud Upstarts ETF on March 20, 2020. That’s technically not a liquidation but, as a practical matter, anyone who bought the fund to invest in the Drone Economy (rolls eyes) is SOL.

Fidelity Advisor Event Driven Opportunities Fund will be liquidated on March 27, 2020. The Fidelity Event Driven Opportunities Fund (FARNX), on the other hand, will be reorganized into the Fidelity Low Priced Stock Fund. Thanks to Mike for asking!

On or about February 12, 2020, JHancock Disciplined Alternative Yield Fund (JTRAX) will be liquidated. Why you ask? It is “as a result of factors or events adversely affecting the fund’s ability to conduct its business and operations in an economically viable manner.” Ummm … there’s no evidence (yet) of dramatic outflows, despite the fact that the fund has trailed 70+ percent of its peers in five of the past six years, so unless “factors or events” just meant “our performance was pitiful,” it’s not clear what triggered the closing.

Lazard US Realty Equity Portfolio has had its liquidation postponed again. No word on why, but I could imagine some issue in liquidating the least liquid parts of a real estate portfolio.

MainStay Cushing Energy Income Fund, MainStay Cushing Renaissance Advantage Fund, and the Voya CBRE Global Infrastructure Fund all appear to be in the process of merging into the MainStay CBRE Global Infrastructure Fund. The receiving fund doesn’t exist just yet; it’s been created solely to receive the assets of the other funds. Dates are squishy because there have to be a lot of shareholder mailings and proxies and such. That said, May 2020 seems to be in the ballpark for the conclusion of the deal.

Pickens Morningstar Renewable Energy Response ETF (RENW), whose attempt to link an icon of “the erl bidness” with renewable energy was never all that logical, was not renewed and disappeared on January 30, 2020.

Quantified All-Cap Equity Fund (QACFX) was liquidated on January 30, 2020.

The ridiculously expensive Sirius S&P Strategic Large-Cap Allocation Fund (SSPLX) has returned just over 1% a year for the past five years; the fund’s board of trustees has decided that its demise is in “the best interests of the Fund and its shareholders.” Those interests will be advanced on February 28, 2020.

Templeton Frontier Markets Fund (TFMAX) will be liquidated (and dissolved!) on March 27, 2020. Tiny fund with returns and risk-adjusted returns that were just middlin’.

Voya Global Corporate Leaders® 100 Fund (VGDAX) and Voya SMID Cap Growth Fund (VGROX) have closed to new investors and will be liquidated on March 13, 2020.

Zacks Market Neutral Fund (ZMNVX) will be liquidated on or about February 26, 2020.