


This past week has seen some significant market turmoil as the yield on 10-year treasuries climbed quickly to 1.5% while the S&P 500 dipped 2.5% on Thursday, February 25th. I show the Moving Average Convergence Divergence indicator below. The trends are short-term bearish. In this article, I focus on funds that lost less than a half percent on Thursday and were trending up over the past several months for clues on where to invest with the possibility of inflation rising.
This article is divided into four sections for those who wish to skip to particular sections:
- Beginning with the End in Mind
- Inflation, Trends or Market Manipulation?
- Performance of Inflation Resistant Funds
- Recent Performance of Trending Funds
Figure #1: Technical Indicators
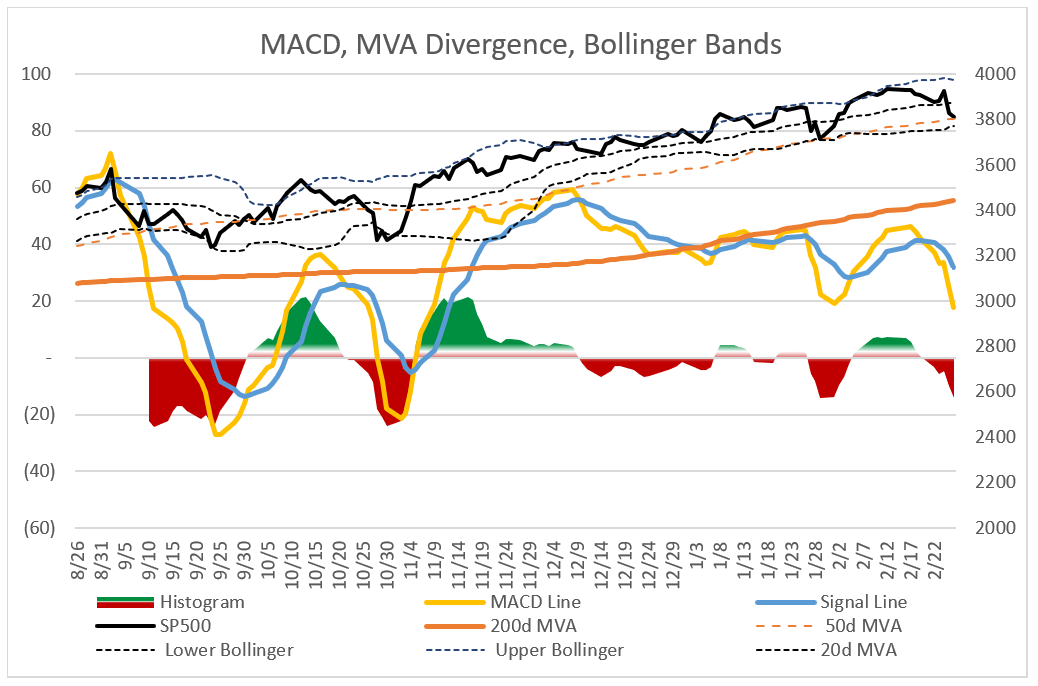
Source: Author
1. Beginning with the End in Mind
On Thursday, February 25th, the S&P 500 fell 2.5%. For the past 12 months, the S&P 500 has risen 17%. Jil Mislinski describes how highly the markets are valued in Is the Market Still Overvalued? Inflation is inversely related to market valuations. Higher inflation will lower market valuations. Is Mr. Market predicting inflation?
Table #1 is a list of some of the nearly 700 funds that I track which lost less than a half percent last Thursday and generally have positive three-month trends, returns, and positive fund inflows. These are the funds worth taking a look at. First, I note that T. Rowe Price Multi-Strategy Total Return Fund (TMSRX) remains a solid performer and is one of my larger holdings. Second, I note that commodities, excluding gold, are on the list. Commodities are often good hedges for inflation because the costs can often be passed on to consumers.
Table #1: Funds with Low Drawdowns that are Trending Up with Positive Inflows
| Lipper Category | ETF | Fidelity | Vanguard | Other | 25-Feb | 3 Month Return |
| Ultra-Short Obligations | ICSH | FHQFX | VUSFX | BUBIX | -0.03 | 0.10 |
| Alternative Equity Market Neutral | ARBIX | -0.09 | 2.85 | |||
| Municipal Short-Intmdt Debt | SUB | FSTFX | VMLTX | PRFSX | -0.11 | 0.04 |
| Municipal Short Debt | JMST | VWSTX | BTMIX | -0.11 | 0.12 | |
| Absolute Return Bond | SUBFX | -0.15 | 1.06 | |||
| Global Income | PRSNX | -0.17 | 0.64 | |||
| Global High Yield | GHYG | -0.26 | 2.72 | |||
| Short Investment Grade Debt | SPSB | FSHBX | VFSTX | BSBIX | -0.27 | 0.02 |
| Municipal Intermediate Debt | FLTMX | VWITX | BMNIX | -0.27 | -0.10 | |
| U.S. Government Short | FTSD | VSGBX | -0.27 | 0.05 | ||
| Short-Intmdt Invest Grade Debt | ISTB | FNSOX | -0.31 | -0.10 | ||
| Commodities General | EIPCX | -0.32 | 17.30 | |||
| High Yield | VWEHX | -0.33 | 1.62 | |||
| Municipal General & Insured Debt | MMIN | FTABX | NOTEX | -0.33 | -0.36 | |
| Commodities Agriculture | DBA | -0.34 | 13.37 | |||
| Emerging Mrkts Hard Crncy Debt | VEMBX | TRECX | -0.35 | 0.89 | ||
| Alternative Multi-Strategy | TMSRX | -0.37 | 4.63 | |||
| Alternative Credit Focus | UCON | BASIX | -0.39 | 1.48 | ||
| U.S. Mortgage | JMBS | VMBSX | -0.41 | -0.22 | ||
| Alternative Event Driven | DEVDX | -0.41 | 8.22 | |||
| Flexible Income | ETIBX | -0.46 | -0.34 | |||
| Alternative Global Macro | RPIEX | -0.49 | 3.82 |
Source: Created by the Author Using Morningstar
2. Inflation, Trends, or Market Manipulation?
The Consumer Price Index for Urban Consumers (CPI-U) is currently running at less than 1.5% YOY which is below the past ten years, but it is rising. However, Food and beverage are increasing at 3.7%. Rising grocery prices make life a struggle for those just making ends meet. Figure #2 shows the dollar has continued to weaken and commodity prices are rising. Figure #3 shows the velocity of money has steadied its rapid descent and flattened, commodity prices are rising, and the dollar has been weakening. Note that the decline of the dollar has abated year to date.
Figure #2: Commodity Prices and 10 Year Treasury Yield
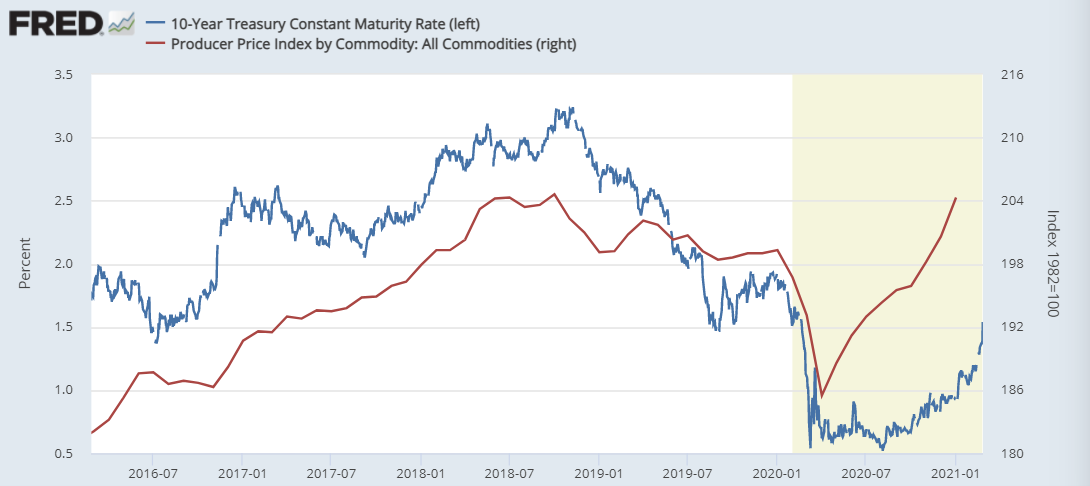
Source: Created by the Author Using St Louis Federal Reserve (FRED) Database
Figure #3: Velocity of Money, Dollar, and Import Prices
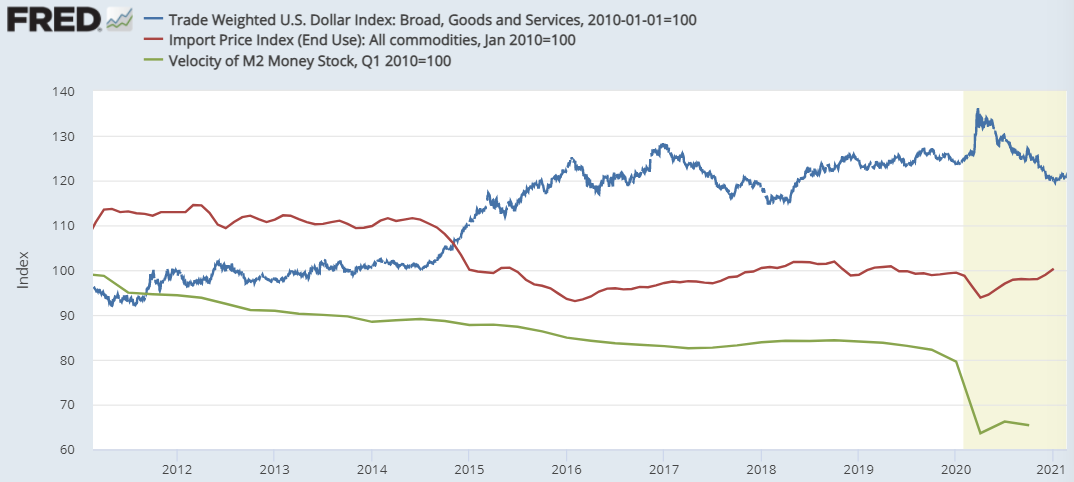
Source: Created by the Author Using St Louis Federal Reserve (FRED) Database
Figure #4 shows inflation expectations, rising prices, and rising bond yields. Rising interest rates increase the costs to borrowers lowering profits and reducing the amount of money available for spending as larger amounts are required to service debts such as large deficits.
Figure #4: Inflation Breakeven and Forward Rates, PCE Price Index, Inflation Adjusted Rate
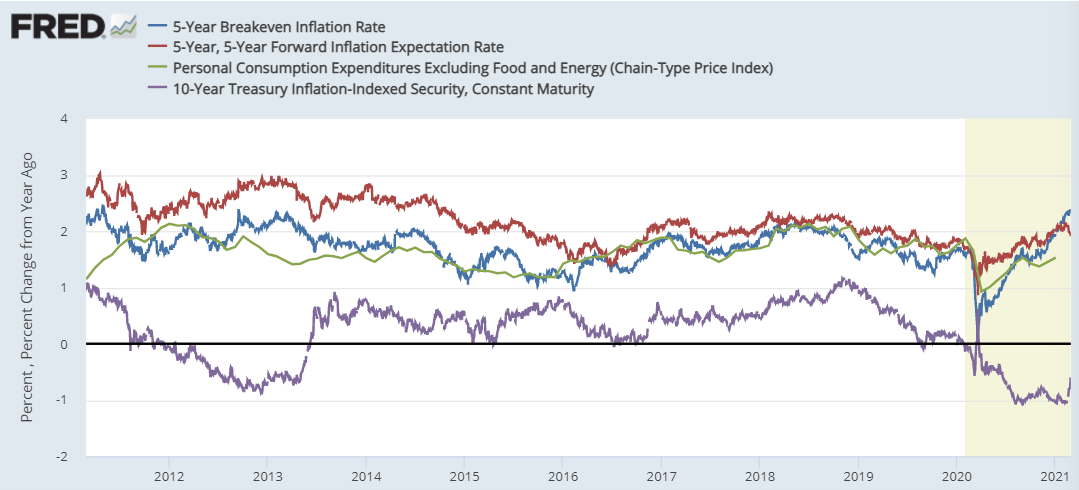
Source: Created by the Author Using St Louis Federal Reserve (FRED) Database
One of the sources that I follow carefully on Seeking Alpha is Lipper Alpha for their fund flow analysis such as in Inflation Concerns Boost Flows Into Inflation Protected And Loan Participation Funds And ETFs. Tom Roseen has a thorough review of the trends behind the fund flows.
While conventional taxable fixed-income funds witnessed their tenth consecutive week of net inflows – attracting $6.2 billion this week – inflation-protected and floating-rate funds also witnessed continued attention…
…On the Inflation Protected Securities Funds (and ETFs) side, the top three attractors for investors’ assets year to date were the Schwab US TIPS ETF (SCHP, +$1.7 billion), the iShares TIPS Bond ETF (TIP, +$1.1 billion), and the iShares 0-5 Year TIPS Bond ETF (STIP, +$713 million). The top draws for Loan Participation Funds (and ETFs) were the SPDR Blackstone Senior Loan ETF (SRLN, +$1.3 billion), the Invesco Senior Loan ETF (BKLN, +$1.2 billion), and the BlackRock Floating Rate Income Portfolio, Institutional Shares (BFRIX, +$704 million [including all share classes]).
Inflation provides a contrarian view to the recovery as explained by Michael Lebowitz in Will “Go Crazy” Drive The Bear Out Of Hibernation?. Much of the inflation in asset prices is due to monetary policy. As inflation on consumers rises and bond yields rise, the Federal Reserve may have to tighten monetary policy:
The seemingly omnipotent Fed may find themselves cornered by rising interest rates, rising inflation expectations, and falling asset prices. They may have no option but to reverse the stimulus.
Given the current egregious level of equity valuations, all investors should think deeply about what it would take for the Fed to take their foot off the monetary gas pedal. ‘Go crazy’ might be the rationale.
Market manipulation occurs on a much grander scale than many of us realize. In September 1992, speculators “broke the British Pound” by shorting the pound. Currency manipulation was evident during the Asian Contagion in 1997. Shorting the Dollar Is Also Proving Uncomfortable at the Moment describes the shorting of the US Dollar at the moment. Since most commodities are priced in dollars, a falling dollar raises some prices.
3. Performance of Inflation Resistant Funds
Let’s take a closer look at inflation-resistant funds. Of the funds that I track, those in Table #2 performed the best on a risk-adjusted basis for their Lipper Category.
Table #2: Traditional Inflation Resistant Lipper Categories
| Lipper Category | ETF | Fidelity | Other |
| Absolute Return | SUBFX | ||
| Commodities Precious Metals | BAR | ||
| Real Return | FSRRX | ||
| Real Estate | FRIFX | ||
| Commodities General | COMT | EIPCX | |
| Commodities Agriculture | DBA | ||
| Precious Metals Equity | FSAGX | ||
| Commodities Base Metals | DBB |
Figure #5 shows the inflation-resistant funds for the past three months. Those not shown, such as gold have not performed well recently. While most held up well on Thursday, some fell on Friday. Commodities will be a good investment if inflation trends continue, but if the short-term reversal gains traction, they likely will be volatile.
Figure #5: Inflation Resistant Funds
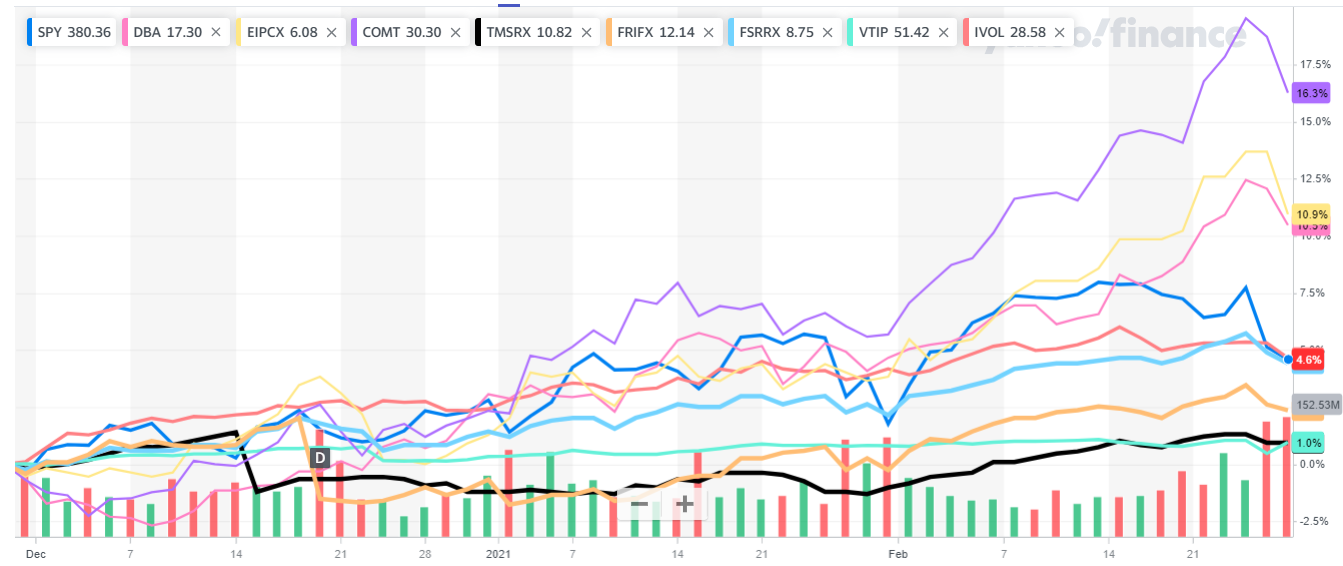
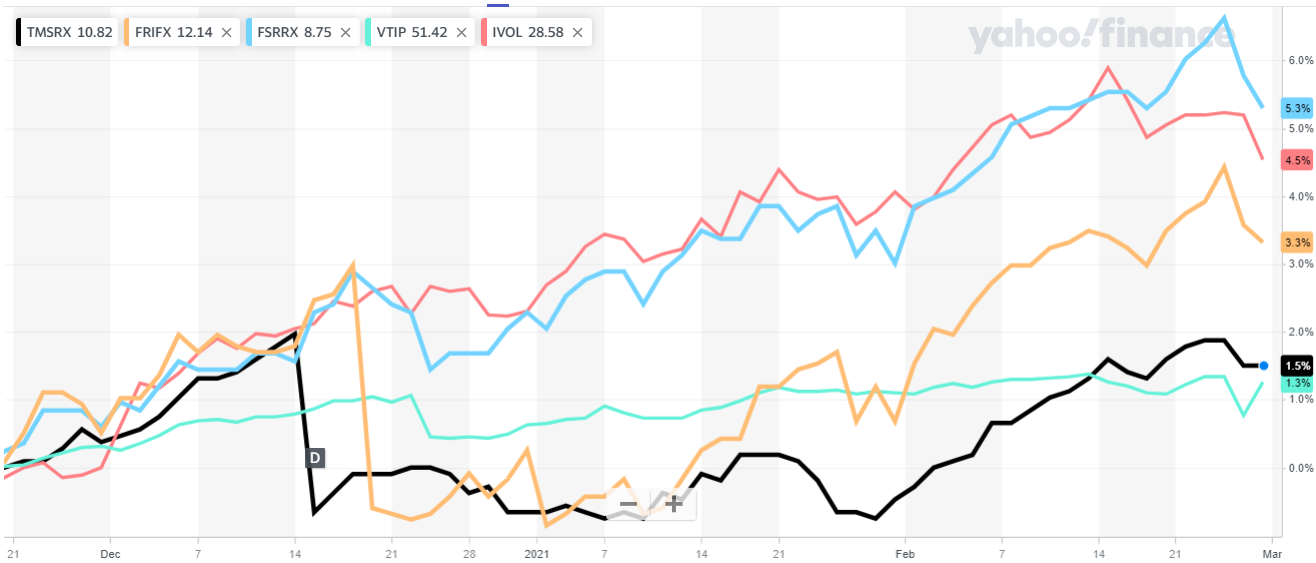
Figure #6 shows the more stable of the funds from the previous figure. I show TMSRX as a baseline fund. I have more faith investing in it over the intermediate-term than I do betting on commodities and inflation. I do own a small amount of inflation-protected bonds for diversification.
Figure #6: Stable Inflation Resistant Funds
4. Recent Performance of Trending Funds
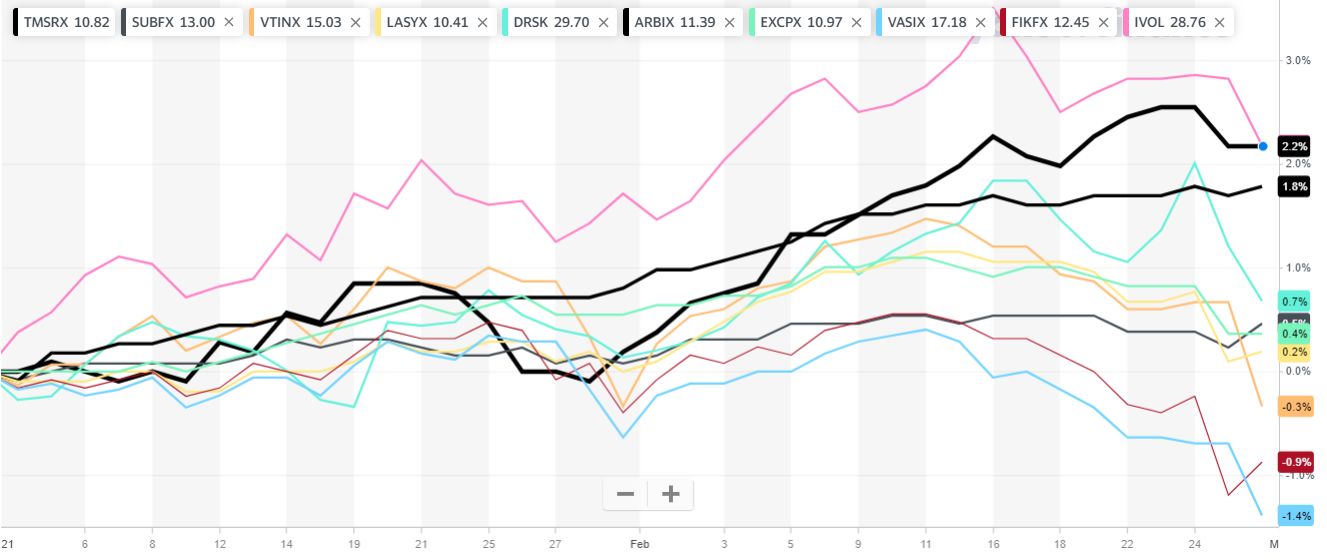
Table #3 contains mostly funds that I have previously identified as trending higher with positive fund inflows. Figure #7 shows the funds that have been mostly stable over the past week. Others have not performed as well.
Table #3: Trending Funds with Positive Fund Inflows
| Name | Symbol | Max DD | APR | Rtn 3 mon | Trend | Flow | Yld | SMA 10 |
| Guggenheim Total Rtrn Bond | GIBIX | -1.1 | 9.3 | 2.5 | -0.3 | 3.0 | 2.6 | 7.9 |
| Carillon Reams Uncons Bond | SUBFX | -3.0 | 8.2 | 3.0 | 0.3 | 1.2 | 3.0 | 10.2 |
| Columbia Div Fxd Inc Alloc | DIAL | -5.5 | 9.0 | 2.7 | -0.2 | 11.0 | 2.7 | 9.3 |
| Vanguard Target Retire Inc | VTINX | -6.6 | 9.7 | 5.7 | 0.4 | 0.2 | 1.6 | 11.1 |
| Natixis Loomis S. Strat Alpha | LASYX | -6.2 | 6.3 | 4.7 | 0.5 | 1.2 | 2.3 | 11.0 |
| Aptus Defined Risk ETF | DRSK | -3.1 | 11.6 | 1.9 | -0.1 | 11.6 | 1.2 | 9.3 |
| Absolute Strat Conv Arb | ARBIX | -3.1 | 7.5 | 3.5 | 0.9 | 16.1 | 0.1 | 7.6 |
| Manning&Napier Uncons Bond | EXCPX | -4.6 | 6.0 | 3.3 | 0.7 | 3.9 | 2.6 | 8.6 |
| Vanguard LS Income | VASIX | -4.3 | 8.9 | 3.7 | 0.0 | 1.4 | 1.7 | 8.4 |
| Columbia Adaptive Risk Alloc | CRAZX | -7.1 | 10.7 | 8.2 | 0.4 | 0.5 | 0.9 | 9.8 |
| Navigator Tctcl Fxd Inc | NTBIX | -4.0 | 7.2 | 5.0 | 0.0 | 2.8 | 1.3 | 8.9 |
| Advisory Research Strat Inc | ADVNX | -3.3 | 9.7 | 4.0 | 0.2 | 1.2 | 2.2 | 9.5 |
| Fidelity Asset Manager 30% | FTANX | -8.3 | 10.2 | 6.7 | 0.6 | 2.6 | 1.4 | 13.3 |
| BlackRock Strat Inc Oppor | BASIX | -6.7 | 6.5 | 4.1 | 0.4 | 1.8 | 2.4 | 8.9 |
| Invesco S&P500 Dwnsd Hdgd | PHDG | -6.2 | 13.7 | 4.4 | 2.8 | 3.7 | 0.6 | 9.4 |
| KL Allocation Inst | GAVIX | -2.0 | 14.6 | 4.5 | 0.0 | 1.3 | 2.2 | 13.2 |
| T Rowe Price Mlti-Strat Tol Rtrn | TMSRX | -4.7 | 9.2 | 3.9 | 0.9 | 5.4 | 0.8 | 11.4 |
| Schwab Mthly Inc-Max Payout | SWLRX | -3.7 | 7.5 | 3.3 | -0.1 | 2.5 | 2.0 | 6.6 |
| Fidelity Freedom Index Inc | FIKFX | -3.1 | 8.1 | 3.6 | 0.1 | 2.2 | 1.3 | 7.3 |
Source: Created by the Author using the MFO Premium database
Figure #7: Short Term Performance of Trending Funds
Closing
My belief is that we are at a period of high valuations which will mean revert at some point over the coming decade bringing lower returns as valuation multiples fall. Funds have been flowing into fixed asset funds including inflation-protected bonds. With vaccines, the recovery will probably continue, and stimulus will have to be reduced to prevent inflation. There are some valid drivers of inflation as well as market manipulation. The timing of when this happens is rather murky.
Investors should build storylines around investments while following trends. This article represents my storyline around inflation, bond yields, and high valuations. I maintain a traditional, diversified, conservative approach which includes some asset rotation to manage risks including inflation.
Best Wishes and Be Safe!