Monthly Archives: April 2023

April 1, 2023

By David Snowball

Dear friends,

Chip and I celebrated the start of Spring – or at least Augustana’s spring break – with a long sojourn to New Orleans. Our options were either a series of flights totaling about 10 hours or a 14-hour drive. For better and worse, we chose the latter, loaded the car with snacks, books, and music, and headed down the Mississippi from the Quad Cities to the Big Easy. The drive took us through seven states and one swath of utter destruction. The night before our passing, a tornado in Mississippi decapitated a forest adjacent to Interstate 55. Imagine, if you might, hundreds of mature trees either snapped off five feet above the ground or ripped up by their roots. It was spectacular and a sobering reminder of the price we’ll pay for a heating planet.

We ate well – she more adventurously than I, walked a lot, enjoyed live music, feral hogs, and wild alligators.

This issue of the Observer is richer than usual, but our late return from the drive means that this letter will be shorter.

In this issue of the Observer

Emerging Opportunities

There is a compelling argument to be made that there is an investment regime change underway, in Paul Espinosa’s phrase. We’ve come to expect that the right answer to the question “where and how should I invest” is captured in a single phrase: “passively, in US large growth stocks.” It is clear that phrase captures the past. It is less clear that it captures the future. Asset class researchers are increasingly assertive about the prospect that emerging markets might be vastly more profitable – and not necessarily more volatile – than the old US standbys. GMO currently projects a 5.5% annual return from EM and 8.3% for EM value over the remainder of this decade while it sees US large caps being underwater. Research Affiliates projects EM equities as the single highest returning asset, at 8.1% annually for a decade, with US large caps earning one-fourth as much. AQR, a firm once known as Applied Quantitative Research, estimated in March 2023 that EM stocks are now expected to generate about a 3% premium over developed market stocks, one of the highest levels in the past 25 years.

That optimism was hinted at in 2022 when everything went topsy-turvy, and EM stocks kept pace with the mighty S&P 500. In pursuit of the most compelling options, we screened for the diversified EM funds with the best risk-adjusted returns over the past five years. The top five, out of 225, are:

In this issue, I profile Seafarer Overseas Value, a Great Owl fund that was the best performer among all diversified EM funds in 2022. Devesh spent rather a lot of time interviewing Lewis Kaufman and his Artisan Developing World team. Devesh was struck by two stats: (1) the fund crashed in 2022, and (2) despite that, it maintains an almost 5:1 performance edge over its peers since inception.

Strategic Income

I noted in our March 2023 issue I am personally in search of additional fixed-income exposure, and I’ve resolved to find a fund whose performance is not tied to the fate of the broad fixed-income market. That reflects two facts:

  1. My long-term strategic allocation is out of whack – I’m too exposed to international stocks and too little exposed to fixed income, so more fixed income is good.
  2. I think most bond strategies are stupid. Or, at the very least, they are mostly dependent for their success on a very hospitable external environment, which I doubt will describe the remainder of this decade.

That led me to explore funds that bore the name “strategic income.” They were drawn from a half-dozen Lipper categories and used a dozen strategies, all with the goal of generating income independent of the broad investment grade bond market.

Four funds stood out for their risk-adjusted performance over the past five years.

In this issue, we profile two of them. RiverPark Strategic Income, which we first profiled in 2014, is managed by David Sherman of Cohanzick Management. David has a suite of distinguished, high-performing fixed-income funds, which he manages under both the RiverPark and CrossingBridge banners. Osterweis Strategic Income is managed by a team headed by Carl Kaufman, who has been with the fund since its launch. The three-member team boasts 100 years of experience and a very long record of thriving across markets.

North Square had a complete management team turnover in 2020. Thornburg will appear next month.

Preparing an all-weather bond portfolio

Lynn Bolin, reacting to some of the same forces that motivated me, has pursued the question: what fixed-income strategy succeeds, come hell or high water? He looks at the performance of funds across hostile environments to identify a cadre of durable veterans worth your consideration.

Reflecting on our own record

Devesh Shah takes a moment to go back over five sets of recommendations he’s made in the past year. His desire is both to cultivate a sense of ongoing transparency and shared inquiry and to give you a sense of how his long-term recommendations played in the short term.

And, as ever, Charles Boccadoro keeps us apprised of changes at MFO Premium – still, the best use for $120 investor dollars – and The Shadow shares word of the industry’s twists and turns in “Briefly Noted.”

In memoriam

Steve Leuthold (1937 – 2023) died at his home in California on March 7, 2023. Mr. Leuthold founded the Leuthold Group in 1981, which became famous for rigorous and exhaustive quantitative research into the dynamics of the stock market and surrounding economy. The depth of their insights led their clients to urge them to go beyond research into direct investment management. In 1995, he launched the quantitatively driven, multi-asset, benchmark agnostic Leuthold Core Fund (LCORX). It remains an excellent and distinctive option for investors looking for a one-stop answer to the question, “where can I leave my long-term money and get on with life?”

Mr. Leuthold retired in 2011 and was succeeded by Doug Ramsey, who describes Steve as “a fry cook, law student, history major, Cargill commodities-trader trainee, bar- and dance-club proprietor, and singer/songwriter/guitar player in the rockabilly band Steve Carl & The Jags.” In addition to being a great colleague and fabulous investor.

And philanthropist. Mr. Leuthold donated most of his wealth to the Nature Conservancy and Salvation Army, as well as a number of other causes.

Mr. Leuthold is survived by his wife, sons, daughter, grandchildren, step-grandchildren, and one great-grandchild. They, and his colleagues at the Leuthold Group, are very much in our thoughts and prayers.

Thanks

This month, we thank “He who shall remain nameless” in addition to our indispensable regulars – Gregory, William, Brian, William, David, Doug, Wilson, and S &F Investment Advisors. We also thank you all.

As ever,

david's signature

Bond Funds for a Recession and Falling Rates

By Charles Lynn Bolin

Bond investors think they’ve seen it all.

They are wrong about that. For people who first began investing in bonds within the past 4o years – say, since 1982 – the bond market must seem like a source of perpetual, reassuring, and unrelenting gain. Just chuck some cash into the Treasury market or investment-grade corporates, and voila! Instant wealth.

In that same period, global equity investors have been slapped upside the head over 30 times, sometimes with local market crashes (the Argentine collapse in 1989) but more often in global corrections, panics, crashes, repricings, and bears.

Over the past 40 years, a vanilla “core bond” portfolio generated 6.1% annually with a standard deviation of 4.8%. In the same period, inflation was a meek 2.8%. As a result, you could pretty much bet the farm on inflation-topping gains. Interest rates were dropping steadily and almost relentlessly from their highs around 1980. Inflation was tame and occasionally negative. Freed of the need to worry about price stability – one of their two formal obligations – the Fed could devote its vast resources and considerable creativity to fostering full employment. And if the system had a stumble, no problem: the Fed would fix it.

Those days are gone. While nostalgia is understandable, it’s a poor basis for portfolio construction.

High inflation combined with rising rates presents both the opportunity to earn a decent return on fixed income along with the risk of a recession. It is unprecedented to have this combination without a recession. In this article, I look at how to balance this opportunity with risk. I identify twenty Lipper Bond Categories that have done well during the past five recessions, along with up to four funds each.

This article is divided into the following sections:

Investor Expectations and Steepening Yield Curves

We are in what appears to be a somewhat traditional late stage of the business cycle where the Federal Reserve raises the Federal funds rate to reduce inflation. Federal Reserve Chairman Jerome Powell has laid out plans to raise interest rates to about five percent and hold them there as I described in the MFO November Newsletter, “Federal Reserve Rate Hikes – The Next Nine Months.” Six months later, we are approaching the end of the rate hiking cycle as inflation has peaked but is likely to remain higher than the target of 2% for longer. The ten-year Treasury has been on a roller coaster ride peaking at 4.3% on October 24th, then falling to 3.4% on December 7th, and returning above 4.0% on March 2nd.

On March 7th, Federal Reserve Jerome Powell testified before the Committee on Banking, Housing, and Urban Affairs. The S&P 500 immediately dropped over one percent, and the short end of the yield curve rose. Mr. Powell says the data “suggests that the ultimate level of interest rates is likely to be higher than previously anticipated” and that they continue to reduce the balance sheet (Quantitative Tightening). I expect a quarter-point hike on March 22nd, but a half-point is not off the table. I then expect another quarter-point hike in the second quarter.

Kathy Jones from Charles Schwab describes in “How to Prepare for Landing” that investor expectations of the Federal funds rate have risen from 5.25% to 5.5% by this August and start to fall before the end of the year. Ms. Jones cites the inverted yield curve, tightening lending standards, falling demand for loans, and tight monetary policy for the rising risk of a recession. She suggests holding bonds of high credit quality and gradually adding duration.

Lance Roberts wrote an insightful article, “Recession Countdown Begins as Yield Curves Trough,” where he describes the inverted yield curve as a “warning” of the possibility of a recession, but the bottoming and steepening of the yield curve are what signals a recession is approaching. Mr. Roberts believes that the “central bank is poised to keep policy tighter for longer” and the “downturn is thus liable to be worse, leaving the Fed needing to cut rates more.” He is overweight in cash and short-term Treasuries, and will be increasing bond durations.

I built Chart #1 to track the steepening of the ten-year to three-month Treasury yield curve using the Moving Average Convergence Divergence (MACD) momentum indicator. The chart shows that the yield curve is still inverted but has been steepening since the beginning of February. There is a lot of volatility as inflation expectations evolve, and this segment of the curve began to invert further after Mr. Powell’s testimony.

Chart #1: 10 Year minus 3 Month Treasury Yields Momentum (MACD)

Source: Author Using Mutual Fund Observer

Ten-Year Treasury Yields vs Fed Funds During Recessions

My short-term objective has been to build a bond ladder for the next eight years to lock in yields above four percent on Treasuries. Table #1 contains how the ten-year Treasury yield has behaved in relation to the Federal funds rate during the past seven recessions. On average, the Federal Funds rate has fallen from 10% to 5% during recessions while the ten-year Treasury has fallen from 7.9% to 7.5%. The spread of the ten-year Treasury to Federal funds rate increased from negative 2% to positive 2% because the ten-year yield held fairly constant while the Federal funds rate fell. The maximum yields during the recessions show that we may have a higher Federal fund rate and ten-year Treasury yield during the recession compared to the start of the recession because the start is not declared by the National Bureau of Economic Research (NBER) until about nine months afterward.

Table #1: Fed Funds Rate and 10-Year Treasury at Start and End of Recessions

Source: Author Using St. Louis Federal Reserve FRED Database

In Chart #2, I normalized the ten-year Treasury to Federal funds rate spread to the start of the recession excluding the outlier recessions in the early 1980s. The dark black line is the average spread. Prior to the start of the recession in Month “0”, the ten-year Treasury yield tends to move in parallel with the Federal Funds rate with some volatility. After the recession starts, the ten-year Treasury yield tends to remain relatively constant while the Federal funds rate falls.

Chart #2: Ten-Year vs Federal Funds Rate Spread During Recessions

Source: Author Using St. Louis Federal Reserve FRED Database

This implies that if the Federal Reserve raises the funds rate another 50 basis points (half percent) then the Ten-Year Treasury yield may also rise in parallel. The volatility shown in the above chart shows this is not a reliable planning tool, but there are buying opportunities during dips.

Bond Category Performance in Recessions with Falling Rates

I used the Mutual Fund Observer MultiSearch screen for bond funds that outperformed during recessions along with falling interest rates. Table #2 shows the results by Lipper Category. The data set includes BlackRock, Allianz, Fidelity, State Street, T Rowe Price, WisdomTree, and Vanguard funds. These categories are used to select the funds in the next section. Table #2 contains mostly government or agency bonds, municipal bonds, high quality corporate bonds, and shorter-term investment grade bond categories.

Table #2: Highest and Consistent Lipper Bond Category Performers During Recessions

Source: Author Using Mutual Fund Observer

Table #3 contains a list of riskier bond and mixed-asset fund categories that can be rewarding depending on whether there is a hard or soft landing. Not shown are the riskiest of the bond categories such as high yield.

Table #3: Riskier and Less Consistent Lipper Bond Category Performers During Recessions

Source: Author Using Mutual Fund Observer

Top Notch Bond Funds (ETFs, Fidelity, Vanguard & Others)

I like Professor Snowball’s terminology of “The Young Defenders” with impressive shorter histories but excellent risk and return metrics, and “The Wizards” that have consistently performed well through multiple recessions. I selected “Top Notch Bond Funds” of both Young Defenders and Wizards using MFO, Lipper, Ferguson and Reamer Ratings. I trimmed the list based on expense ratios, age, and assets under management, among other factors for the Lipper Categories identified in the previous section. I include one mutual fund for each category from both Fidelity and Vanguard along with a mutual fund from a different company that is available through Fidelity without a no-load and with no-transaction fee. I also include one ETF. The link associated with the symbol is to Morningstar. The funds are sorted from the highest Ulcer Rating to the lowest. The Ulcer Index is a measure of the length and depth of the drawdown. Bond performance will improve this year compared to last year because yields are stabilizing.

EXCHANGE TRADED FUNDS

Table #4: Top Performing ETF Bond Funds

Symbol Name Lipper Category Quality Effect Maturity yr 30d Yield %
IGEB BlackRock iShares Inv Grd Bond Fact Core Plus Bond BBB 9.5 5.02
GOVT BlackRock iShares US Treas Bond U.S. Treasury General AA 7.9 3.95
BIV Vanguard Inter-Term Bond Core Bond A 7.1 4.14
VGIT Vanguard Inter-Term Treas U.S. Gov Inter AA 5.6 3.62
VTEB Vanguard Tax-Ex Bond Muni Gen & Ins Debt A 14.8 3.05
MMIT New York Life IQ MacKay Muni Inter Muni Inter Debt A 13.1 3.00
AGZ BlackRock iShares Agency Bond U.S. Gov Gen A 3.2 4.13
ISTB BlackRock iSh Cor 1-5 Yr USD Bnd Shrt-Intm Inv Grd Dbt A 3.7 4.51
STOT State Street DL Shrt Dur Tot Rtn Tact U.S. Gov Short-Inter BBB 8.2 4.36
VGSH Vanguard Short-Term Treas U.S. Gov Short AA 2 4.32

Source: Author Using MFO Premium database and screener

Chart #3: Top Performing ETF Bond Funds

Source: Author Using MFO Premium database and screener

FIDELITY

Table #5: Top Performing Fidelity Bond Funds

Symbol Name Lipper Category Quality Effect Maturity yr 30d Yield %
FUAMX Fidelity Inter Treas Bond U.S. Treasury General AA 6.9 3.57
FGOVX Fidelity Gov Inc U.S. Gov Gen AA 12.7 3.39
FTBFX Fidelity Total Bond Core Bond A 13.9 5.13
FMSFX Fidelity Mortgage Sec U.S. Mortgage AA 25.6 3.40
FTABX Fidelity Tax-Free Bond Muni Gen & Ins Debt BBB 16.7 3.46
FSTGX Fidelity Inter Gov Inc U.S. Gov Short-Inter AA 5.2 3.54
FIPDX Fidelity Infl-Prot Bond Infl Prot Bond AA 7.2 0.60
FTHRX Fidelity Inter Bond Shrt-Intm Inv Grd Dbt A 7 4.22
FLTMX Fidelity Inter Muni Inc Muni Inter Debt A 12.8 2.80
FUMBX Fidelity Short-Term Treas Bond U.S. Treasury Short AA 2.7 4.10

Source: Author Using MFO Premium database and screener

Chart #4: Top Performing Fidelity Bond Funds

Source: Author Using MFO Premium database and screener

VANGUARD

Table #6: Top Performing Vanguard Bond Funds

Symbol Name Lipper Category Quality Effect Maturity yr 30d Yield %
VCOBX Vanguard Core Bond Core Bond A 15.2 4.21
VSIGX Vanguard Inter-Term Treas U.S. Gov Inter AA 5.6 3.58
VWLUX Vanguard Long-Term Tax-Ex Muni Gen & Ins Debt A 18.8 3.39
VFIUX Vanguard Inter-Term Treas U.S. Treasury General AA 6.6 3.59
VWITX Vanguard Inter-Term Tax-Ex Inv Muni Inter Debt A 11.9 2.88
VFSTX Vanguard Short-Term Invest-Grade Shrt Invest Grade Dbt BBB 3.5 4.55
VSCSX Vanguard Short-Term Corp Bond Shrt-Intm Inv Grd Dbt BBB 3 4.77
VSGBX Vanguard Short-Term Federal Inv U.S. Gov Short A 4.7 3.85
VFIRX Vanguard Short-Term Treas U.S. Treasury Short AA 4.2 4.16
VMLUX Vanguard Lim-Term Tax-Ex Muni Shrt-Intmd Debt A 10.7 2.65

Source: Author Using MFO Premium database and screener

Chart #5: Top Performing Vanguard Bond Funds

Source: Author Using MFO Premium database and screener

OTHER FUND FAMILIES

Table #7: Top Performing Bond Funds From Other Companies

Symbol Name Lipper Category Quality Effect Maturity yr 30d Yield %
BAGSX Baird Aggregate Bond Inv Core Bond A 15.1 3.74
UINCX Victory USAA Inc A Corp Debt A Rated BBB 9.6 4.22
STYAX Allspring Core Plus Bond A Core Plus Bond A 13.5 3.84
PTIAX Performance Trust Strat Bond Inst Gen Bond BBB 14.7 5.80
ALTHX AllianceBernstein AB Nat Port A Muni Gen & Ins Debt BBB 17.5 3.24
UGSFX American Funds US Gov Sec F1 U.S. Gov Gen AA 11.4 2.12
OMBAX JPMorgan Mortgage-Backed Sec A U.S. Mortgage A 21.8 2.78
MFAEX American Funds Mortgage F1 U.S. Gov Inter A 16.9 3.11
TWTIX American Cent. Inter-Trm Tax-Fr Bnd Muni Inter Debt A 12.4 2.88
LTXFX Am. Funds Lim Trm Tx-Ex Bnd of Am Muni Shrt-Intmdt Dbt A 13.8 2.08
ASDVX American Century Shrt Dur Strat Inc Shrt Invest Grade Dbt BBB 6.9 4.98
APOIX American Cent. Short Inf Prot Bnd Infl Prot Bond AA 3.6 14.57

Source: Author Using MFO Premium database and screener

Chart #6: Top Performing Bond Funds from Other Companies

Source: Author Using MFO Premium database and screener

All Bond Model Portfolio

I wanted to round off this article with some actionable recommendations. I chose to create an All-Bond Portfolio for the time period from July 2000 though September 2011 because it covers two recessions where inflation was higher than the 2% target and two recessions when the Fed funds rate was falling. It does not include the past ten years which was characterized by ultra-low interest rates and massive stimulus. Note that the “Top Notch Funds” were limited to 8 to 10 funds, but more short-term bond funds are included in the list below. Chart #7 shows the Federal funds rate and inflation during this period.

Chart #7: Model Portfolio Time Period

Source: Author Using St. Louis Federal Reserve FRED Database

I selected the “Top Notch Funds” from this time period. I used Portfolio Visualizer to select one fund from each category and then to select ten funds to maximize an equal weighted portfolio. The link is provided here. Chart #7 shows the final ten funds for the twelve-year period. These are the categories of bond funds that I will be using to build the bond portion of my portfolio throughout the year in addition to Treasury ladders to match withdrawal needs. Note that Portfolio Visualizer is effectively building a bucket list of shorter-duration bond funds for stability and longer duration for higher returns.

Chart #8: Funds Selected to Build the All-Bond Portfolio

Source: Author Using Mutual Fund Observer

Chart #9 compares the All-Bond Portfolio to the Vanguard Balanced Portfolio (VBINX) over the twelve-year period. Note that the two bear markets in this time period were unusually severe. I believe that investors should have diversified portfolios across multiple asset classes, but the chart suggests that holding more quality bonds over the next few years or longer may result in higher returns and lower volatility.

Chart #9: Equal Weight Bond Portfolio vs Vanguard Balanced Fund

Source: Author Using Portfolio Visualizer

The All-Bond Portfolio outperforms VBINX because it has higher yields and continues to make money during recessions rather than experiencing losses.

Chart #10: All-Bond Portfolio Performance by Year

Source: Author Using Portfolio Visualizer

Closing Thoughts

Last year, I bought ladders of short-term certificates of deposits and Treasury so that they mature every month or so. This allows me to evaluate the current environment each month and to make a small decision of whether to hold cash, extend bond durations, buy bond funds, or buy equity funds. I will complete the construction of bond ladders in the next month or two extending over the next eight years. At that point, my expectation is that I will switch and invest in some of the bond funds covered in this article.

I expect to remain over-weight in bonds for the remainder of this year, but buy equities during significant dips. As I mentioned last month, I will continue to look for opportunities to add to Columbia Thermostat (CTFAX/COTZX), American Century Avantis All Equity Markets ETF (AVGE), and possibly Allianz PIMCO TRENDS Managed Futures Strategy (PQTAX). After increasing allocations to bonds, I will look for opportunities to shift allocations from mixed asset funds to equity funds.

As a follow-up to previous articles, Standpoint Multi-Asset Investor has an institutional class (BLNDX) which is available at Vanguard with lower fees but a higher minimum requirement. The investor share class (REMIX) is available at both Vanguard and Fidelity.

Short Term Performance of Long-term Recommendations

By Devesh Shah

The eternal flaw of investment gurus, both on the web and elsewhere, is that they’re never held accountable for their bravado and bold recommendations. It is in the nature of the beast that one right guess lives on forever while an infinite number of horrendous recommendations vanish from the public mind. I think of Elaine Garzarelli, who made her fame from one right call – an impending market crash a week before the actual “Black Monday” crash in 1987 which saw the Dow drop 22% (7300 points in today’s terms) in a day – but somehow dodges rebuke for her July 1996 call for a 15-25% crash at the outset of the greatest bull market ever.

That same dynamic holds true for virtually everyone creeping (I use the word advisedly) into your inbox or newsfeed. They’re counting on your willingness to click on anything that’s sufficiently dramatic … and to quickly forget anything that never comes to pass.

Mutual Fund Observer is a non-profit organization; we exist to do good for investors, not to profit from clicks or hysteria. As a result, we hold ourselves to a higher standard. David Snowball, for example, publishes and critiques his own portfolio at the start of every year and has done so for 15 years. He also publicly announces each fund added to or dropped from his portfolio. Charles Boccadoro, our MFO Premium colleague, maintains a performance table of every single fund ever profiled here and updates it monthly. While “total return” numbers of a very limited tool, since they account for neither risk nor consistency, they’re a helpful tool in the effort to be transparent.

In that same spirit, I hope to look back on a number of articles I have written in the last 12-14 months with an eye to judging the market calls. I will capture the total return performance of the asset classes and funds. This is a way for me to honestly track what’s working and what’s not, and perhaps why, and for you to gather trust in my writing. Many of the themes continue to be relevant, so I hope you will read this article.

February 2022: Thoughts on Inflation Protection

Idea: Consider owning short-dated Inflation bonds as a way to protect portfolios against rising inflation and as a way to position Fixed Income in a Government backed security with less duration. E.g.: VTIP, STIP

Performance: 2/1/2022 to 3/31/2023

Fund/Asset Class Total Return
Vanguard Total Bond Market Index Adm (VBTLX) -8.4%
¡Shares 20+ Year Treasury Bond ETF (TLT) -22.9%
iShares TIPS Bond ETF (TIP) -6.6%
Shares iBoxx $ High Yield Corp Bd ETF (HYG) -5.5%
iShares iBoxx $ Invmt Grade Corp Bd ETF (LQD) -11.1%
Recommendation: VTIP/STIP +0.2%

What now: Short-dated TIPS are still a good placeholder for conservative fixed income portfolios, having stayed flat when all fixed income was down. Short dated TIPS are actually now significantly better than Series I Bonds in capturing inflation as the real yield on short-dated TIPS is around 1.5%, while on Series I Bonds real rate is presently 0.4%. Remember, both bonds will capture the CPI going forward. There has been chatter about dividend payout timing. Ultimately, both bondholders get paid the CPI-U. They are just lagged differently and paid at different moments.

***

January 2023: Long-dated TIPS bonds: A margin of safety

Idea: Almost a year later, I wrote the time for buying Longer dated TIPS had arrived at the turn of the calendar year. The margin of safety exists. This was effectively a call to increase duration risk in Inflation linked Bonds. While I chose to buy the 30-year Bonds directly for my portfolio (along with NY Municipal bonds for fixed income), the column suggested LTPZ as an option for those who chose to do something here.

Performance: YTD 2023

Fund/Asset Class Total Return
Vanguard Total Bond Market Index Adm (VBTLX) +3.2%
¡Shares 20+ Year Treasury Bond ETF (TLT) +7.4%
iShares TIPS Bond ETF (TIP) +3.4%
Shares iBoxx $ High Yield Corp Bd ETF (HYG) +3.7%
iShares iBoxx $ Invmt Grade Corp Bd ETF (LQD) +4.7%
Short-dated TIPS: VTIP +2.4%
Recommendation: Long-dated TIPS: LTPZ +5.9%

What now: Long-dated bonds with duration did well in Q1 2023 as all kinds of yields declined. There was tremendous volatility across asset classes. Government Bonds did their job. They zagged when risky assets zigged. For those who were able to rebalance into stocks at opportune times, bonds served their purpose well.

I continue to hold Long-Dated TIPS. My rationale is as follows:

A: If inflation is sticky, TIPS will earn the coupon through inflation. The price of the bonds might fall if the Federal Reserve aggressively raises rates, even as inflation coupons help. TIPS might also help in a run-away excessive inflation scenario.

Nota bene: This did not happen in Q1 despite high inflation prints. TIPS did poorly on days when long-dated bonds did poorly. Overall, TIPS held up due to both inflation and duration element.

B: If inflation comes under control, the Federal Reserve would lower interest rates and benefit all manner of bonds. TIPS would benefit too.

I understand long-dated bonds and their volatility are not for the conservative investor. You must make your own decisions as to what the right maturity of TIPS you might want to hold.

***

April 2022:  On Active vs Passive Equity Mutual Funds

Idea: Passive funds work better than Active.

Performance: I point to the SPIVA U.S. Year-end 2022 report from S&P Global

https://www.spglobal.com/spdji/en/spiva/article/spiva-us

What does it say: Because the S&P 500 index was down 18% last year, many more active managers managed to outperform the index compared to the past. Yet, 51% underperformed in large-cap US equities. Also, “63% of mid-cap funds underperformed the S&P MidCap 400®and 57% of small-cap funds underperformed the S&P SmallCap 600® in 2022. The lowest underperformance rate among domestic equity categories was in Small-Cap Core, in which 40% of active funds underperformed. At the other end of the spectrum, the Real Estate and Mid-Cap Growth categories saw the highest annual underperformance rates of 88% and 91%, respectively.”

What now: Over the year, I have nuanced my view through learning about difference in Active and Passive in US Domestic versus International markets. I have started searching for Active Managers for international investing. I still think it’s very difficult to outperform the S&P 500 unless one takes extreme positions like holding 90% in cash or completely eschewing multiple sectors. Will look at Kinetic funds below as an example.

***

September 2022: Emerging Markets

Emerging Markets (EM) Investing in the Next Decade: The Game

Emerging Markets Investing in the Next Decade: The Players

Idea: To think about international diversification. To consider EM, and see if they fit in the portfolio, and how. To listen to various managers and watch their funds. This is an evolving process. Although, there were no recommendations to do anything, let us look at the performance of the asset class, the fund managers mentioned, and compare it to the S&P 500.

Performance: September 1, 2022, to March 31, 2023

Fund/Asset Class Total Return
Vanguard FTSE Emerging Markets ETF (VWO) -1.3%
SPDR® S&P 500 ETF Trust (SPY) +3.2%
Seafarer Overseas Grand Income Instl (SIGIX) +4.9%
Seafarer Overseas Value Institutional (SIVLX) +8.3%
Rondure New World Institutional (RNWIX) +6.9%
William Blair Emerging Mkts Ldrs R6 (WELIX) +1.1%
Pzena Emerging Markets Value InstI (PZIEX) +10.6%
Causeway Emerging Markets InstI (CEMIX) 0.6%
Harding Loevner Instl Emerg Mkts I (HLMEX) 3.3%

What now: It’s heartening to see that EVERY single fund manager outperformed the Emerging Market ETF and that many of them even beat the S&P 500 in the same window!! Pzena, Seafarer, and Rondure did very well out of the managers we covered then.

This is excellent news for the fund managers and their investors. We continue to follow them, learn more about them, and based on our own risk appetite, might choose to invest in them.

***

November 2022: Kinetics Mutual Funds: Five Star funds with a Lone Star Risk

Talking about Active management in the US. We pointed out that some of the Kinetic funds had outperformed magnificently in the run-up to this article for a number of years. But they did so in an incredibly risky manner. They held an extremely large weight in one company – Texas Pacific Land. I didn’t know and still don’t know much about how to value Texas Pacific, but Kinetics funds felt very risky and lopsided. Looking at performance since the article:

Performance: November 2, 2022, to March 31, 2023

Fund/Asset Class Total Return
Texas Pacific Land -27%
SPDR® S&P 500 ETF Trust (SPY) +10.1%
Kinetics Spin-Off and Corp Rest Adv A (LSHAX) -17.4%
Kinetics Small Cap Opportunities No Load (KSCOX) -13.2%
Kinetics Paradigm No Load (WWNPX) -17.1%
Kinetics Market Opportunities No Load (KMKNX) -13%
Kinetics Global No Load (WWWEX) -2.2%
Kinetics Internet No Load (WWWFX) -1.8%

What now: Texas Pacific declined 27% as the S&P 500 went up by 10%, and the funds are all down between 2% and 17%. The lopsided risk management sword cuts in both directions. As of December 31, 2022, holdings from Whale Wisdom (who have provided this Mutual Fund Observer columnist a complimentary subscription), it looks like there has been a small reduction in the holdings of TPL. A step in the right direction but still very far away from shore.

***

October 2022: Closed-End Private Real Estate Interval Funds: A Job Well Done! Thank You and Bye-bye.

Idea: Private Closed-end Interval Real Estate Funds, funds like Bluerock Total Income (TIPRX), and a few others were killing it in 2022. Many other funds of the ilk were up, were crushing the public REITs, and were receiving massive inflows given the size of their NAVs as new investors were chasing old returns.

Performance: Since then, TIPRX has lost 8.9%. They received money throughout Q4 2022, and outflows have only started in 2023 as fund performance has lagged.

What now: Well, I am bummed that although we flagged these types of funds, I didn’t flag the biggest elephant in the room, the BREIT or the Blackrock Real Estate Income Trust, which went through a lot of public scrutiny when they gated the fund, blocked withdrawals, and continue to do so even now.

Existing private REITs are still massively mismarked versus their public counterparts. We see this manifest when there are credit events and landlords like Blackrock are handing in their keys on select properties. The equity jumps from a mismarked number directly to pennies on the dollar or zero. Avoid mismarked Private REITs.

Artisan Developing World Fund interview

By Devesh Shah

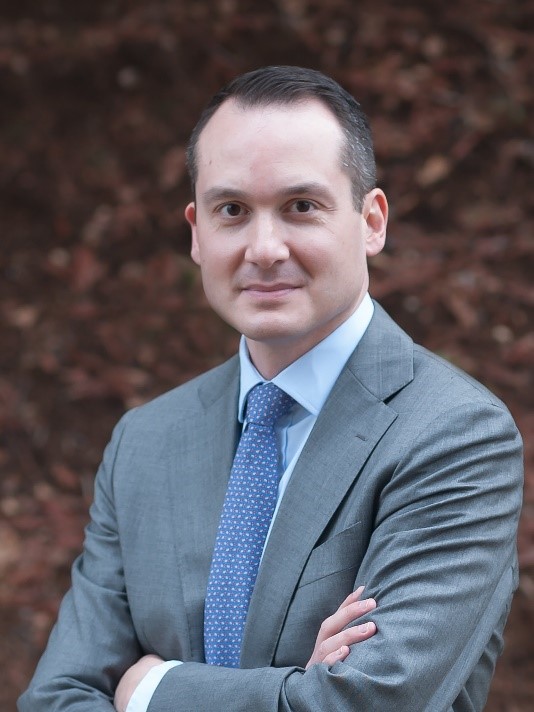
An interview with Lewis Kaufman, founding portfolio manager of the Artisan Developing World Fund

My primary investment biases are two-fold. First, in general, I invest in public markets through low-cost, low-turnover passive vehicles. Second, in general, I invest in US equities. Both of those biases were arrived at through a combination of (painful) experience and careful research. That said, none of us benefit from being held hostage by our beliefs. In many ways, humility and self-doubt, curiosity, and the determination to keep learning are the hallmarks of our wisest citizens. And I aspire to learn from them. In consequence, I’ve spent a huge amount of time over the past six months talking with a cadre of the industry’s best emerging markets managers.

Home Bias

Investors worldwide have a powerful bias toward investing disproportionately in their home country. That’s true whether “home” is the US, India, or France. A June 2022 research paper by Martin Wallmeier and Christoph Iseli in the Journal of International Money and Finance titled “Home Bias and Expected Returns: A structural approach” shows the level of domestic securities owned by investors in various countries around the world. As of 2020, US investors held 81.63% of their assets in US equities. This resonates with me as 85% of my equity assets are in the US.

Most of us are aware of two important things – one, it would be nice to be geographically diversified outside the US for a greater percentage of our investments. And two, it’s been a complete waste of time to try, as the returns outside the US have simply not kept up with domestic returns. A lot of my columns on EM investing and funds (1), (2), (3), and (4) are my endeavor to unearth interesting fund managers and funds for me to diversify.

I’ve tried to share my discoveries over the months.

This month I’m delighted to continue that journey with you by reviewing my conversation with Artisan’s Lewis Kaufman, demonstrably one of the best of the best.

We’ll structure this travelogue around five topics:

  1. Who is the guy?
  2. What does he do when it comes to managing?
  3. How does he do?
  4. What does he believe about the current state of EM investing?
  5. Finally, what did I – and what might you – take away from the exchange?

Who should read this article?

Everyone.

Who should invest in Artisan Developing World?

Not everyone.

This is an actively managed fund with a 1.3% expense ratio, focuses on emerging markets, holds Chinese stocks, and despite its fantastic cumulative returns, suffered a brutal drawdown in the 2021-2022 bear market. Even if any or all of those things put you off, you should still read this article and follow the fund. You will walk away with lots of investment nuggets from understanding Kaufman’s perspective on emerging markets and equity investing in general. For the right investor with a solid risk appetite, this fund might be very interesting. I think Lewis Kaufman is an excellent investor with a solid investment process and demands a very close look.

Topic one: Who is this guy?

Artisan Partners and Lewis Kaufman

Artisan has a distinctive partnership model. It starts by adding partners, generally, entire management teams, that Artisan believes are phenomenally talented. MFO’s publisher, David Snowball, has been following Artisan for a quarter century and describes them as one of a tiny handful of consistently successful boutiques. Artisan conducts due diligence on dozens of management teams each year but might find only one team every two years that meets their standard. That standard is not that the team is very good; it’s that the team has the capacity to crush its category. They brought in 10 teams since their founding in 1994 and give each of them both support and autonomy. That means bringing in investment talent at a thoughtful pace. More information on their model can be found here.

Lewis Kaufman is one of the most distinguished emerging market managers in the industry. He has been an investment professional for more than two decades. He made his name and came to Artisan’s attention as manager of Thornburg Developing World Fund from inception through early 2015. During that time, he amassed a remarkable record for risk-sensitive performance. A $10,000 investment at inception would have grown to $15,700 on the day of Mr. Kaufman’s departure, while his peers would have earned $11,300. Morningstar’s only Gold-rated emerging markets fund (American Funds New World Fund NEWFX) would have clocked in at $13,300, a gain about midway between mediocre and Mr. Kaufmann.

Lewis Kaufman has been an investor for 24 years, has traded many market cycles, is highly informed on macro and micro, speaks very fast, and ties in themes, stories, and stocks from all over the EM world. He graduated cum laude with a bachelor’s degree in English from Colgate University and holds a master’s degree in business administration from Duke. He has earned the ridiculously rigorous CFA Charterholder designation.

Topic Two: What does he do?

The Artisan Developing World Fund launched in June 2015 under Mr. Kaufman’s leadership. Mr. Kaufman pursues a compact, primarily large-cap portfolio. He’s willing to invest in firms tied to, but not domiciled in, the emerging markets. And he has a special interest in self-funding companies, that is, firms that generate free cash flow sufficient to cover their operating and capital needs. That allows the firms to insulate themselves from both the risk of international capital flight and dysfunctional capital markets, which are almost a defining feature of emerging markets. The fund currently has over $3 billion in assets.

The picking of stocks and the running of a portfolio is a highly complex process for even an individual. For an active manager, these challenges are compounded: which stocks to own, when to rebalance, when to exit, what makes a new stock worth owning, how to fund it, the external macro risks, portfolio drawdown considerations, and most importantly – PROCESS CONSISTENCY.

For experienced investors and for those who wish to become experienced, listening to Kaufman’s investor update would be a good way to understand the process.

“Process Consistency allows value creation in moments of chaos rather than impairing capital. It provides us staying power and a way to tackle a wide array of problems.”

The manager uses two main strategies: Flexion and Correlation.

Correlation is easier to understand. The fund looks for companies that have a return profile similar to the other stocks in the fund (that is, the possibility of extraordinary returns). However, they look for these stocks to be uncorrelated to the existing stocks in the portfolio. The idea is for these correlation stocks to provide a ballast to the rest of the portfolio and allow the ability to reduce capital in these Correlation stocks in order to add to the Scalable stocks. In effect, the better term is Uncorrelated Stocks, but we get the point.

What is Flexion? According to Kaufman, it is a way to preserve the integrity of outcomes.

Take this example he gives: “Suppose I have specific concerns about risk in China. I own a stock that is down 40% from the high. It is currently 3% of the portfolio. Suppose I blow out of the entire stock. I have 300 bps of capital to decide what to do with. I don’t want to abruptly blow out of a stock, or a region, only to then chase the stock on the way up. My instinct is contrarian, not momentum. Instead, I can be more gradual in my selling approach and wait for other, better businesses to become available at good prices. Then, when I trim my existing position, I can add to the other better business. And I also preserve the optionality that my existing position has a chance to reflate back. For example, SE was down 70% last year and is already up 65% in 2023.”

The fund wants to trim positions at moments of low reinvestment risk such that investor capital will not be impaired. This, by the way, does not mean there will not be volatility. This fund is not a money market or even a bond fund! It clearly has a lot more volatility than most funds. But it is thoughtful, preconceived, and expected volatility. It’s not like the ARKK fund that hopes to ride momentum or some macro theme. The manager is providing capital to companies that are trying to run an investment program where the process comes before everything else, and the goal is to generate disproportionate equity outcomes. This does not work well in all kinds of markets and economic environments. In an extremely bad economic scenario, these companies and the fund will be hurt. The period from 2019 to 2023 is instructive in the large rallies and sell-offs the fund endured. Kaufman’s faith and discipline in his process have kept him steering the ship, but not without stomach-churning periods.

Kaufman added, “In adverse periods, people tend to lose their process. Some managers went all into ESG, and then two years later, you look at the portfolio, and there is Exxon and BP in the fund. I am trying to be very consistent with my investment program. Historically, and I have invested for 24 years, the portfolio has a strong track record and emerged very well coming out of a crisis.”

Topic Three: How does he do?

Quite well. And for quite a long while.

By all of the risk and risk/return measures we follow, he achieved those gains with lower volatility than his peers. Here’s Thornburg under his watch.

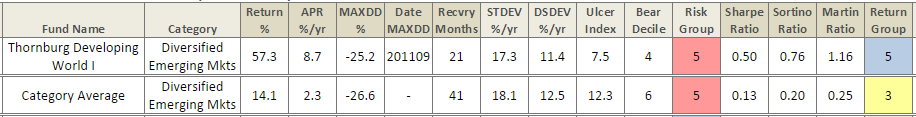
Mr. Kaufman’s performance at his previous charge is remarkable: he posted returns that were 370% of his average peers’ while having a lower maximum drawdown, a lower standard deviation, a lower downside deviation, and a vastly higher Sharpe ratio. We can compare that to the performance of his current charge.

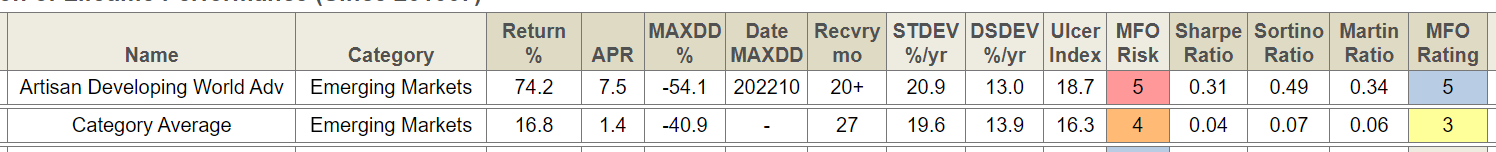
Since its inception, Artisan Developing World has had returns that are 570% of its average peers. The volatility advantage that Thornburg held over its peers has largely disappeared, but the difference in returns is so much greater that Artisan’s Sharpe ratio is almost eight times higher than his peers.

Let us be clear about this: Mr. Kaufman has a 5:1 return advantage over his peers after two purely disastrous years. In 2021 he lost 10% and trailed 90% of his peers, and fans might have asked, “how much worse can it get?” They got their answer in 2022 when he lost 41% and trailed 100% of them.

Yikes.

At this point, bad investors would declare, “well, he’s lost it,” and would bail after suffering enough. Good investors, contrarily, would ask, “how can we make sense of this? And how can it help us position our portfolios for the future rather than for the past?” Because we have faith in you and we try to help our readers become better investors, those are exactly the questions we explored on your behalf with Mr. Kaufman and his team.

We know investing internationally has been a tough neighborhood, but the Artisan fund has produced excellent absolute and relative results. But how has it managed to do so, and why should we spend time on it? To understand this, Mutual Fund Observer sat down with Lewis Kaufman and his team. Through our Q&A and his deeply insightful Q4 2022 Investor Update, I have learnt a lot. In this article, I hope to outline – Kaufman’s evolving thesis on emerging markets, his investment PROCESS, his understanding of relative risks in places he is NOT invested, and why he believes in his investment style and process.

Topic Four: What does he believe about the current state of EM investing?

Some of the questions from our extended interview follow.

Question: how would you place your discipline on the growth – value spectrum?

“My impulses are not momentum oriented. My impulses are contrarian in nature,” says Kaufman. “I am running an investment program with a very consistent process with a portfolio of securities which have the potential of delivering disproportionate equity outcomes. It baffles me that people think you can only be value oriented in value stocks. We have a high growth, high valuation set of assets that have experienced extreme valuation compression (ed. note: in 2021-2022). We don’t own companies that are ever going to be 10x earnings. Airbnb, Mercado libre, Crowdstrike, Nvidia, and Adyen are some of our top holdings. They trade at 45x next 12-month earnings vs. an average of 140x a year ago. The multiple compression came from prices going down but also because earnings are compounding. Is 45x the right multiple? I don’t know, but it’s a whole lot lower than 140. Because of our process (ed. note: described below), we have a history of coming out very strongly when the cycle turns.”

Returns of the Artisan Developing Fund selected years.

Life 2019 2020 2021 2022 2023 Q1
8.31% 41.89% 81.52% -9.7% -41.27% 21%

“Relative to the past, this bear market (2021-2022) has been concentrated in scalable assets that are most consistent with long term value creation. In the past, some of the best stocks were scalable stocks like Mercado Libre. In this market drawdown, they have been the worst stock. In previous market cycles, they behaved differently. But maybe in the future, these stocks will be more resilient,” says Kaufman.

Question: how have emerging markets as an asset class evolved?

Early on, Kaufman believed that the demographic dividend plus high productivity potential might lead to high potential GDP across EM countries. China’s entry into the WTO and the commodity boom of the first decade in the 21st century benefitted many EM countries.

“Many investors still think of EM as being a low penetration, high growth area, but since 2009, I have operated with a different thesis. Emerging Markets are not progressing in an optimal way, which is constraining the growth and demand opportunity. The countries want to grow, but they are unable to manifest this growth for many reasons.” Understanding those constraints has helped Kaufman decide what to invest in and what to avoid.

“Starting the year 2015, it was becoming obvious that potential GDP was falling. Instead of investing in human capital, many countries had engaged in fiscal transfers and caged themselves in the middle-income trap.”

“Large pools of skilled labor do not exist, except in China. Most emerging markets do not have enough pools of savings to encourage domestic capital formation (that is, allow companies to raise money from local investors). They depend on foreign capital. But to a large extent, foreign capital investments have slowed down. As productivity and output are slowing, with limited innovation happening there, capital is averse to entering emerging markets.”

“Brazil was once expected to grow at 4.5-5%, but now most economists put that number at 2.5%. India was expected to once grow at 9-10%, and now 6-6.5%.”

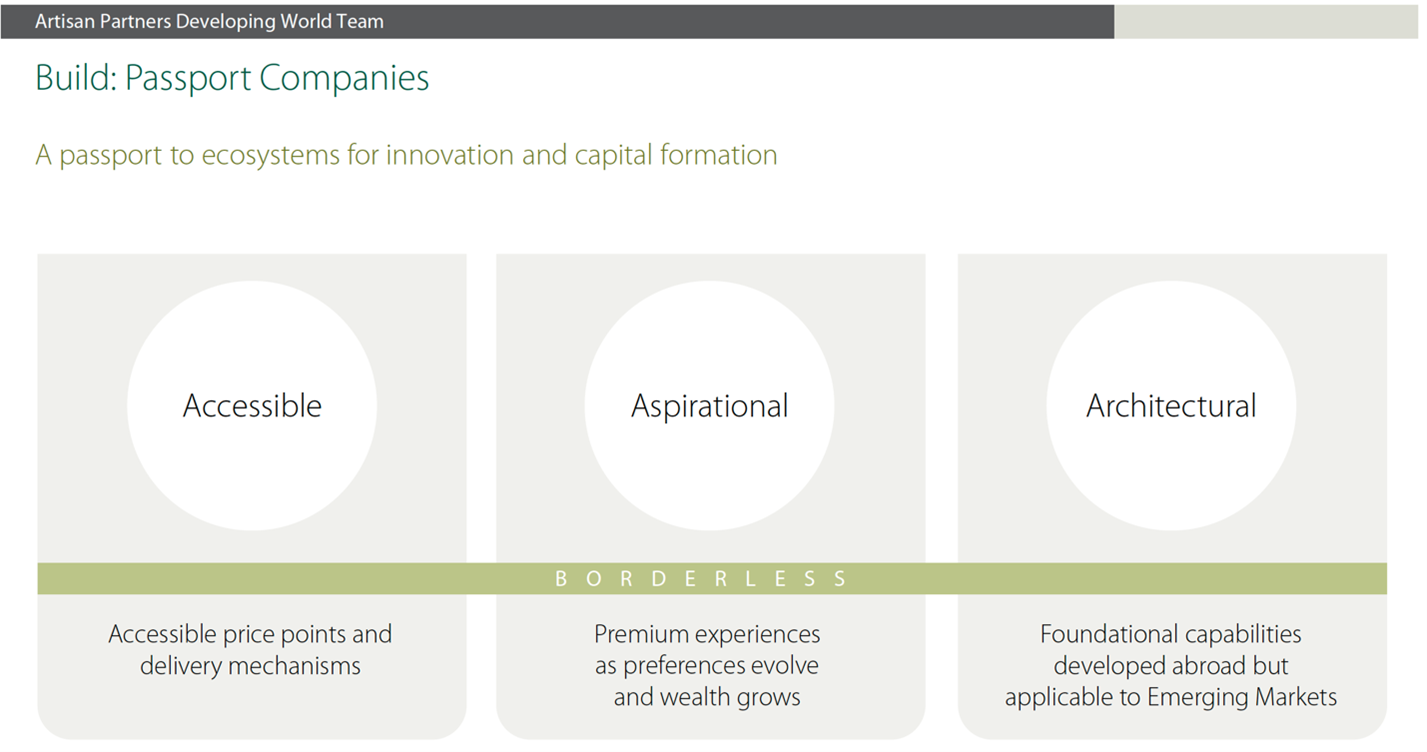
Kaufman does not see himself as a cheerleader for the emerging market asset class. Instead, he now sees Emerging Markets as large latent pools of domestic demand. He believes different tools are needed to invest in this EM world, and for him, those tools are to find Scalable Companies and Passport Companies. These companies have the “potential for disproportionate equity outcomes,” a phrase he keeps revisiting many times. Scalable companies are able to transcend the constraints, and Passport companies are able to cross borders easily to meet customer demand.

This thesis has led Kaufman to assemble a portfolio that looks very different than an MSCI EM Index or even the average EM actively managed fund. While the MSCI EM Index has 1375 securities, the fund has 33 stocks. 55% of the fund is invested in developed markets, in stocks such as Airbnb, NVIDIA, SEA Ltd, Visa, and Crowdstrike.

Help us understand why you have such a high percentage of stocks in developed markets, we asked: “The Passport companies (like Nvidia and Airbnb) are bringing the innovation and capital formation to the EM. Of course, in the case of Nvidia, they have a meaningful part of their business coming from the EM already. And Airbnb fits in the aspirational category as the EM population desires travel and experiences in the same way that the developed market population does. With the prevalence of the economic constraints in the EM, we find Passport Companies to be an important tool.

What about scalability and tapping large pools of latent demand? “We believe that businesses with scalability are uniquely able to transcend those constraints. So, in the case of Mercado Libre, Brazil and Argentina might not be progressing in an optimal way. However, MELI’s ability to generate revenues from multiple sources with favorable business economics is allowing them to extract value from that latent demand pool. Crowdstrike is a different case where it certainly has scalability, and it is passporting – crossing borders easily to meet demand. It is also providing a foundational capability to the emerging markets since security software simply is not as available or advanced in the emerging markets.”

Most investors know the general markets and some mutual funds or ETFs well. We certainly don’t know individual stocks at the level active fund managers and hedge fund managers would. I don’t drive myself crazy understanding the rationale on each position. Learning about individual investments made by a fund manager is part of the equation to investing in a fund but not the only reason to invest or avoid a fund. Stock positions should offer a window of transparency, not a prediction of the future.

Question: how do you see the role of China in an EM portfolio?

China: It is the one large country in EM unique in the level of income achieved and structural drivers. In 2022, despite Zero Covid, Social Finance grew by double digits in China. It has more capacity for domestic capital formation (that is, domestic companies can raise money from the locals) than any other EM country and is less dependent on foreign capital than others. Kaufman talks about his individual Chinese company picks in the Investor call. He talks through why he believes companies like Meituan are scalable. They have 100s of millions of wealthy users across Tier 1 and Tier 2 cities across China. When they order food through Meituan’s food delivery app, the ticket sizes are bigger, they order more frequently, and they order desserts. Meituan has a local service business that serves as a YELP function for its customers. They receive advertisements from the businesses. Thus, the company is able to monetize its fixed R&D in multiple revenue streams (much like Mercado Libre above).

Adds Kaufman, “Economically, for the reasons discussed (skilled labor and domestic capital formation), China is more attractive than the other EM countries. However, external risks have risen. Given this backdrop, we have allowed our weights to come down naturally, kept alignment to our highest conviction companies in China while using the China reduction to add to other opportunities (at periods of low reinvestment risk). Even with the lower weight, our alignment to what we see as the better opportunities has preserved the participation in the opportunity and the correlation advantage, yet we have reduced the risk.”

While they don’t measure their over/underweight to the benchmark, the fund is running about 10% underweight to China.

Related question: what, then, is the role of India?

With a country of over a billion people, India would seem like a natural place for the fund to invest. However, HDFC Bank is the only investment the fund has there.

“We know the companies well in India. We have invested in the past. All those companies are durable, not scalable. Not conducive to disproportionate equity outcomes. Define all of them by constraints of affordability. Define all of them as expensive due to demand by foreign direct investors and domestic mutual fund investors.”

I pressed him for his source of discomfort for getting bigger on India. He said he would like to provide capital to Indian companies, but the opportunity is not right. India needs to create more high value jobs outside of agriculture. Right now, investible India is a population closer to 200-300 million people for the services that can be sold and for the company in which he can invest that sell those services. India needs more capital formation and needs companies to invest in jobs, which can create consumption, which creates the ability to lever up. Apple and Foxconn are trying but mostly down the value chain. More capital formation needs to happen higher on the value chain.

“India is not China in the size of its wealthy consumers. Besides, the large mutual fund industry is captive for the stock market there. And valuations aren’t cheap. Ten years ago, I was invested in Asian Paints, Dabur, Titan. Revenues were growing mid-teens and P/E multiples were around 21-22 times. Today, the companies have matured. Revenues are growing high single digits and P/E are 45 times. Much of the total returns in India in these stocks has come from multiple expansion over the time period.”

For a specific stock investment he avoided, Kaufman gives the example of Zomato, which came public in 2021. In India, the customer base of users is closer to 75mm, much smaller than in China. Ticket sizes are smaller, and people order less frequently. The Indian restaurant business is unlikely to become formalized, which means less organized merchant partners with budgets to bring on for ad dollars.

Kaufman also stayed clear of Paytm, which had a public offering in 2021. “Turned out the business has been disrupted by Indian direct payment systems.” According to Kaufman, “India hasn’t been a trustworthy partner for foreign investors. Sometimes, the goalpost moves. Regulations change and are altered to be favorable to domestic players. We want to be involved in India, but we need stocks and capital formation, and we are not going to invest in India just to meet a benchmark number. We need companies to be aligned to what we are trying to do.”

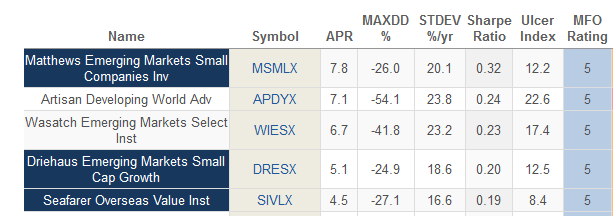
As I mentioned last month, I have been invested in India through private equity and hedge fund, and they are both doing just fine. Not everyone is looking to invest in a scalable business the way the Artisan Developing fund is looking to do. There are many ways to skin a cat. Seafarer’s International Value fund, for example, a topic of David Snowball’s column this month, while not invested in India, is generally a vehicle where Paul Espinosa looks at traditional value, as opposed to Kaufman’s growth value.

Question: at the other end of the spectrum are the frontier markets countries. Do you have much interest in them? If not, why not?

In the Investor call, Kaufman lays out very clear reasons why he finds most of Africa uninvestable – the lack of an institutional framework for FX in Nigeria, and corruption in S. Africa. In Latin America, the fund has investments in Mercado Libre and Nu Bank but not much else. The shift to the political left as a form of populism is leaving much of Latin America unfavorable for equity investments. He doesn’t consider Mexico’s AMLO trustworthy for business, despite the potential for massive friend shoring there. Many Middle Eastern countries are too dependent on commodities. In South-East Asia, the fund is invested in SEA Limited, but not much else. Thailand cannot go up the value chain. The Philippines cannot create jobs. Vietnam is a small market. Indonesia is interesting but needs more companies. None of these can raise large domestic capital for their companies and are foreign-dependent. Even more dependent on foreign capital are countries which sporadically have huge returns and otherwise crash – Turkey, Egypt, Colombia, Peru, Chile, and Poland. There are a lot of external risks, weak institutions, and political considerations that make most of these countries uninvestable.

Perhaps I learnt the most from one sentence Lewis Kaufman said, “There is just not a lot going on.”

As investors, we have to pause and process that sentence. What are we doing when we are being passive investors in Emerging Markets or in International Markets? We are trying to extract risk premium because that’s what we’ve been told makes sense. But does it always?

If countries cannot raise domestic capital, if their institutions are broken, if they have large populations but low income, and if the customers have inconsistent and tenuous consumption habits, then the companies that are trying to build capacity there will not be able to use operating leverage to compound earnings. When there is not a lot going on, supplying capital as equity holders makes little sense for us to do. Especially if valuations are not super low, like in India.

Maybe there are other ways to invest in those markets. FX or Bonds could be interesting in Brazil and Mexico, but equities are a different kind of beast. The companies need to be fed a lot of customer transactions to monetize. It’s not easy to get repeat customer business. The Artisan Developing fund’s investment program is trying to find and stick consistently with such scalable and aspirational companies that can figure it out. Lewis Kaufman does not want to invest in companies unless they are aligned with his process.

Topic Five: What we’ve learned and what we might do

I now believe this Artisan fund will soon find its way into my portfolio, just as Seafarer and Moerus have been added in the last six months. William Blair’s EM funds, run by Todd McClone, is also on my very short list.

Every individual investor has their own risk parameters and personal situations. No fund is correct for every investor. No writer should recommend a fund for all investors. Therefore, here’s what I ask myself and encourage you to ask yourself:

Am I a good investor in the kind of companies this fund picks? I am not. I can’t keep up with so many companies. And I don’t know which ones are good and which are bad. Because I know this about myself, I want to complement my portfolio with the skills of someone who does.

Do I need to be in Emerging Markets and international stocks? Chinese stocks? Well, I’d rather just make a lot of money without doing anything too difficult in life, watch PBS, and play some tennis. But I am young, have a young family, and hope to stick around long enough that I consider both the holding of equities and the withstanding of volatility in equities an important part of my future experience and return set. Returns in stocks are not like earning income in money market funds. Stock returns are lumpy. And passive has not worked internationally and in EM. I look at the Artisan fund with great attention to what it’s done and to the seriousness of the process followed by the fund manager.

Does the Artisan fund represent the right manifestation of that international investment? I can’t predict the future. Not the future returns, nor the volatility, nor the macro environment which we are going into. I want a group of fund managers who are each believers in their investment style, are invested in their cooking, and are willing to wear the volatility of underperformance. More than anything, I pray for each one of them to be lucky.

The Artisan Developing World Fund warrants our attention. Lewis Kaufman and his team have generated substantial total returns in a complex market environment. When I listen to him, I find a rational, thoughtful, long-term investor who understands why people need to hold equities in their portfolios.

Osterweis Strategic Income Fund (OSTIX), April 2023

By David Snowball

“Yearning for the good old days is not an investment strategy”

Objective and strategy

The strategy is to preserve capital and attain long-term total returns through a combination of current income and moderate capital appreciation. The managers invest in income-producing securities, primarily high-yield bonds, but will shift the allocation to managing a changing risk and opportunity set. Such changes might include shifting toward higher quality or shorter duration securities and increasing the fund’s cash stake. As of February 28, 2023, 77% of the portfolio is invested in high-yield bonds with an average duration of about 2.6, and 13% is held in cash. The 30-day yield is 6.9%.

Adviser

Osterweis Capital Management. Headquartered in San Francisco, the firm by founded in 1983 by John Osterweis. Their firm-wide ethos is “the avoidance of major losses in falling markets and the compounding of reasonable gains in rising markets.” They provide investment management for individuals, families, endowments, and institutions. In 2022, the Zeo Capital Advisors team joined Osterweis, bringing their two mutual funds under the Osterweis moniker after shareholder approval. The firm advises seven mutual funds, and as of 12/31/22, assets under management were $6.4 billion.

Managers

Carl Kaufman, Bradley Kane, and Craig Manchuck.

Mr. Kaufman is the co-president and co-CEO for Osterweis Capital, as well as the CIO for the strategic income strategy. He has managed the fund since 2002 and co-manages Osterweis Growth & Income.

Mr. Kane joined the team in 2013. Prior to joining Osterweis Capital Management, LLC in 2013, Mr. Kane was a Portfolio Manager and Analyst at Newfleet Asset Management, where he managed both high yield and leveraged loan portfolios.

And Mr. Manchuck came on board in 2017. Prior to joining Osterweis Capital Management in 2017, Mr. Manchuck was a Managing Director of Fixed Income at Stifel Nicolaus from 2013 to 2016 and Knight Capital from 2008-2013, where he was responsible for sales and origination of high yield bonds, leveraged loans, and post reorg equities.

Collectively the team has 100 years of investment experience and manages about $5 billion in fixed-income assets.

Strategy capacity and closure

Mr. Kaufman notes that $7.3 billion, the fund’s previous asset peak, “was not a strain,” and they’re billions below that. His recommendation is that we “ask again at $10 billion.”

Management’s stake in the fund

Mr. Kaufman has invested over $1 million in the fund, Mr. Kane is north of $500,000, and Mr. Manchuck has over $100,000. In total, eight of the firm’s managers and three of its trustees are invested in the fund. The source for all of that is the 3/31/2022 Statement of Additional Information.

Opening date

August 30, 2002.

Minimum investment

$5,000, reduced to $1,500 for IRAs and other tax-advantaged accounts. Individual brokerages, e.g. Schwab, can set other limits.

Expense ratio

0.84% on assets of $4.7 billion, as of July 2023. 

Comments

Remember all the homely bits of the good old days?  A roll of freshly churned butter and milk that had to be shaken to distribute the cream. The evening paper on the coffee table. Pa reading aloud from his favorite feature in the latest Reader’s Digest, “Laughter is the best medicine.” Ma working on the pan gravy that went with her fried chicken. Global admiration for America’s three greatest generals: General Electric, General Mills, and General Motors. Single-digit P/Es, 14% interest on passbook savings accounts, and interest rates just beginning to drift down from the stratosphere. To paraphrase Mr. Banks in Mary Poppins, “money is sound, credit rates are going up, up, up, and the American dollar is the admiration of the world!”

All of which are wonderful memories but dismal grounds for constructing an investment portfolio for 2023 and beyond. The cold reality is that the stock market remains near historic highs, making P/E contraction more likely than expansion, and interest rates seem on track for “higher for longer.” Both raise the prospect of dismal returns for traditional strategies using indexed or index-like approaches. Layered onto that is that non-zero prospect of politicians doing something staggeringly stupid in pursuit of political gain or a moment’s notoriety.

Osterweis has a three-part plan.  It’s a clean, simple plan which reduces the risk of having it outsmart itself.

Part One: Avoid panic.

Most of today’s investors have never had to navigate markets marked by high inflation, rising interest rates, contracting P/E multiples, or the absence of “the Fed put.” If you grew up thinking that flat prices, zero interest rates, high P/E ratios, and Alan Greenspan were all your entitlements, it’s understandable that their sudden disappearance would be unsettling … and unsettled investors are prone to do stupid things.

As befitting guys who’ve seen many markets and styles and fads come and go, the Osterweis folks seem somewhere between sanguine and positively upbeat. In their early 2023 review, they write:

Once the markets have adjusted for the absence of free money (or in the case of Europe, “pay you to take it” money), what comes next? Barring a black swan event, life will continue, coping mechanisms will take hold, and markets for financial and real assets will find their equilibrium. Sometimes it helps to take a step back to have a broader view of what markets are offering today versus what we have gotten accustomed to in the past decade or so in order to find the right path to better returns.

The adjustments the markets have seen in the past year are painful, but they are presenting us with better opportunities for rational investing such as getting paid a decent return to lend money. What an old-fashioned concept! Selectivity and flexibility should be winning gambits.

Part Two: Maintain a long-term stock-bond balance.

They believe that long-term investors should maintain a 60/40 portfolio, though in individual cases, that might mean 50/50 or 65/35, but the goal is something in the direction of a stock-bond balance. The vexing question is, “what exactly goes into the 60? What’s the 40?” Their answer is 60% dividend-paying equities and 40% strategic income.

Dividend-paying stocks, in particular the stocks of companies growing their dividends, offer the prospect of capturing much of the stock market’s upside while adding a stream of income and some downside buffer.

The Strategic Income strategy focuses on investments in high-yield securities. Fixed-income investments face risk, a fact masked by 30 years of declining interest rates. For investment-grade fixed income, especially with passive strategies, the risk comes from rising interest rates that can lead to catastrophic mark-to-market losses. Osterweis believes that investors are better served by looking at securities that carry credit risk. “Credit risk” is the notion that an issuer might not be able to meet their debt payment obligations fully and promptly. That risk is controllable through a combination of good fundamental research (don’t invest in people who can’t pay their bills) and flexibility in choosing how to invest in companies:

Your readers need to understand we’re afraid of our own shadows. We don’t take a lot of risk. We look at each investment as if it were the only investment we’re going to make. One question forms our lens: “if you could only own one bond, is this the one?”

… we do a significant amount of work to determine the company’s business prospects as well as the positive and negative levers in its financial model, which influence the company’s ability to generate cash flow …our ideal investments are in companies that have great products, a competitive advantage that gives them pricing power in the market, a consistent operating history, and management that operate the company as if they own it. Finally, we determine what we believe to be the appreciation potential versus the downside risk to gauge the attractiveness of the security versus other available investment opportunities.

We’re invested in around 115 companies, far fewer than the 300-500 that are common in fund portfolios. We engage in rigorous testing, try to find the most attractive parts of the market then the least risky ways to play it. And we’re not afraid to keep cash, all of which means that the ride with us will be much smoother.

Part Three: Stay flexible.

Their research allows them to understand the risks each position poses. They have the freedom to mitigate those risks by shifting higher in the credit structure, shortening durations, shifting sector focus, or holding more cash.

… our research has shown that the various sectors of the bond market behave differently under different economic conditions.

We believe that by avoiding the “style box” trap and having the flexibility to invest in multiple classes of bonds, we can manage each portfolio in such a way as to emphasize the most attractive sector at any given time. By strategically shifting out of overvalued assets, we strive to minimize potential risk and produce better returns over time.

All of which has worked exceptionally well.

Since its inception, Osterweis Strategic Income has outperformed its Lipper peers by 90 basis points annually and the US bond aggregate by 268 basis points. Both their “normal” volatility (measured by standard deviation) and their “bad” volatility (measured by downside deviation) are far lower than the average multi-sector income fund and only marginally higher than an investment grade fund. In consequence, their risk-return metrics – the Ulcer Index plus Sharpe, Sortino, and Martin ratios – are all far higher.

Osterweis captures that same dynamic in a series of scatterplots, which we do not have a license to reproduce, that compare their fund’s 20-year returns and volatility against a series of Lipper peer groups: their native peer group, Multi-sector Income, plus High Yield Bond and Alternative Credit. In each case, the pattern is the same: OSTIX is one of the least volatile options with some of the highest returns. Another way of putting it: if you wanted somewhat better returns, you had to endure vastly higher volatility.

For those worried about bear markets: since inception, OSTIX has captured 14% of the S&P 500’s downside and 21% of the downside of a traditional 60/40 portfolio … and has a negative downside capture against the US bond market. That is, when traditional bonds have fallen, OSTIX has risen a bit (7.7%, to be exact).

Bottom Line

The record is clear. Osterweis is one of the two or three best strategic income funds available to investors. Over a period of decades, it has managed to nearly double the returns of the bond aggregate – even during a long, rate-driven bull market for investment grade bonds – with scarcely any greater volatility. Over the past decade, when the market has favored less prudent strategies, Osterweis has managed 4.0% annual returns as both their three-year and five-year rolling average. Over the long term, the fund’s three- and five-year rolling average has been around 5.8%. Mr. Kaufman believes that, with a macro environment more favorable to their style, returns of that higher magnitude remain plausible.

Investors who recognize that the era of easy, riskless returns in investment grade bonds has likely ended, at least for this generation, but who still need to prospect of steady income and ballast for a stock-heavy portfolio have an outstanding option here. They ought to explore it soon and carefully.

Fund website

Osterweis Funds

New Payment Portal for MFO Premium

By Charles Boccadoro

This past week we upgraded our payment portal on MFO Premium from PayPal Standard to PayPal Commerce Platform. We’re hopeful the new portal will make subscribing and resubscribing easier and safer.

We introduced MFO’s Rating System nearly 10 years ago, which included metrics that we found difficult to obtain at the time, like maximum drawdown, downside deviation, Ulcer index, and Martin and Sortino ratios. We also coined the designation MFO Great Owls for funds that historically provided the highest ratio of return versus drawdown in their respective categories. We then resurrected and revised MFO Three Alarm and Honor Roll designations from our legacy Fund Alarm site.

Shortly after we introduced the rating system, we provided the MFO community with a simple online fund screener called “Miraculous MultiSearch,” and a dashboard of all funds David has profiled. Today, all of our legacy ratings and basic screeners remain available freely on our MFO Premium site, which launched in 2015.

The pages and tools on the top part of the navigation bar are public and free. No need for PayPal Commerce here. Below find links to each:

Access to our premium tools, listed at the bottom of the navigation bar, does require a subscription (donation to MFO), which is $120 per year. The subscription does not automatically renew.

MFO Premium search tools feature:

  • U.S. Mutual Funds, ETFs, ETNs, CEFs, and Insurance Funds.
  • All share classes, survivors only.
  • Extensive risk and return metrics back to 1960.
  • Key US index and allocation performance back to 1926.
  • Numerous evaluation periods, including lifetime, YTD, multi-year, multi-month, decadal, calendar decade, plus full, bear, bull, and other unique market cycles.
  • Tailorable, sortable, and exportable result tables.
  • Storable Watchlists, Searches, and Preferences.
  • A suite of analytics: Correlation, Rolling Averages, Up/Downside Capture, Period Returns and Ratings, Batting Averages, Benchmark Comparisons, Trend and Momentum, Lipper Leaders, and Ferguson.

MultiSearch, our main search tool, will sort through thousands of funds based on more than 300 screening criteria, seriously. Its Pre-Set Screens provide an easy way to get a quick overview of markets and notable funds.

Other premium tools include Fund Family Scorecard, Dashboard of Launch Alerts, Portfolios, Category Averages, MFO Charts, and Quick Access Analytics. The homepage has screenshots, webinar videos, and briefings for more detail.

MFO Premium has evolved considerably since its launch, usually the result of subscriber feedback. During the first quarter of this year, we worked extensively to improve rating update speed, with the new goal of posting updates each weekend, reflecting performance through Friday.

The other focus was improving the payment portal for new subscribers and resubscribers. We’ve used PayPal Standard since 2019. Below are a couple of snapshots from the new PayPal Commerce Platform. The first is obtained for new subscribers via Login/Individual Subscription (or Corporate Subscription) link and for current subscribers via the Account/Subscriptions/Renew link.

It was also important for us to provide a payment portal that did not require a special account with the portal provider, which in this case is PayPal. While users with PayPal accounts can use log-in if they wish, no PayPal account is needed to complete the subscription to MFO Premium.

Below is a screenshot of payment options for guest users of PayPal. The online method is the most seamless option to track and update your subscriptions, summarized on the MFO Premium Account page. All that said, as always, if you experience any issues or have recommendations for improvement, please email me… will respond soonest!


RiverPark Strategic Income Fund (RSIVX)

By David Snowball

Objective and strategy

The fund is seeking high current income and capital appreciation consistent with the preservation of capital. The managers invest in “money good” securities; that is, in securities where the underlying strength of the issuer is great enough that “the risk of loss of principal due to permanent impairment is minimal.” It can invest in both investment grade and non-investment grade securities depending on market conditions and opportunities. They can also invest in non-US debt and in equities. The manager does not seek the highest available return; he will not “reach for returns” at the risk of loss of capital.

Adviser

Cohanzick Management will succeed RiverPark Advisors, LLC as the fund’s adviser, likely in late April 2023. RiverPark was formed in 2009 by former executives of Baron Asset Management. They advise, directly or through the selection of sub-advisers, the six RiverPark funds. Cohanzick Management, LLC was established in August 1996 by David Sherman and focuses on high yield, investment grade, and opportunistic corporate credit, as well as event-driven and value equities. Mr. Sherman founded the CrossingBridge affiliate in 2016. The firm advises the four CrossingBridge funds, with RSIVX slated to become their fifth. As of 2/28/23, assets under management for Cohanzick and affiliates were in excess of $2.5 billion.

Manager

David K. Sherman.

Mr. Sherman is the Founder, President, and Senior Portfolio Manager of Cohanzick Management, LLC. Mr. Sherman has 30+ years of investment management experience. Prior to establishing Cohanzick, Mr. Sherman was actively involved as a senior executive in Leucadia National Corporation’s corporate investments and acquisitions and was Treasurer of the holding company’s insurance operations. Mr. Sherman holds a B.S. from Washington University. He reports “an odd affection” for the Philadelphia Eagles. (More properly known as “the Iggles.”)

Strategy capacity and closure

The strategy has a capacity of about $2 billion, but its execution requires that the fund remain “nimble and small.” As a result, management will consider asset levels and fund flows carefully as they move in the vicinity of their cap.

Management’s stake in the fund

Mr. Sherman has invested between $10,000 – $50,000 in the fund, but he’s also the principal owner of Cohanzick and has invested over $100,000 in his other RiverPark charge, Short Term High Yield (RPHYX / RPHIX).

Opening date

October 1, 2013

Minimum investment

$1,000 minimum initial investment for retail shares.

Expense ratio

1.34% for Investor shares, on assets of $243 million (as of March 2023). The Institutional shares charge 1.09%, and the strategy overall, including accounts separate from the fund, holds $596 million.

Comments

RiverPark Strategic Income has a simple philosophy, an understandable strategy, and a hard-to-explain portfolio. And it meets a need. The combination is pretty compelling.

The philosophy: don’t get greedy. After a quarter century of researching and investing in distressed, high-yield, and special situations fixed income securities, Mr. Sherman has concluded that he can either aspire to make 7% with minimal risk of permanent loss, or he could shoot for substantially higher returns at the risk of losing your money. He has consistently and adamantly chosen the former.

The strategy: invest in “money good” fixed-income securities. “Money good” securities are where the manager is very sure (very, very sure) that he’s going to get 100% of his principal and interest back, no matter what happens. That means 100% if the market tanks. And it means a bit more than 100% if the issuer goes bankrupt since he’ll invest in companies whose assets are sufficient that, even in bankruptcy, creditors will eventually receive their principal plus their interest, plus their interest on their interest.

Such securities take a fair amount of time to ferret out and might occur in relatively limited quantities so that some of the biggest funds simply cannot pursue them. But, once found, they generate an annuity-like stream of income for the fund regardless of market conditions.

The portfolio: in general, the fund is apt to dwell somewhere near the border of short- and intermediate-term bonds. When other investors flock toward short-term bonds, they might find greater value in slightly longer durations. That was the case in 2013 when Mr. Sherman found greater value in 3- to 5-year issues. In general, though, the portfolio has a short duration which reflects his insistence on money-good investments.

The manager has a great deal of flexibility in investing the fund’s assets and often finds “orphaned” issues or other special situations which are difficult to classify. In general, there are six broad categories that capture the fund’s investments. They are:

  1. Short Term High Yield overlap – securities that are also holdings in the ultra-conservative RiverPark Short Term High Yield Fund. That stock of “dry powder” sits at around 30% of the portfolio.
  2. Buy and hold – securities that hold limited credit risk, provide above-market yields, and might reasonably be held to redemption.
  3. Priority-based – securities from issuers who are in distress but which would be paid off in full even if the issue were to go bankrupt. Most investors would instinctively avoid such issues, but Mr. Sherman argues that they’re often priced at a discount and are sufficiently senior in the capital structure that they’re safe so long as an investor is willing to wait out the bankruptcy process in exchange for receiving full recompense. An investor can, he says, “get paid a lot of money for your willingness to go through the process.” Cohanzick calls these investments “above-the-fray securities of dented credits.”
  4. Off the beaten path – securities that are not widely followed and/or are less liquid. These might well be issues too small or too inconvenient for a manager responsible for billions or tens of billions of assets but attractive to a smaller fund.
  5. Rate expectations – securities that present opportunities because of rising or falling interest rates. This category would include traditional floating rate securities and opportunities that present themselves because of a difference between a security’s yield to maturity and yield to worst.
  6. Other – which is all of the … other stuff. Leveraged loans, highlighted in his March 2023 investor call, might represent this group.

The need

Over the past 40 years, a vanilla “core bond” portfolio generated 6.1% annually and a standard deviation of 4.8%. In the same period, inflation was a meek 2.8%. As a result, you could pretty much bet the farm on inflation-topping gains. Interest rates were dropping steadily and almost relentlessly from their highs around 1980. Inflation was tame and occasionally negative.

Those days are gone. While nostalgia is understandable, it’s a poor basis for portfolio construction. Over the past decade, as markets became turbulent, the hundreds of funds in Morningstar’s “core bond” category returned only 1.2% annually. In 2022, they lost 13.3%. With a Fed mantra of “higher for longer,” asset allocators such as GMO and Research Associates project real returns well under 2% over the remainder of this decade. That’s a problem.

Fortunately, RiverPark does not rely on the health of the investment-grade bond market for its returns.

Risk characteristics since April 2014 (a near-inception date)

Correlation to bonds Downside capture Correlation to SP500 Downside capture Sharpe ratio RSIIX Bond market Sharpe High yield Sharpe
0.02 4.9% 0.30 14% 0.51 0.12 0.33

The low correlation tells you that returns are not being driven by the same forces that drive the investment-grade bond universe (which is a good thing) or the stock universe. The fund is making its money issue by issue, driven by the manager’s ability to identify and acquire mispriced securities and hold them to maturity. His skill at doing so is reflected in a Sharpe ratio – a measure of risk-adjusted returns -that’s more than four times higher than the broad bond market’s and more than 50% higher than the high yield market’s.

Morningstar recognizes Strategic Income as a five-star fund. Many funds use the name “strategic income” to signal their independence and flexibility, which led us to benchmark RSIIX against them. Over the three dozen Strategic Income funds with a nine-year record, RiverPark finishes in the top five for top returns and risk-adjusted returns.

Bottom Line

In all honesty, about 80% of all mutual funds could shut their doors today and not be missed. They thrive by never being bad enough to dump nominally active funds, whose strategy and portfolio are barely distinguishable from an index. The mission of the Observer is to help identify the small, thoughtful, disciplined, active funds whose existence actually matters.

David Sherman runs a half dozen such funds. His strategies are labor-intensive, consistent, thoughtful, disciplined, and profitable. He has a clear commitment to performance over asset gathering and to caution over impulse. His view of the immediate future is balanced.

Although the market is not necessarily cheap, it is also not expensive. Opportunities will arise from uncertainty, volatility, the flow of funds, and a “day of reckoning” among borrowers. We continue to subscribe to many of the themes we have communicated over the past year. We are optimistic with respect to future absolute performance. That said, we have our work cut out for us in 2023.

Folks navigating the question “what makes sense in fixed-income investing these days?” owe it to themselves to learn more about RSIVX.

Fund website

RiverPark Strategic Income Fund

Disclosure

While the Observer has neither a stake in nor a business relationship with either RiverPark or Cohanzick, both individual members of the Observer staff and the Observer collectively have invested in RPHYX and/or RSIVX.

The Tide Is Going Out

By David Snowball

“It’s like the tide going out; you’re starting to see all the things that have been waiting to happen,” David Sherman of Cohanzick Management, 15 March 2023 web call summary.

David Sherman is one of the industry’s most consistently successful fixed-income investors. He founded Cohanzick Management on the premise “return of capital is more important than return on capital.” His specialty is the pursuit of distinctive, low-risk diversifying strategies for fixed-income investors. “We try to focus on what we know and what we do well. We do not pursue investment ideas or strategies that are outside of our core competency.”

Cohanzick and their CrossingBridge affiliate advise six funds, including one ETF. All four CrossingBridge funds managed positive returns in 2022, as did RiverPark Short-Term High Yield, which is an ultra-low volatility cash alternative fund. RiverPark Strategic Income, which will soon become CrossingBridge Strategic Income, lost just over 3%, which placed it in the top 6% of its Morningstar peer group. Cohanzick also manages a small number of separately managed accounts and private investment vehicles.

  Rating and group 2022 return 3-year return 3-year peer rank
CrossingBridge Low Duration High Yield (CBLDX) Five-star, Multisector bond 1.01 6.3% Top 8%
CrossingBridge Ultra Short Duration (CBUDX) Ultra-short bond 2.45 n/a n/a
CrossingBridge Responsible Credit Fund (CBRDX) Multisector bond 1.81 n/a n/a
CrossingBridge Pre Merger SPAC ETF (SPC) Small cap growth 2.02 n/a n/a
RiverPark Short Term High Yield (RPHIX) Four-star, High yield 2.96 3.0% Bottom 5%
RiverPark Strategic Income (RSIVX) Five-star, High yield -3.30 9.3% Top 3%
Morningstar core bond category   -13.11 -2.79%  
Morningstar high yield bond category   -10.09 5.6%  
Morningstar multisector bond category   -9.85 3.3%  

In the second week of March 2023, the banking industry suffered a series of serious shocks. Those raised questions among investors on the stability of the US financial system. Those concerns were reflected in mass withdrawals of cash (about $250 billion in two weeks) from regional banks. Schwab got slammed by the panic over those banks, with its stock price dropping 37% in a month. A widely cited study (Jiang, et al, March 2023) raised the prospect that 186 other banks were vulnerable to bank runs similar to SVB’s. And the Fed extended its Bank Term Funding program to backstop the sector’s liquidity.

On rather short notice, Cohanzick invited people to listen to David Sherman talk about the significance of “recent developments.” Reportedly, 90 people called in. No slides, just David at his desk talking through two topics and fielding questions. CrossingBridge has shared the complete video. For readers who are either a bit impatient or a bit ADHD, our summary follows. Please note that we have tried to reproduce Mr. Sherman’s words as precisely as possible. That said, there may be some slips in our work. We will update it if we identify any misrepresentations.

Highlights:

  1. None of his funds have exposure to banks or thrifts. Exposure to banks would double his exposure to certain types of risk (interest rate, capital market access) and layer on new sources of risk (leverage and asset mismatch) that he would prefer to avoid. Early in his career at Leucadia, he was taught that “we should avoid exposure to financial companies because they take spread risk, which is effectively what all of us do here. When we invest in fixed income, they take interest rate risk, which is effectively everything we do in fixed income. They’re levered, which we are not. They need access to the capital markets, which everybody here does. And … they borrow short with depositors and lend long, which is an inherent mismatch of assets versus liabilities.”

  2. In a “moral hazard” sort of way, institutions worldwide have “adopted an umbrella policy: avoid any failure at all cost.”

  3. Sherman’s policy preference would be a 1-2 bps/year charge for insurance on accounts over $250k with an opt-out provision and some sort of preferential payments scheme (akin, I think, to what happens in a bankruptcy liquidation) to avoid runs on the bank.

    Nota bene: some members of MFO’s discussion board had a lively exchange about the topic. A lot of research points to the moral hazard risks of deposit insurance (DI). That is, the more deposit insurance a government provides, the more irresponsible the bankers behave. The seminal research (Barth et al., “Bank regulation and supervision: what works best?” Journal of Financial Intermediation, April 2004, a draft of which is easily accessible) has been cited nearly 3500 times and concludes that DI has a downside. The World Bank (2018) seems to agree: DI “comes with an unintended consequence of encouraging banks to take on excessive risk.” The subject is complex.

  4. He believes interest rates will remain higher for longer than commonly expected unless the fed has to accommodate a systemic risk. A Fed “pivot” now would be “a bad sign regarding speculation and future inflation.”

    Nota bene: many now speculate that the SVB shock did the Fed’s work for them by inducing precisely the sort of credit slowdown that they were trying to trigger. Which that effect endures, or is substantial enough, remains to be seen.

  5. The commercial real estate market, which is reliant on floating rate securities, is a major and generally unrecognized risk. High quality lenders like BlackRock “are handing the keys back to the bank.” Eventually, the government will need to pursue a solution like the Resolution Trust (1989-1995) to work to resolve the savings & loan crisis.

  6. Q: Is the banking system close to a meltdown?

    A: no. With the exception of a few incidents involving insolvent micro banks, there are no “FDIC-regulated banks where uninsured depositors didn’t get their money back.”

  7. Q: Are you positive on high yield this year?

    A: we don’t speculate, but “in general, actively managed high yield will outperform the stock market over the next couple of years.”

  8. Q: Has the risk-return equation become more compelling? Are you playing offense or defense now?

    A: “I love this question. Compliance hates it. We love markets like this, even if they’re frustrating, difficult, or stressful, because they create volatility, and volatility creates opportunity … it’s like the tide going out, and you’re starting to see all the things happen that have been waiting to happen among corporate credits. You’re seeing profit margins of some businesses being challenged, and you’re seeing a decline in revenue, you’re seeing pricing differences, you’re seeing people having different views on what will happen on interest rates, you’re seeing people being forced sellers to raise liquidity because people had bad years last year. And those have all been developing, which has allowed us to be more offensive over the last several months.

    “Although our dry powder remains quite high across all of our strategies and hasn’t really been diminished, the money that we’re putting to work is at substantially higher returns, and I think much better returns relative to the risk. And the dry power is really a view that we think they’re going to be more of those opportunities.”

    Nota bene: “dry powder” refers to a fund’s cash-like holdings. At the end of 2022, Mr. Sherman’s RiverPark funds were 30% and 70% dry powder. In the context of this discussion, he seems to believe that a problem in the commercial real estate market is “going to rear its ugly head,” and that will create a new wave of investment opportunities for folks expert at distressed debt.

  9. Q: Where do you get such great ideas?

    A: I swiped one from a student in my Global Value Investing class at NYU. (Roughly.)

  10. Q: Has the opportunity set changed since the beginning of 2023?

    Mr. Sherman’s answer seems to come in two parts. First, we’re being really, really risk-conscious just now. “So, look, I think we focus on the business model, and the group tries to be disciplined in our credit work in all periods. Everybody, whether they want to admit it or not, occasionally gets out of their lane, including us. I think it’s disingenuous to say you never do. If it was true that everyone could stay in their lane, you wouldn’t have people that dieted, strayed, and then got heavy again. But the answer is we’ve been, for quite some time, focusing on staying at the highest level of the capital structure and the highest quality.”

    Second, yes, leveraged loans look to offer some new and interesting possibilities. Mr. Sherman notes that leveraged loans are “being priced off a forward curve, and the forward curve was predicting rates to go down over time. And every day that rates stayed higher for longer, you made a higher return than the year yield was being projected on a forward curve … there has been a lot of technical pressure in the loan market for two reasons. One, a lot flowed into funds because people wanted to own a floating piece of paper as rates went up. And now, it’s flowing out because people are waiting for the pivot. But two, there’d been a lot of CLO issuance. A lot of that CLO issuance is in its harvest period now, meaning they can’t reinvest … we saw an opportunity based on that set. We see an opportunity today. Even if the Fed were to pivot, we think there’s a lot of opportunity there. Our funds and our strategies are at some of the highest levels of leverage loan ownership that it’s been for years because of those dynamics. You’re at a point now where leverage loans that are pari passu with the issuers’ bonds are trading at a significantly higher return than the bonds themselves with shorter duration.”

Bottom line

It appears that two elements common to a “strategic income” portfolio are presenting unusually attractive opportunities. High yield bonds are priced to outperform stocks for the next couple of years. The leveraged loan market is under pressure which allows investors to buy higher yields with shorter durations than companies can offer in their bonds. Finally, dislocations in the commercial real estate market might present serious opportunities in the months to come, justifying a high level of “dry powder” in an investor’s portfolio just now.

Seafarer Overseas Value Fund (SFVLX), April 2023

By David Snowball

“We are living through investment regime change”

Objective and strategy

Seafarer Overseas Value pursues long-term capital appreciation. The fund typically invests in common stocks, though the managers have the ability to add both preferred stocks and fixed-income securities. The investable universe includes both emerging markets, as traditionally conceived, and companies domiciled in selected foreign developed nations (including Australia, Hong Kong, Ireland, Israel, Japan, New Zealand, Singapore, and the United Kingdom) when those companies have “significant economic and financial linkages to developing countries.”

The portfolio is built through bottom-up security selection based on fundamental research. The managers are looking for “securities priced at a discount to their intrinsic value.”

Adviser

Seafarer Capital Partners is an investment adviser focused on emerging markets. Founded in 2011, Seafarer is a wholly employee-owned firm located in the San Francisco Bay. Both of their strategies aim to provide long-term investment portfolios that offer sustainable growth, reasonable income, suitable diversification, and volatility mitigation. The firm’s goal is to build lasting wealth for clients over time. Seafarer specializes in co-mingled, long-only emerging markets funds. The firm serves as the investment adviser to the Seafarer Overseas Growth and Income Fund and the Seafarer Overseas Value Fund. Morningstar estimates that the firm has a bit over $2 billion in AUM with a quarter billion in inflows over the preceding 12 months (from 3/20/23).

Managers

Paul Espinosa, Brent Clayton, and Andrew Foster.

Mr. Espinosa is the Lead Portfolio Manager of the fund and has been so since its inception, which means he has primary responsibility for the day-to-day management of the fund’s portfolio. Before joining Seafarer in 2014, Mr. Espinosa was an equity research analyst at Legg Mason, where he focused on global emerging markets. That was preceded by stints at Citigroup Asset Management and J.P. Morgan.

Mr. Clayton became co-manager in February 2023 though he has been with Seafarer since 2018. Before that, he was Co-Portfolio Manager, Head of Fundamental Research, and Equity Analyst at LR Global Partners, an investment firm focused on value-based investing in frontier and emerging markets.

Mr. Foster is one of Seafarer’s founders, its CIO, and a Lead Portfolio Manager of the Seafarer Overseas Growth and Income Fund. Before founding Seafarer Capital Partners in 2011, Mr. Foster was a Lead Portfolio Manager, Acting Chief Investment Officer, Director of Research at Matthews International Capital Management, and adviser to the Matthews Asia funds.

The Seafarer team is admirably and exclusively focused on their funds. While managers at many other advisers split their time between a half dozen funds, a couple of hedge funds, and a bunch of separate accounts, the Seafarer Funds managers focused on … well, the Seafarer Funds.

  Other funds managed Other pooled vehicles managed Other accounts managed
Andrew Foster 0 0 0
Paul Espinosa 0 0 0
Lydia So 0 0 0
Kate Jaquet 0 0 0

Source: Statement of Additional Information (2022)

Strategy capacity and closure

Seafarer has both a commitment to and tradition of closing their funds when it is in their current shareholders’ best interest to do so. We do not have a formal calculation of the strategy’s capacity, but the combination of a concentrated portfolio (around 40 names) and substantial small cap exposure (currently 10 stocks with market caps below $1 billion) implies a cap in the lower billions.

Management’s stake in the fund

Ms. Espinosa has invested between $100,000 and $500,000 in his fund. Co-manager Andrew Foster has invested over $1 million, and Mr. Clayton, who recently moved from analyst to co-manager, has invested between $10,000 – $50,000 in the fund.

A note on vigilance: having skin in the game generally leads managers to be rather more risk conscious than others. (Ma & Tang, “Portfolio manager ownership and mutual fund risk taking,” 2018) Having your boss’s skin in the game ramps that up by an amount surpassed only by having your in-laws’ skin in the game.

Opening date

May 31, 2016

Minimum investment

The minimum for Investor shares is $2,500, and for Institutional shares, $25,000. The Investor minimum is reduced for both retirement accounts and accounts set up with an automatic investing plan.

Expense ratio

The Investor shares carry a net e.r., after waivers, of 1.15% on assets of $85 million dollars, as of July 2023. Institutional shares charge 1.05%, net.

Comments

Close your eyes and imagine seeing “an emerging markets city.” What do you see? The crowded streets of Mumbai? An open-air spice market in Istanbul? A shining sea of skyscrapers ringed by tin-roofed huts?

Do the same exercise with professional investors and, instead of cityscapes, there’s a tumult of concepts: obscure and unreliable accounting, opaque corporate structures, arcane market rules, wild currency fluctuation, endless government meddling … an unmanageable swamp.

Conclude the exercise with Paul Espinosa, and an entirely different picture appears:

He sees some of the best management teams in the world whose members have graduated from some of the world’s best universities and who have been tested in some incredibly challenging markets. These teams, he suggests, “by virtue of their cosmopolitan domicile, tend to have a mixture of domestic and international management, and at the risk of overgeneralizing, a degree of professionalism that one does not always find elsewhere.”

He sees some of the best-run, most competitive corporations which are steadily earning market share in the US and Europe by out-competing their domestic competitors. Samsung might be one example, and China’s WH Group, owner of Smithfield in the US, might be another, but Mr. Espinosa thinks the clearest is Ambev.

Ambev was formed in 1998 through the merger of two Brazilian brewers: Brahma and Atarctica. The management team that oversaw that corporate marriage was the one that developed the now famous “zero-budgeting” process employed by 3G Capital and Warren Buffet to manage the Kraft-Heinz merger. The serial acquisitions to build the Ambev empire in the Americas culminated with the merger with Interbrew (Belgium-based) and subsequent merger with Anheuser Busch (US-based). The dominant shareholders of Anheuser-Busch InBev are the original Brazilian and Belgian families. The top management of ABI has also been Brazilian. At its heart, ABI is the manifestation of a Brazilian takeover of the global brewing industry.

He sees consistent mispricing driven by the location of corporate offices since many of the largest mutual funds are constrained from touching “the emerging markets.”

He sees consistent mispricing driven by the size of the corporations since huge and passive funds are constrained by liquidity screens from looking at smaller firms; in consequence, 201 of 224 emerging markets funds fall solidly in Morningstar’s “large cap” box.

He sees consistent mispricing driven by the fact that many rock-solid investments do not bear the traditional markers of “growth stocks,” the preferred style of most EM investors. Only 50 of the 224 emerging markets funds fall into the “value” realm.

He sees Anheuser Busch, “a global brewer that derives most of its revenue from emerging markets,” and the street of Brussels.

He sees problems investing in countries where politicians, rather than managers and boards, control the decisions that corporations make (Mr. Foster was once told that any significant layoffs at Sberbank would have to be reviewed by Mr. Putin himself), and so his exposure to China and Russia has been one-third of his peers. Morningstar celebrated Seafarer’s flagship as one of the few EM funds to miss the Russian collapse (Katharine Lynch, “Just 8% of Emerging-Markets Funds Miss Russian Collapse,” 3/9/2022).

And he sees those differences clearly enough that Overseas Value has an active share of 98. It was the best-performing diversified emerging markets fund of 2022, posting a loss of -0.7% against a peer average of -20.8%, and has earned both MFO’s Great Owl designation and Morningstar’s backward-looking Five-Star and forward-looking Silver recognitions.

MFO does not endorse using short term returns as a way to make investment decisions; that’s nothing but a recipe for heartache. Seafarer has a 6.8-year track record. Over the past five- and six-year periods, it has been a top-five diversified EM fund based on both total returns and risk-adjusted returns (reflected in its Sharpe ratio, as well as the more risk-sensitive Sortino and Martin ratios and Ulcer Index). Morningstar places its total returns over five years in the top 3% of its peer group (as of 3/28/2023).

The process: In broad terms, Mr. Espinosa works within a universe of approximately 450 EM value stocks whose net value is something like $1.5 trillion. His discipline is built around identifying the most compelling investments by assessing each corporation against a rubric that identifies seven potential sources of value.

He invests, generally for the long-term, in the 40 most compelling opportunities. Turnover tends to be in the teens, and he reports that the last time he removed a name from the portfolio was in the third quarter of 2021.

Bottom Line

Mr. Espinosa sees an epochal change in investment reality coming. The story for the past three decades has been the same: buy the US, buy large caps, buy growth, buy investment grade debt, buy indexes and you’re sure to win. His tone is less derisive than sorrowful:

The cost of preconceptions became apparent in 2022. In the United States, fixed income instruments generated returns as negative as those of equity securities. The returns of emerging market equity indexes were comparable to those of the S&P 500 in a down year. The traditional safety of the fixed income asset class was conspicuous by its absence, as was the beta historically associated with emerging market equities.

While investors could have anticipated both the risk associated with prospective bond returns when interest rates are pegged to the floor and the diminished risk associated with the lower valuations of emerging markets compared with U.S. equities, how many acted on said investment conditions? Arguably, a meaningful set of investors identified these insights last year, but few invested with anticipation, otherwise market returns would not have proven as costly.

It is indeed difficult for an investor to overcome the preconception that a balanced portfolio is safer than an equity-only one, or that emerging market equity indexes are more volatile than a U.S. market index.

Another preconception the future may challenge is the view that emerging market (EM) corporates are riskier than developed market ones, at least on a selective basis. Seafarer’s work over the years has revealed a growing list of EM companies that are managed just as well as leading global corporates and have expanded internationally, including into developed markets, mirroring the behavior of multinational corporations that expand into emerging markets. Moreover, many of these EM companies’ management teams are battle tested in navigating high inflation, volatile foreign exchange rates, and erratic economic growth – challenges that developed market management teams have faced less acutely, and few Chinese management teams have faced at all. I would argue that these select EM corporates redefine risk in a way that may transcend the traditional definition of risk in terms of countries. The traditional definition of risk may prove a handicap to generating investment returns in select EM corporates in the same way that preconceptions proved a handicap to investors in 2022.

We are living through an investment regime change, and I find the foregoing redefinition of risk a reason to be optimistic about the prospect for future investment returns even in a slower-growth world. That is, as long as the investor is selective and unencumbered by preconceptions.

Seafarer has a long history of dogged independence, of managing to preserve their investors’ wealth, and of producing reasonable returns in unreasonable markets. Seafarer Overseas Value Fund has embodied those family traits and has served its investors exceptionally well, even in markets that did not favor their style. As the world begins to grapple with the realities that Seafarer has already mastered, their prospects seem exceptionally bright. It surely deserves a place on any equity investor’s due-diligence list.

Fund website

The Seafarer Funds site is incredibly rich. It presents a wealth of historic fund composition and performance data that is largely unmatched for the investor. Seafarer Overseas Value Fund’s homepage is clean and readable. You can learn a lot there. I particularly like Paul’s habit of flagging the potential sources of value for each reported holding. An example from their January 2023 portfolio review illustrates the notion:

The Fund’s appreciation this quarter appears to relate to the combination of low valuations and improving profit prospects of the Fund’s holdings. China’s relaxation of its zero-Covid policies contributed to significant appreciation of several China-related holdings. Specifically, the share price of Melco International (Asset Productivity and Breakup Value source of value; the “source of value” for a Fund holding is hereafter referenced in parentheses), a casino owner and operator in Macau, rose 38.69% in U.S. dollar terms during the fourth quarter, on the expectation that the relaxation of travel restrictions in China would increase the number of visitors to Macau, which had fallen to an all-time low. The share prices of Shangri-La (Breakup Value and Asset Productivity), a hotel owner and operator, and DFI Retail (Management Change and Asset Productivity), a multi-format retailer operating in Asia, rose for the same reason.

Briefly Noted…

By TheShadow

Updates

Vanguard launched its Short-Term Tax-Exempt Bond ETF on March 9th. The ETF will optimize tax efficiency for investors seeking to allocate to the shorter end of the municipal bond market. It predominantly invests in short-term investment grade municipal bonds and will track the S&P 0-7 Year National AMT-Free Municipal Bond Index. It has an expense ratio of 0.07%, compared to 0.56% for the average short-term bond fund. Steve McFee, CFA, who has been at Vanguard for 18 years, is the portfolio manager of Vanguard Short-Term Tax-Exempt Bond ETF.

T. Rowe Price Hedged Equity Fund is in registration. The fund seeks to achieve its objective by investing in a broad portfolio of U.S. large-cap stocks while using hedging strategies designed to mitigate tail risk (i.e., the threat of significant losses during an equity market drawdown) and provide strong risk-adjusted returns with lower volatility than the overall equity markets. The fund seeks to cushion volatility during equity market downturns and incorporate modest leverage in a way that preserves returns that may be generated from stock selection while reducing the volatility inherent in investments in equity securities over time. The fund will be managed by Sean P. McWilliams. The total annual fund operating expenses after the fee waiver will be .90% for the investor share class.

The Riverpark/Next Century Growth Fund is in registration. It seeks to achieve its investment objective by investing in small-cap companies that the Fund’s sub-adviser, Next Century Growth Investors, LLC (“NCG”), believes will sustain above-average revenue and earnings growth over time or which are expected to develop rapid sales and earnings growth in the future when compared to the economy and stock market as a whole. The Sub-Adviser employs a “bottom-up” approach in its stock selection, which is the use of fundamental analysis to identify companies that it believes, over the long term, will surpass consensus earnings estimates. Total Annual Fund Operating Expenses After Fee Waiver and/or Expense Reimbursement will be 1.4% for the retail share class.

NCG has five portfolio managers dedicated to the Fund who operate as a team throughout all aspects of the investment process. Thomas L. Press, Chairman, Chief Executive Officer, Portfolio Manager, and Partner, has been with NCG since he founded it in November 1998. Robert E. Scott, President, Portfolio Manager, has been with NCG since 2000. Peter M. Capouch, Chief Operating Officer and Portfolio Manager, has been with NCG since 2003. Kaj Doerring, Portfolio Manager, Partner, has been with NCG since 2005. Tom Dignard, Portfolio Manager, Partner, has been with NCG since 2013.

T. Rowe Price has filed its registration filing for the Capital Appreciation Equity ETF. Total annual fund operating expenses are stated at 0.31%; it will be managed by David Giroux.

This will be in addition to T. Rowe Price’s several other ETFs: QM U.S. Bond ETF, Total Return ETF, Ultra Short-Term Bond ETF, Floating Rate ETF, U.S. High Yield ETF, Small-Mid Cap ETF, Value ETF,  Growth ETF, International Equity ETF, Equity Income ETF, U.S. Equity Research ETF, Blue Chip Growth ETF, and Dividend Growth ETF.

Small Wins for Investors

Janus Henderson Small Cap Value Fund is reopening to new investors, except class L shares, on or about April 17th.

T. Rowe Price’s New Horizon and Emerging Markets Stock Funds, rated four stars and two stars by Morningstar, respectively, are reopening to new investors who invest directly with T. Rowe Price effective April 26th. The New Horizon Fund has been closed since 2013; the Emerging Markets Stock Fund has been closed since 2018.

Closings (and related inconveniences)

Kopernik Global All-Cap Fund will close to new investors on June 1st. The fund reopened to new investors on January 3, 2023, after being closed since March 31, 2021.

Old Wine, New Bottles

Hartford Quality Value Fund will convert to an exchange traded fund on or before November 30, 2023.

AMG GW&K Small/Mid Cap Fund is changing its name to AMG GW&K Small/Mid Cap Core Fund.

Invesco International Equity is being reorganized into the Invesco EQV International Equity Fund. If the reorganization is approved at a shareholder meeting on or about July 12th, the reorganization is expected to be completed shortly thereafter.

Polen Global Emerging Markets Growth Fund changed its name to Polen Global Emerging Markets Growth Fund effective March 13th.

Leader High Quality Floating Rate Fund is changing its name to the Leader Capital High Quality Income Fund on or about May 16th. The fund will also be changing its investment policy on May 16th.

The dustbin of history

BNY Mellon Alternative Diversifier Strategies Fund will be liquidated on or about May 12th.

BNY Mellon Diversified Emerging Markets Fund will be liquidated on or about May 12th.

American Beacon AHL TargetRisk Core Fund will be liquidated on or about July 7th.

JOHCM Credit Income and the JOHCM Global Income Builder Funds will be liquidated on or about May 26th.

Clough Global Long/Short Fund will be liquidated on or about April 24th.