Monthly Archives: October 2019

October 1, 2019

By David Snowball

Dear friends,

We live, indeed, in interesting times.

You might think you hear in that statement an echo of “an ancient Chinese curse, ‘may you live in interesting time.’” Yes and no. I was thinking of the phrase but it’s not ancient. Also not Chinese. It appears to have been invented in 1936 by a member of the British foreign service who was trying to sound … uh, profound.

The sentiment remains, though the source is not exalted.

Turmoil, likely deepening, in Washington. Turmoil, likely coming to a head, in London. Turmoil, without a clear path out, with Beijing. Sunny days for the American consumer, dark ones for American industries. Economists place the odds of a recession in 2020 (or 2021) at 31-35%, or 40% or almost 50%, or 75%. Unless it’s all good. They’re economists. It’s always like that.

“John, do you think you could find me a one-armed economist?” plausibly attributed to Harry Truman, ca 1947.

The Financial Times asks whether we’re ready “for the Doomsday Dollar scenario” (9/29/2019) and the Wall Street Journal pipes in with the observation that the breadth of the stock market’s advances is collapsing (9/30/2019).

And no, I’m not forgetting young Greta Thunberg and her infamous glare. When it’s 87 and humid on the first of October, you’re experiencing another bout of river flooding, and the crops that should be ready for harvest aren’t close, it’s hard to set such concerns aside.

As scary as the news of the day might be, we do need to remember that long-term investments require a longer term perspective. In this issue of the Observer we try to balance those concerns. Charles Boccadoro and Lynn Bolin both present metric-centered pieces on dealing with the downside and positioning your portfolio for negative short-term events. (Spoiler alert: Lynn’s analysis points to impending recession and an allocation of just 20% to equities.)

As a sort of counterpoint to that essential concern with the here-and-now, I return to the task of thinking about compelling long-term opportunities with a profile of Crawford Dividend Opportunity (small cap + equity income = outstanding long-term performance) and Invenomic Fund (which now has most of its former Balter hosts onboard), a Launch Alert for Grandeur Peak’s long-planned Global Contrarian fund (read quickly, GP is really serious about their capacity constraints) and an updated report on emerging market value funds (Seafarer Overseas Value has been kicking … uh, up a fuss). We hope the balance helps.

Thanks, as ever …

It might well be irrational to celebrate having nine (9!) subscribers (in the sense of folks who’ve set up to make ongoing monthly contributions in support of the Observer), but we’re celebrating because that’s a new high and they’re cool people. So thanks, as ever, to the folks at S& F Investment Advisors, Greg, William, Doug, William, Brian, Seshadri, David, and our newest subscriber, Matthew. Thanks, too, to Michael from Ontario, New York for his support.

And to you all, for reading and reflecting with us. I’d be especially delighted to meet any of the folks who might be attending the annual AAII convention in Orlando in a few weeks. I’ll be there, speaking … well, at around the time most convention attendees will be boarding their flights home. Such is life. It will give us the opportunity to have a nice discussion with the folks who do attend. The theme of my presentation is how to be a long-term investors in a world filled with … well, sound and fury, signifying nothing.

In November, we’ll look a bit at Castle Focus (which has caught Ed’s attention) and North Star Dividend (which has caught mine); like Crawford Dividend it’s a small cap fund with a strong dividend focus which means it lives in both the conservative Equity Income and aggressive Small Cap camps. Perhaps a fund for our times? The pipeline will be filling for year-end fund and ETF launches.

Stay tuned!

david's signature

What You Don’t See ………

By Edward A. Studzinski

“A democracy is a government in the hands of men of low birth, no property, and vulgar employments.” Aristotle

Reformulation

One of the more interesting exercises in the consumer brands space in recent years has been the efforts of companies to update brands to be more suitable to contemporary tastes or standards. Some of these attempts, such as New Coke, have been monumental failures when the consuming public rejected them. Others have been successful when the changes have not been disclosed. They often reflect a combination of taking out costs and making a “healthier” product. I remember a dinner at one venue of a chain of seafood restaurants in the Boston area. After several bites of my dinner of fried clams it was obvious that the coating formula that the clams were dredged in had been changed. Also, what the clams were being fried in had also been changed. Upon inquiry, the waiter advised me that the changes had been made several months ago. I was the first person to have noticed and commented upon them.

Author Calvin Trillin once observed that restaurants with a cuisine not native to the area they are in are often doomed to fail because the customers don’t know what the food is really supposed to taste like. The standards are often compromised as the chef is forced to drift away from what he intended. The food often ends up being less than it could have or should have been.

Another example, and then I will move on. Some years back I was in a supermarket located  in that triangle area  of Massachusetts within spitting distance of New York and Connecticut. I was watching a direct store deliveryman for a potato chip company fill up his section of the salty snack aisle. (FYI – hands up those who think you can learn more about brands and what the competition is doing by talking to the direct store deliveryman or, instead of by sitting at the well-scrubbed set of presentations at a company’s analyst day).  The gentleman noticed that I was looking for something and asked if he could help. I mentioned a special brand of potato chip that his company made. I had purchased it when in the DC and Virginia areas. He said that was their best selling and best tasting potato chip – and the only one that they still cooked in lard. He told me that I wouldn’t find it in Massachusetts or Connecticut. This apparently was the dictate of the health police. I wonder what they would make of poutine sold everywhere in Quebec – but I digress.

The point of this – does reformulation take place in the mutual fund and money management business? I was recently speaking with a money-manager who mentioned to me that another investment acquaintance had been engaged in a project that involved a fundamental remake of a firm’s research database. All the algorithms and formulae had been updated and revised. Since this was a value-oriented firm, it begs the question as to why change the metrics and methodologies? Was there some new insight that had been discovered (and Bill Miller at Legg Mason was quite successful at finding and implementing tweaks that supported an evolving definition of value)? Or were the changes being made to provide cover to the marketers, who needed to rationalize to the investment gate keepers the justification for owning equities at valuation levels that seemed totally out of line with the firm’s historic disciplines. I don’t know the answer. But it poses an interesting question in terms of whether, when there is a significant investment methodology change, the same performance numbers and periods are appropriate.  To date, the changes do not appear to have especially improved composite performance. But performance may not be the issue when assets stay in house just a little bit longer, notwithstanding the attractiveness of lower fee passive investing.

Is updating the formulation and methodology of investing wrong? No, not when it is done on a transparent basis, with disclosure. There are reasons why a prospectus may be changed, stickered, and updated when changes are material to the investment process and the potential outcomes.

Investing with active managers often requires a sensitive olfactory instrument. For often as not, you must engage in a sniff test relative to what you see and what you are being told to arrive at some semblance of the truth, or at least what passes at the time for truth.

Getting What You Paid For: High capture ratio funds

By David Snowball

Investors are interested in returns: the answer to the question, “how much are you going to make me?” Sophisticated investors are interested in how those returns are delivered.

Over the current market cycle, Fidelity Blue Chip Growth (FBGRX) has returned 10.7%, among the best of all funds. AMG Yacktman Focus (YAFFX) trails it at 10.5% and costs a lot more to boot (1.27% versus 0.72%). On surface, that’s pretty clear: Fido offers better performance, lower costs.

But that masks some important differences. Fidelity posted a loss of -48.8% in 2009, Yacktman’s was -38.3%. Fidelity bounces a lot more, in general: it has a standard deviation of 17.3 against Yacktman’s 14.8. Standard deviation is a surrogate for “normal” bounciness: returns of 10.7% and a standard deviation of 17.3 translates to, “in two years out of three, you might expect your returns to be 10.7% plus or minus 17.3%.” So, somewhere between a 28% gain and a 7% loss. If you don’t find that range reassuring, you’re beginning to discover the allure of low volatility funds.

A huge variety of risk-return metrics exist to help us simplify the task of adjusting returns to account for the risks you might reasonably expect: Sharpe ratio (for which the originator received a Nobel Prize), Sortino ratio, Martin ratio, Ulcer index (which factors together how far a fund falls with how long it stays down to help you understand how much of an ulcer it might give you), information ratio and others.

From an average investor’s perspective, the problem with all of them is the same: it’s never easy to say what number is “good.” Is a Sharpe ratio of 2.44% good? What about a Martin ratio of 14.3 or an Ulcer index of 0.1?

And that’s where the capture ratio comes in. The capture ratio offers an unambiguous answer to the question, “is that good?” If the capture ratio is above 1, the answer is “yes.” The farther above 1, the stronger the “yes.”

Here’s our official explanation of it from the MFO Premium definitions page

Capture

Amount of positive or negative return a fund captures relative to various indexes, measured over evaluation period specified. Currently, we calculate performance against each of four indexes: the S&P 500, the Barclays US Aggregate total bond index, a US balanced 60/40 index and the MSCU All Countries except the US index.

Here are the specific Capture Metrics:

Upside Capture compares the positive return of a fund, comprised of positive month ending returns, to one of four indexes, over evaluation period specified. So, compared to SP500, an Upside Capture of 120% means the fund retuned or “captured” 20% more positive return than SP500 over the evaluation period specified.

Downside Capture compares the negative return of a fund, comprised of its negative month ending returns, to one of four indexes, over evaluation period specified, measured in percentage. So, compared to SP500, a Downside Capture of 80% means the fund retuned or “captured” only 80% of downside that the SP500 over the evaluation period specified.

Capture Ratio is simple the ratio of Upside To Downside Capture. Values greater than 1.0 means that a fund capture more upside than downside compared to its reference fund … a good thing!

To use the capture ratio, you need three things:

  1. comparable funds
  2. a relevant benchmark
  3. a meaningful time frame.

Let’s say you’re anxious about the likely performance of traditional 60/40 funds as the long joint bull markets for stocks (since 2009) and bonds (since 1982) near their end. Several market research groups, including Research Associates and GMO, estimate the returns of traditional 60/40 balanced over the next 5-10 years at, well, zero. One alternative to a 60/40 fund might be a long/short equity fund, many of which give you about a 60% net equity exposure. In theory, their short positions might generate some gains in volatile markets and give them a risk-return profile better than a traditional 60/40 fund’s.

You might then decide that you’d like to look at the performance of long/short equity funds, against the 60/40 index over the past 18 months because that’s been a period of substantial volatility. (And, too, being of modest means and interested in purchase, you’d want the funds to be open and available for under $10,000.) I used the fund/ETF screener at MFO Premium to find the long/short equity funds with the highest capture ratio relative to a 60/40 balanced index.

    APR Capture Up Cap Down Cap
MFS Managed Wealth MNWAX 5.6 2.91 40.3 13.9
James Alpha Managed Risk Domestic Equity JDAEX 7.2 1.64 62.3 38.0
Rational/NuWave Enhanced Market Opportunity NUXIX 19.8 1.33 190 142
Highland Long/Short Healthcare HHCZX 11.8 1.23 118 95.7
Longboard Alternative Growth LONAX 7.4 1.21 83.2 68.7
Anchor Tactical Equity Strategies ATESX 7.6 1.14 85.0 74.6
AMG River Road Long-Short ARLSX 6.3 1.12 71.8 63.9
Equinox Ampersand Strategy EEHAX 13.9 1.09 166 152
AGFiQ Hedged Dividend Income DIVA 3.8 1.04 47.0 45.2
RiverPark Long/Short Opportunity RLSFX 8.0 1.04 98.8 94.9
Alger Dynamic Opportunities SPEDX 9.3 1.03 116 112
Catalyst/Millburn Hedge Strategy MBXIX 5.7 1.00 74.2 73.9
Vanguard Balanced Index VBINX 7.3 0.97 99.4 103

The blue-banded funds are MFO Great Owl funds; they have achieved top 20% risk-adjusted returns in every trailing measurement period longer than one year.

Three things quickly stand out:

  1. some of these funds appear to be relatively volatile, despite short term success. NUXIX captures 190% of the upside and 142% of the downside of a simple 60/40 index. That’s probably a bad fit for someone seeking a conservative core investment. Alger and Highland, likewise, are a bit challenging.
  2. some of the funds are awfully sedate, producing bond-like returns. The AGFiQ ETF, for example, is capturing under half of the movement – and generating half of the returns – of the index. Those might be a bit mild.
  3. James Alpha appears to be the mildest mannered winner in the group: it about matches the 60/40 index while capturing just a third of its downside. RiverPark shows the best balance, substantially beating the group with only slightly less capture on both the upside and downside.

The capture ratio helps identify a bunch of funds worthy of further investigation: they outperform the traditional 60/40 crew with noticeably less downside risk. Since this screen was very short term, you’d want to explore the manager’s longer-term performance and philosophy.

A more straightforward experiment might be to find a new core fund: a domestic large cap fund that has a capture ratio higher than 1.0 against the S&P 500 over the entire market cycle, which is also open to retail investors. Here’s the top of the list:

    APR Max drawdown Capture Up capture Down capture
AMG Yacktman Focused YAFFX 10.5 -38.3 1.27 88.9 69.8
Monetta Core Growth MYIFX 10.9 -40.4 1.17 104 89.2
Pioneer Fundamental Growth PIGFX 9.7 -39.1 1.16 94.0 81.2
John Hancock US Global Leaders Growth USGLX 9.9 -42.0 1.14 98.6 86.8
AB Large Cap Growth APGAX 11.0 -42.8 1.13 111 97.7
Jensen Quality Growth JENSX 9.1 -41.1 1.13 91.8 81.2
Brown Advisory Growth Equity BIAGX 10.3 -46.4 1.12 105 93.9
Calvert Equity A CSIEX 9.5 -46.7 1.12 97.7 87.4
MFS Growth MFEGX 10.0 -46.4 1.11 105 95.0
Pioneer Fundamental Growth FUNCX 8.9 -39.8 1.11 92.0 82.8
Jensen Quality Growth JENRX 8.8 -41.3 1.11 90.9 81.7
Vanguard 500 Index VFINX 7.7 -51.0 1.0 100 100

The blue-banded funds are MFO Great Owl funds; they have achieved top 20% risk-adjusted returns in every trailing measurement period longer than one year.

What stands out? All of these funds have better risk-return profiles than the S&P 500, which is signaled by their capture ratios above 1.0. Look at the down capture column. None of the funds with great long-term success has a down capture over 100. For the most successful funds, the average downside capture is just 86% while the average upside capture is 98%.

Here’s the translation: the key to beating the market in the long term is not beating the market in the short-term. With an upside capture of 98, these funds are not outperforming the S&P 500 in the good times. Their long-term success is defined on the downside, where they captured just 86% of the S&P 500’s losses.

Bottom Line:  

Capture ratios have two distinct advantages. First, they’re very easy to understand. If you’ve picked a relevant index (the total bond index for core bond funds, for example) and your capture ratio is 1.0 or higher, you’re doing good. Pretty much anytime, anywhere, 1.0 and up is the goal. Second, they allow you to get past the simple question “did the fund make 10%” to the more useful question, “how did the fund make 10%?”

Folks with access to MFO Premium (we offer access as a thank-you for folks who make a tax-deductible contribution at least $100 to support MFO) can run endless permutations of this same search. For other folks, we’ll continue to highlight some of the highest capture ratio funds in the months ahead.

A More Robust Down-side Market Metric

By Charles Boccadoro

“A ‘receding sea’ is not a lucky offer of an extra piece of free beach, but the warning sign of an upcoming tsunami.” ― Jos Berkemeijer

Most of the metrics we’ve implemented at MFO address down-side risk. Our principal MFO Rating is based, not on Sharpe, but on Martin, which uses the so-called Ulcer Index to normalize any excess return. Ulcer Index …

(Peter Martin was recently mentioned in Brain Livingston’s article: “Widely followed risk-return measure for stock portfolios is debunked after 55 years.” It is not Martin Ratio.)

Martin is a risk adjusted return measure that answers the question: how much pain (drawdown) is involved with the return I receive? Ex post (after the fact), of course.

The introduction of our Bear Market Rating in the April 2015 commentary, entitled “Identifying Bear Market Resistant Funds During Good Times,” is an attempt to forecast (ex ante) how funds will behave when the market falls protractedly.

The Bear Rating represents a decile ranking (1 to 10 where 1 is most bear market resistant) of funds in a given category, based on bear market deviation (BMDEV). The deviation indicates typical percentage decline based only on a fund’s performance during bear market months, which Morningstar defines as a 3% drop for equity funds and a 1% drop for bond funds.

In addition to focusing on metrics that address down-side risk, our fund screeners have evolved in response to inputs from subscribers, like Brad Ferguson (Introducing Ferguson Metrics) and James Pursley of Gaia Capital Management (Introducing MFO Premium’s Fund Compare Tool).

Recently, Michael Sullivan of Chesney Sullivan Wealth Advisors (a Raymond James associate) based in Naples, FL queried us about the Bear Market Rating for a particular fund, which seemed inconsistent with other ratings, like those for drawdown itself (MAXDD) and Martin. He was examining a bond fund using an evaluation period of six years.

The US stock market has begun experiencing volatility this past year or so, reversing rather lengthy period of Historically Low Volatility. The S&P 500 retracted more than 3% three times this past year, on a month ending basis through August … -6.3% in May, -9.0% this past December, and -6.8% in October 2018. Fortunately for equity investors, the market recovered in subsequent months.

It is precisely such short-term retractions (aka “Bear Market Months”) that the Bear Market Rating methodology relies upon. But in the year leading up to last October, there was just a single such month … in three years before that, just two occurrences!

And the bond market? Since the “taper tantrum” in May of 2013, the US Bond (Bloomberg Barclays U.S. Aggregate Bond Total Return) Index has retracted more than 1% just three times … -1.2% in January of 2018, -2.4% in November 2016, and -1.1% in June 2015. That’s it! So, there has simply not been a lot to data to determine the Bear Market Rating on bond funds over the period Michael was evaluating.

To help address this issue, beginning with the month-ending September data, which Lipper (now Refinitiv) should drop this weekend, the MFO Premium site will incorporate a new Down Market Rating. Like its Bear Market Rating companion, it will attempt to gauge the pain investors may feel during a more protracted downturn by assessing the proceeding down only months, or pure downside risk. No threshold will be imposed.

While there have only been three bear market months for bond funds and eight for stock funds the past six years, there have been 27 months when the US Bond Index went negative and 18 such occurrences for the S&P 500, which should provide a more robust assessment of down-side risk.

Below please find a table of Down Market Rating for the all equity funds (except Trading) in the Lipper Global Data Feed, dating back to October 2002, the beginning of the previous bull market. The rating is assessed during the up cycle period preceding the 2008 bear market. Then, it shows the average maximum drawdown (MAXDD) for those same funds in the bear market. The result appears quite satisfactory.

A few other notes …

There were 16 down market months for the S&P 500 during the up cycle between October 2002 and October 2007. (There were 21 for the US Bond Index.) As always with our database, there is no accounting for survivorship bias.

The ratings above are also relative to all equity funds not category peers. We will start using the same approach for the Bear Market Rating. Ratings for these two metrics, like our overall MFO Risk metric, will be relative to the broader market not just category, which can give a false sense of security. While funds may appear tame in category (e.g., energy funds), they can still be quite volatile overall.

The average MAXDD for the equity funds above when both Bear and Down Market Ratings are 1 (20 funds) is just -32.3%.

We will also add number of bear and down market months of the MultiSearch results display, in addition to the ratings and attendant deviations. Finally, we will add a table to the MultiSearch Analytics tool showing the monthly fund total returns during all bear and down months since launch.

Sincere thanks to Michael Sullivan for reaching out!

Hoping this new metric and refined approach helps.

Sideways Markets

By Charles Lynn Bolin

Every strategy should be evaluated not just on a “benefit of being right”, but at least as importantly, on a “cost of being wrong”, basis…

The Little Book of Sideways Markets, Vitaliy N. Katsenelson

I just finished The Little Book of Sideways Markets (2010) by Vitaliy N. Katsenelson. Mr. Katsenelson is a value investor, an author and CEO of a small but classy Colorado investment advisor; he offers a singularly engaging personal bio on his well-read Contrarian Edge blog. His two books cover the same ground, but are written for different audiences: professional (Active Value Investing) and lay (The Little Book of Sideways Markets). His concern here is with markets that can go up and down for 10 or 20 years and end up near where they started. In this article, I look at investing in a turbulent market which I believe will occur over the next two years using “Sideways Markets” as a guideline.

Reducing the Noise

The sheer volume and velocity of noise generated by the market and amplified by media breaks down and fatally clogs our noise-filtering mechanism. We should proactively and methodically create a proactive environment where we limit (or block outright) the majority of outside noise that comes through, and only then should we start filtering.

– Vitaliy N. Katsenelson

The economy is slow moving and, barring a catastrophic event, does not turn on a dime. Yet I constantly see in the news shows or internet that some new piece of data is described as both very positive and negative for the economy. These do have an impact on our emotions. Chart #1 shows how data can be interpreted differently. Both lines show the National Home Price Index. The blue line is the index and it shows that housing prices are climbing. The red line is the same index shown as the rate of change from a year ago. Housing prices are climbing at slower rate, as they often do before a recession.

Chart #1: Investment Model Valuation Indicator

Source: S&P Dow Jones Indices LLC, S&P/Case-Shiller U.S. National Home Price Index, retrieved Fed Rsv Bank of St. Louis; https://fred.stlouisfed.org/series/CSUSHPISA

In my opinion, a recession is not imminent, but the odds are climbing. Chart #2 shows that Total Business Sales, Orders (durable goods), Investments (Capital goods orders), Shipments, and Construction Spending are starting to contract compared to a year ago. These indices have been declining since early 2017, although Sales and Shipments are now contracting at a slower rate.

Chart #2: Contracting Economic Indicators

Source: Retrieved from FRED, Federal Reserve Bank of St. Louis

Investment Model

With so much data to absorb, I built an Investment Model using data mostly from the St. Louis Federal Reserve (FRED) database. The Investment Model was created by downloading thousands of the economic data series on the St. Louis Federal Reserve and calculating the correlation to the S&P 500 six months into the future. The ideal data should be timely, start prior to 1995, and be available on a monthly basis. Other indicators were added such as corporate, gross domestic product, valuations, investment, household, and banking because they are good long leading indicators. With 34 main indicators, no indicator has more than a few percent weighting on the overall model.

Occasionally, I read about an indicator that someone relies on and test it in the investment model. This month I added a Shipping Indicator after reading “Cass Freight Index Down 9th Month ‘Signaling Economic Contraction’” by Mike “Mish” Shedlock. Mr. Shedlock wrote:

“We know that freight flows are a leading indicator, so by definition there is a lag between what they are predicting and when the outcome is reported. Nevertheless, we see a growing risk that GDP will go negative by year’s end.”

I composited the Cass Freight Index, Value of Manufacturers’ Shipments for Manufacturing, Rail Freight Carloads, and Value of Manufacturers’ Shipments for Heavy Duty Trucks into a Shipping Indicator. Chart #3 is the Shipping Indicator compared to the average of the Chauvet Recession Probability Model and the GDP Based Recession Indicator available on the FRED database. It has a 39% correlation to the recession indicator 4 months into the future.

Chart #3: Shipping Indicator

Source: Created by the Author based on data from the St. Louis Federal Reserve (FRED)

The Investment Model maximizes return of portfolios by changing allocations to stocks and bonds based on the economy, financial markets and risk. The chart below is a bit scary, both for its complexity and for its investment implications.

Chart #4: Investment Model

Source: Created by the Author based on data from the St. Louis Federal Reserve (FRED)

Remember that my model starts with a series of economic indicators, such as the freight index. The red line is a summary of the indicators used to create the Investment Model, in particular it shows the percent of those indicators that are negative. They’re getting more negative.

The shaded areas are where I estimate it is reasonable to be more aggressive (green) or defensive (red). The solid blue line the estimated allocation to stocks.

In theory, your equity allocation should correspond to the dashed blue line. In practice, it’s neither reasonable nor practicable for investors to jump from a 140% positive leverage to a 120% net short and so, following Benjamin Graham, I cap maximum equity exposure at 75% and minimum exposure at 20%. That’s represented by the solid blue line. As of October 2019, the model portfolio would move to its most conservative allocation of 20% in equities.

Which equities? Over the remainder of this essay, I’ll try to merge Mr. Katsenelson’s observations with current economic conditions and MFO data to suggest specific portfolio positioning.

Price to Earnings Ratio

In the late stage of a secular bull market P/E stops rising. Investors receive “only” a five percent return from earnings growth-and they are disappointed. The love affair with stocks is not over, but they start diversifying into other asset classes that recently provided better returns (real estate, bonds, commodities, gold, etc.). Suddenly, stocks are not rising 12 percent a year, not even 5 percent, but closer to zero-P/E decline is wiping out any benefits from earnings growth…

– Vitaliy N. Katsenelson

As long as investors believe that lowering interest rates and continuing quantitative easing improves stability, stock prices are likely to rise. When investors are inclined to risk aversion, lowering interest rates is unlikely to prevent the price to earnings ratio from contracting. Because the economy has been slowing for close to two years, real estate and utilities have had great returns and now have higher valuations. I have sold utility and real estate funds to lock in gains as the funds become more volatile. I am concentrated in bonds, and hold more gold than usual.

Dividend Yield

    • [Dividend] yield is a function of two factors: dividend payout and stock market valuations. Dividend payout is the percentage of earnings corporate boards decide to share with investors. During the last century dividend payout was about 60 percent of earnings; however, from the mid-1990s to the mid-2000s it declined to about 30 percent as managements favored stock buybacks over dividend payments…
    • Stock buybacks can create shareholder value if the stock is purchased cheaply, but they often destroy value when management overpays for the stock.
    • An even worse reason that management is prone to overpay for company stock is that their compensation is often linked to EPS growth. And they will often do anything to stimulate that growth, even if that means destroying shareholder wealth through stock buybacks.
    • Stock buybacks when the company stock is undervalued make sense.

– Vitaliy N. Katsenelson

Chart #5 shows that share buybacks are reduced during recessions. Companies tend to pay high prices during bull markets and reduce buybacks when stocks are cheap. This is a practice that will exacerbate price declines during a down turn, because lower dividends don’t provide as much protection during the downturn.

Chart #5: Dividends vs Stock Buybacks

Table #1 shows the average performance of 400 equity funds in existence during the 2007 Bear Market by Lipper Categories separated by dividend yield. General observations are that 1) the S&P 500 and Growth Funds performed worse regardless of dividend yield, 2) large cap value performed better but still lost an over 25%, 3) Equity Income (Dividend) lost roughly 20 to 25 percent during the recessions, and 4) that higher yielding equity funds are often riskier. If an investor believes that a recession may be coming in the next year or two then it may be time to shift allocations to Equity Income and Value Funds. Two examples of top ranked funds are American Century Equity Income (TWEIX) and AMG Yacktman Focused (YAFFX), both of which are Great Owls.

Table #1: Fund Performance during Bear Markets

Created by the Author Based on Mutual Fund Observer Data

As I near retirement, I reflect on the importance of income. I divide yields by the Ulcer Index to find the best risk adjusted income. My perception is that stock buybacks have lowered dividend payouts and the decrease in stock buybacks during recessions means that smaller dividends are less incentive to own dividend equity funds during a recession. Table #2 summarizes nearly 600 funds using MFO Multisearch for funds that existed prior to the 2007 Recession and yield more than 4%. The Yield to Ulcer Index ratio measures the risk that an investor is taking for that income. Keep in mind, that the yield on municipal bonds is tax exempt. In my opinion, building a defensive income portfolio should incorporate lower risk bond funds as a priority over equity funds.

Table #2: Yield vs Risk

Created by the Author Based on Mutual Fund Observer Data

Rolling 3 Minimum Year Minimum Return vs Recovery Time

Someone recently suggested looking at returns versus recovery times. I downloaded over 700 funds that existed prior to the 2007 recession and grouped them by Lipper Category as shown in Chart #6. The blue box is the categories that I want to concentrate in prior to a recession. They have short recovery times and mostly positive gains during its worst three year rolling average.

Chart #6: Minimum 3 year Rolling Return vs Recovery Time

Source: Created by the Author based on Mutual Fund Observer

Table #3 contains most of the categories with the shortest recovery times and highest minimum rolling three year return. The Bear Column is the average return for the 2000 and 2007 bear markets.

Table #3: Lipper Categories with Short Recovery Time and High Returns (Minimum 3 Year Rolling)
Source: Created by the Author based on Mutual Fund Observer
Lipper Category Ulcer MAXDD Recovery Months APR Min3-yr Roll Bear Yield
Alt Credit Focus 0 -0.9 9 0.6 6.7 3.3
Shrt-Intmd invst Grd Debt 0 -1.4 6 1.4 3.5 2.9
U.S. Treas Short 0 -1.5 6 0.2 8.0 2.5
Ultra-Short Obligations 0 -1.3 6 0.3 2.8 2.4
U.S. Gov Short 0 -1.5 8 0.2 4.6 2.0
U.S. Gov Short-Intmd 0 -1.8 13 0.2 6.5 2.0
Short invest Grade Debt 1 -2.6 10 0.6 4.9 2.6
Muni Short-Intmd Debt 1 -2.7 11 0.7 5.3 1.8
U.S. Mortgage 1 -4.3 14 0.5 5.7 2.6
Muni Intmd Debt 2 -5.2 13 1.3 5.6 2.5
Corporate Debt BBB-Rated 2 -7.2 9 1.2 4.1 2.9
Corporate Debt A Rated 2 -8.1 14 1.8 3.6 3.0
U.S. Gov Gen 1 -3.4 20 -0.1 8.2 1.8
Core Bond 2 -7.1 14 1.0 5.1 2.6
Core Plus Bond 2 -7.5 13 0.7 4.3 2.8
Muni Gen & Ins Debt 2 -8.0 17 1.7 4.1 3.0
Global Income 2 -8.8 17 1.7 3.8 1.8
Multi-Sector Income 2 -11.5 14 1.0 1.0 3.8
International Income 3 -10.2 30 -1.8 4.8 7.9
Mxd-Ast Trgt Today 3 -16.0 23 1.9 -6.2 2.2
Mxd-Ast Trgt Alloc Consv 4 -18.0 24 2.3 -6.1 2.4
EM Hard Crncy Debt 5 -22.8 14 -1.0 -2.4 5.0
Global High Yield 5 -26.0 14 0.9 -10.2 5.7
Mxd-Ast Target Alloc Mod 7 -28.1 32 0.2 -12.3 2.0
Large-Cap Value 7 -38.3 21 5.3 -8.7 1.5
Small-Cap Value 8 -32.5 26 -1.1 -2.0 1.2
Real Estate 8 -35.0 28 3.6 -27.6 4.3
Equity Income 10 -35.6 38 -2.8 -11.2 2.3

Sideways Markets

Historically, stock performance has been only slightly better and sometimes marginally worse than bonds [during sideways markets]. [During] the 1966-1982 sideways market, stocks barely outperformed long-term bonds and were beaten by Treasury bills. Depending on what interest rates and inflation do over the next decade, broad market indexes may or may not be a superior investment to bonds, as P/E expansion will not be a source of stock returns.

– Vitaliy N. Katsenelson

To Mr. Katsenelson’s point, the S&P500 has returned 2.9% annualized for the past 18 months as the P/E ratio has been gradually falling from 25.5 in January 2018 to just over 22 now, a drop of 13%.

Interest rates have been falling for the past year or so and bonds funds have done well. The European Central Bank has lowered interest rates and is continuing bond purchases (quantitative easing). The Federal Reserve has lowered interest rates twice and is likely to continue as long as the economy is showing signs of slowing. Interest rates affect the price of the dollar which affects exports. The Federal Reserve is likely to continue lowering interest rates and bonds are likely to do well over the next year or so.

Don’t own stocks just to be invested. In the absence of attractive equity investments-the right stocks-fixed –income instruments (or cash) are viable alternatives to an “average” stock.

– Vitaliy N. Katsenelson

We don’t know that the economy will slip into a recession, and markets typically do well during an election year. Retirement Income, Mixed-Asset Target Allocation Conservative and Moderate funds are great choices for an uncertain time where markets may have some life left, but the risk of recession is rising.

During secular bull markets selling is frowned upon as buy-and-hold turns into investing religion… Emotions assault us from different directions when we face a sell decision: If it is a losing investment, we want to wait until we break even… Or when it comes to selling a winner, we want to sell only at the top. Again, this is the wrong attitude…

– Vitaliy N. Katsenelson

Understanding Risk

What risk means to us is shaped by our time horizon. If you are investing for the long run-at least five years-a permanent loss of capital is the risk that you that you should be concerned with the most… If you have a short-term horizon, to you volatility is not temporary. Even a temporary stock decline results in a permanent loss of capital, since you don’t have the time to wait it out… There is another important, although less tangible, issue with volatility: It impacts our emotions and makes us do the wrong things-buy high and sell low. For a very rational computer-like decision maker this is not an issue.

– Vitaliy N. Katsenelson

My risk tolerance varies with the business cycle and with approaching retirement. The Mutual Fund Observer Portfolio tool quantifies the risk in my portfolios. I use a time period that starts close to January 2018, as investors began started rotating to late stage assets. Portfolio rates most of my portfolios as Conservative (2), and provides APR Rating, Ulcer Index, and Martin Ratio. It allows me to evaluate the funds within my portfolio and alternative funds. This is particularly important for employer sponsored plans with limited fund selections.

The investing environment is infested with randomness-it is a continual professional hazard. Our skill, knowledge, and experience should help to reduce the risk of randomness, but completely eradicating it is impossible, since randomness is the nature of the investing jungle. Stay within your circle of competence and do in-depth research to decrease the amount of randomness and its impact on your portfolio… Finally, to help protect yourself from randomness-diversify.

– Vitaliy N. Katsenelson

Ranking System

While the next quote is about stocks, it is equally applicable to funds:

    • Spend more time focusing on the process than on the end results… [Randomness] is as constantly present in investing as it is in gambling.
    • Stocks should be purchased when the risk/reward equation is tilted in your favor and sold when that stops being the case. Stocks that became fairly valued, the ones that have exhausted their margins of safety and in which expected total rate of return… now fall below your expectations should be sold-period.
    • Strict sell discipline will increase portfolio turnover and replacing stocks that are on the way out with new ones will become a priority.

– Vitaliy N. Katsenelson

The MFO ratings accurately describe funds with current and historical metrics. The 3 and 10 month trends are useful for estimating which funds are peaking or starting to accelerate. The price to earnings ratio is useful for estimating which funds may be overvalued and at risk of sharper declines. Leverage and bond quality provide insight into the performance during recessions. Building a ranking system is my way of speeding up the process of consistently identifying funds based on the criteria that I believe is important if we are headed toward a recession. I use Momentum (3 and 10 month trends, Returns), Quality (bond rating, low leverage, Fund Family Rating, Ferguson Metrics, composite ratings), Valuation (price to earnings ratio, price to cash flow, price to book), Risk (Ulcer Index, MFO Risk, capture metrics, debt to equity, performance during recessions), Risk Adjusted Returns (Martin Ratio, MFO Rank, Great Owl and Honor Roll Classification), and Income (Yield).

Table #4 contains the Lipper Categories that ranked highest over the past 18 months with some adjustments. The Bear column refers to the average performance during the 2000 and 2007 bear markets.

Table #4: Top Ranked Lipper Categories
Source: Created by the Author based on Mutual Fund Observer
Objective Ulcer Martin Yield RTN 3 Mos RTN 1 Yr Bear
Gen & Ins Muni (Unlvrgd) 0.4 18.3 3.3 3.7 11.2 2.3
International Income 0.8 57.6 5.0 2.4 8.2 4.8
Alt Credit Focus 0.1 23.2 4.0 2.5 6.6 6.7
Shrt-Intmdt Invst Grd Dbt 0.1 + 2.7 1.9 5.8 4.7
General U.S. Gov 0.2 17.4 2.3 2.6 7.4 8.7
Gen & Ins Muni Debt 0.4 15.0 3.1 3.1 9.4 2.4
Intermediate U.S. Gov 0.3 13.1 2.3 2.8 8.5 8.7
Global Real Estate 2.1 6.4 2.4 5.3 12.9 (22.8)
Short U.S. Gov 0.1 25.6 2.5 1.1 3.9 5.0
Utility 1.0 19.5 2.5 8.3 20.7 (22.9)
General U.S. Treasury 0.4 13.1 2.1 3.8 10.3 11.4
Short-Interm U.S. Gov 0.1 20.6 2.1 1.8 5.7 9.1
Interm Muni Debt 0.3 15.5 2.6 2.7 8.5 4.5
Ultra-Short Obligations 0.0 + 2.6 0.8 3.0 2.5
Core Bond 0.4 13.0 2.9 4.1 10.2 5.4
Short U.S. Treasury 0.1 18.0 2.3 1.1 3.9 7.8
Corp Debt A Rated 0.5 10.0 2.9 4.5 10.3 3.9
Corp Debt BBB-Rated 0.6 10.8 4.1 5.5 12.4 3.4
High Yield Muni Debt 0.7 12.9 4.5 4.0 10.4 (13.1)
Short Invest Grade Debt 0.0 + 2.6 1.2 4.3 2.8
U.S. Mortgage 0.3 27.0 4.0 2.3 7.5 6.6
General Bond 0.6 11.9 4.6 5.5 13.1 0.6
EM Local Currency Debt 1.0 6.7 4.7 4.3 15.1 +
Real Estate 1.7 9.2 4.9 6.2 13.1 +
Global Income 0.3 16.3 3.6 2.8 7.4 2.5
Multi-Sector Income 0.4 16.8 4.2 2.8 7.6 3.0
Short-Intmdt Muni Debt 0.2 31.4 2.1 1.8 5.8 4.1
Inflation Protected Bond 0.8 4.6 1.8 3.0 6.8 6.9
Gen&Ins Muni Dbt (Lvrgd) 0.6 12.8 4.2 3.9 11.4 0.4
Income 1.3 3.2 2.5 4.0 6.8 (7.1)
Equity Income 2.6 2.8 2.4 6.2 8.1 (13.9)
Growth & Income 1.7 3.2 2.2 4.4 6.6 (14.7)
Short Muni Debt 0.1 5.3 1.8 1.0 3.1 4.4
Flexible Income 1.7 2.7 5.0 3.7 7.2 (6.9)
Consumer Goods 3.0 2.8 2.1 9.1 12.0 (15.9)

Table #5 contains the top ranked funds in the top ranked Lipper Categories. The funds are a starting point for research and not a recommended list.

Table #5: Top Ranked Funds by Lipper Category
Source: Created by the Author based on Mutual Fund Observer
Objective Vanguard CEF ETF Other
 General & Insured Muni (Unlvrgd)   NXR    
 International Income VTABX   IAGG  
 Alternative Credit Focus       FPNIX
 Short-Intmdt Invest Grade Debt     VCSH SDMQX
 General U.S. Government     AGZ SNGVX
 General & Insured Municipal Debt VWAHX   FMB BATEX
 Intermediate U.S. Government VSIGX   VGIT USGNX
 GNMA VFIIX     SEGMX
 Global Real Estate       MGLIX
 Short U.S. Government VSGBX   FTSD PIASX
 Utility     VPU  
 General U.S. Treasury VFITX   ITE BTIAX
 Short-Intermediate U.S. Government     STOT  
 Intermediate Municipal Debt VWITX NIQ ITM BIAEX
 Ultra-Short Obligations VUSFX   GSY TRBUX
 Core Bond VBILX   FBND DODIX
 Short U.S. Treasury VFISX   SCHO GUSTX
 Corporate Debt A Rated       USAIX
 Corporate Debt BBB-Rated   BHK VCIT ISCFX
 High Yield Municipal Debt   CXE   ORNAX
 Short Investment Grade Debt VFSTX   SPSB LALDX
 U.S. Mortgage   BKT CMBS VSCFX
 General Bond   MCR BAB  
 Emerging Markets Local Crncy Debt VEMBX      
 Real Estate VGSLX RNP    
 Global Income     HOLD PRSNX
 Multi-Sector Income     BYLD IOFIX
 Short-Intmdt Municipal Debt VMLTX     OPITX
 Inflation Protected Bond VAIPX   SCHP SWRSX
 Gen & Ins Muni Debt (Leveraged)   NUV    
 Global VMNVX   ACWV MVGIX
 High Yield VWEHX   CJNK DHHIX
 Growth     SPLV MLVHX
 Alternative Global Macro     IYLD DVRIX
 Income VWINX   AOK DIFAX
 Equity Income     DJD PRBLX
 Growth & Income VGWAX   ONEV JRFOX

Table #6 contains my top ranked funds. I am biased toward Fidelity and Vanguard, but include other funds for interested readers.

Table #6: October Top Ranked Funds
Source: Created by the Author based on Mutual Fund Observer
Symbol Name Premium CAGR Ulcer Martin Yield 2007 Bear
OPITX Invesco Oppen Roch SDHY Muni   12.6 0.1 110.0 3.0 -6.9
VSCFX Voya Securitized Credit P   7.0 0.1 91.9 5.5
VTABX Vanguard Total Intern Bond   8.6 0.1 85.1 2.8
VCSH Vanguard Short-Term Corp Bond   5.1 0.0 62.5 2.8
LALDX Lord Abbett Short Dur Inc   4.1 0.1 35.6 3.8 2.0
BIAEX Brown Advisory Tax Ex Bond   6.8 0.2 28.2 3.1
GUGAX GMO Core Plus Bond III   9.5 0.3 21.4 4.2 -16.3
VSGBX Vanguard Short-Term Fed Inv   3.8 0.1 20.3 2.3 7.1
NXR Nuveen Select Tax-Free Inc -3.3 9.4 0.4 19.3 3.1 0.0
AGZ BlackRock iShares Agency Bond   5.9 0.2 15.8 2.4
BATEX BlackRock Alloc Target Shares   9.0 0.5 15.3 4.0
VFISX Vanguard Short-Term Treas   3.6 0.1 15.3 2.5 6.8
VGIT Vanguard Interm Treasury   7.2 0.3 14.9 2.2
BAB Invesco Taxable Muni Bond   11.4 0.7 13.6 3.8
DODIX Dodge & Cox Income   6.4 0.3 13.4 3.0 -0.3
VFITX Vanguard Interm Treasury   7.2 0.4 13.4 2.4 10.4
NUV Nuveen Muni Value -1.2 8.2 0.5 13.2 3.5 -5.4
USAIX USAA Income   7.5 0.5 10.8 3.2 -3.2
ISCFX Voya Investment Grade Credit SMA   9.7 0.7 10.3 3.9 0.3
JRFOX John Hancock Multi-Index Inc Prsv   5.7 0.4 9.8 2.5
VFIIX Vanguard GNMA Inv   5.4 0.3 9.6 2.9 7.4
BHK BlackRock Core Bond Trust -6.9 12.7 1.2 8.9 4.9 -11.9
SPLV Invesco S&P 500 Low Vol   16.5 1.8 7.8 2.0
PRSNX T Rowe Price Glbl Multi-Sctr Bond   6.9 0.7 7.0 3.5
VEMBX Vanguard EM Bond   9.1 1.0 6.7 4.7
VWINX Vanguard Wellesley Income Inv   8.2 1.0 6.3 2.9 -14.5
XMPT VanEck Vectors CEF Muni Inc   11.9 2.1 4.7 4.0
YAFFX AMG Yacktman Focused N   8.6 1.7 3.7 1.5 -30.4
LVHD Legg Mason Low Volatility High Div   9.6 2.1 3.5 3.7
TRECX T Rowe Price EM Corp Bond   6.2 1.2 3.5 4.7
VMNVX Vanguard Global Min Vol   10.8 2.5 3.5 2.1
TAIAX Amer Funds Tax-Adv Growth & Inc   5.5 1.5 2.3 2.5
IYLD BlckRck iShares MS Multi-Asset Inc   4.9 1.4 2.0 5.3

Closing

Following the process described in this article, I have been reducing risk in my portfolio for over a year. I am pleased with its low risk, high risk adjusted performance. I evaluate the economy each month to form an intermediate view of the economy and investment environment. I then evaluate which funds in my portfolio are “losing their margin of safety”. I limit changes to my portfolio to less than 2% of assets to avoid over-reacting and trading too often.

I appreciate the invaluable service that Mutual Fund Observer has contributed to developing a low risk, high risk adjusted portfolio. With the data from the St. Louis Federal Reserve FRED database and Mutual Fund Observer, the process takes about 2 hours per month. Researching funds and writing articles is the time consuming, but enjoyable hobby.

Emerging Market Value investing revisited

By David Snowball

About a year ago we identified emerging markets value funds as one of the market’s few bright spots, at least if valuations are important. (And they are.) Since we published that story, three things occur to us.

  1. Some emerging markets value funds have, indeed, done well.
  2. The long-term case for emerging market value remains strong.
  3. The options for prospective EM value investors have become clearer

Download a the .pdf version of this story.

The performance of EM value

There are about 40 EM value vehicles available for retail investors. Year-to-date performance ranges from 15.5% for Seafarer Overseas Value down to (1.4%) for Advisory Research Emerging Markets Opportunities (ADVMX, soon-to-be Vaughan Nelson EM Opportunities). As a group, the EM value funds and ETFs have returned about 5% YTD while EM funds overall have earned 7.8%.

The long term case for emerging market value remains strong.

Investors worry a lot about the threat posed to their portfolios by “bubbles.” The problem is that bubbles are hard to spot (everything’s a bubble when you’re panicky) and their resolution is hard to game (sometimes they simply sag, other times they persist for years). Rob Arnott and his colleagues at Research Affiliates argue that it might be more profitable to invest in “anti-bubbles.” At base, they argue that “bubbles” are marked by asset classes where every conceivable thing must go right simultaneously to justify investors’ current optimism toward them. “Anti-bubbles” are asset classes where every conceivable thing must go wrong simultaneously to justify investors’ current pessimism toward them.

American stocks, they argue, are in a bubble. Emerging markets stocks, and particularly smart beta value stocks, are in an anti-bubble. They believe that’s implausible in the short-term, and that that pessimism has driven EM valuations to historic lows.

The folks at Lazard illustrate the magnitude of the difference that investors are willing to pay for EM stocks versus stocks in the developed world or the S&P 500. At base, the discount now offered by EM stocks is far higher than it’s been in years.

Research Affiliates uses that valuation disconnect to help explain their conclusion that, over the next 10 years, EM stocks are apt to be the highest performing asset class.

GMO, whose asset class predictions tend to be pretty reliable over the long term (that is, like the rest of us they’re horrible at predicting next year but, unlike the rest of us, decent at predicting the next decade), contend that EM value stocks are the only asset class accessible to retail investors with even the prospect of double-digit returns.

The options for prospective EM value investors have become clearer

The table below represents all of the EM value funds and ETFs with a record of three or more years. While there is no formal EM value category in either Lipper or Morningstar, these funds are categorized as Emerging Markets Equities funds, and Morningstar assigns their portfolios to the “value” style box.

Using the performance of the MSCI Emerging Markets Value Index as a benchmark wherever possible, we highlight (in green) funds with superior three-year records. APR, or annual percentage return, shows the average annual returns for the funds for the three years ending 8/30/2019. Maximum drawdown and standard deviation give an indication of the funds’ riskiness. The remaining three columns offer risk-return balances.

For APR, standard deviation and Sharpe ratio, we highlighted funds that outperformed their benchmark index. For the other values, which aren’t available for the index, we highlighted the three or four top performers.

Emerging Markets Value funds, sorted by three-year Sharpe ratio

    APR MAX DD Std Dev Ulcer Index Sharpe Ratio Martin Ratio
Cambria Emerging Shareholder Yield ETF EYLD 9.5 -19.8 14.1 8.7 0.57 0.92
Seafarer Overseas Value SFVLX 6.9 -17.5 10.4 6.8 0.52 0.79
Schwab Fundamental Emerging Markets Large Company Index SFENX 7.7 -17.9 13.9 8.5 0.45 0.74
T Rowe Price Emerging Markets Discovery Stock PRIJX 7.8 -18 13.9 8.3 0.45 0.76
AllianzGI Emerging Markets Small-Cap ALMMX 6.5 -21.2 12.1 9 0.41 0.55
Invesco FTSE RAFI Emerging Markets ETF PXH 7.2 -17.4 14.6 9.0 0.39 0.63
American Beacon Acadian Emerging Markets Managed Volatility ACDPX 5.1 -13 10.3 5.6 0.35 0.64
BNY Mellon Strategic Beta Emerging Markets Equity I DOFIX 5.2 -18.7 13.7 9.5 0.27 0.39
MSCI Emerging Markets Value Index (USD)   4.31   13.4   0.26  
PIMCO RAE Emerging Markets PEAFX 5.2 -21.3 14.7 11.2 0.25 0.33
Segall Bryant & Hamill Emerging Markets A SBHEX 5.1 -24.5 14.1 12 0.25 0.3
Pzena Emerging Markets Value PZVEX 4.8 -19.4 13.3 9 0.25 0.36
Causeway Emerging Markets CEMVX 4.1 -24.3 14.6 12.8 0.18 0.21
Acadian Emerging Markets Portfolio AEMGX 4 -24.8 14.8 13 0.17 0.19
Brandes Emerging Markets Value BEMAX 3.6 -20.8 13.9 10.5 0.15 0.2
FlexShares Morningstar Emerging Markets Factor Tilt Index TLTE 3.4 -23.3 13.5 11.5 0.14 0.17
JPMorgan Emerging Economies JEEAX 3.4 -25.8 14.6 13.5 0.13 0.14
Mainstay MacKay Emerging Markets Equity MEOVX 3.4 -25.2 14.8 13.1 0.13 0.15
State Street Defensive Emerging Markets Equity SSEMX 2.7 -14.9 10 7.9 0.12 0.15
Wells Fargo Emerging Markets Equity Income EQIAX 2.9 -19.3 13.1 9.8 0.11 0.14
AB Emerging Markets Multi-Asset Portfolio ABAEX 2.6 -20 12.1 9.7 0.09 0.11
Cullen Emerging Markets High Dividend CEMDX 2.6 -22.4 12.8 10.9 0.08 0.1
Timothy Plan Emerging Markets TPEMX 2.6 -21.5 13.5 10.7 0.08 0.1
Lazard Emerging Markets Equity Portfolio LZOEX 2 -24.5 14.6 13.2 0.04 0.04
Invesco Low Volatility Emerging Markets LVLAX 0 -25.5 12.5 13.4 -0.12 -0.11
Advisory Research Emerging Markets Opportunities ADVMX -0.9 -24.8 11.5 13.2 -0.21 -0.18

The clear winner is Seafarer Overseas Value (SFVLX/SIVLX), which led its benchmark and peer group in every single measure of return, risk, and risk-adjusted return. The fund recently passed its third anniversary and earned a four-star rating from Morningstar and a Great Owl designation from MFO. The fund has also outperformed its famous larger sibling, Seafarer Overseas Growth and Income (SFGIX). Interested readers might want to review our Elevator Talk: Paul Espinosa, Seafarer Overseas Value to get a sense of his (and Seafarer’s) approach to the asset class.

The strongest raw returns were posted by Cambria Emerging Shareholder Yield ETF (EYLD), a $28 million passive ETF which invests in 100 companies with the best combined rank for dividend payments and net stock buybacks, with an additional screen for quality and diversification. It’s a five-star fund with a pretty broadly diversified portfolio, although one might want to approach “net stock buybacks” with some caution if you’re looking for a long term metric.

The Schwab Fundamental Emerging Markets Large Company Index Fund (SFENX) tracks a different sort of index. Rather than weighting stocks on their market capitalization, they weight them on company fundamentals: sales, cash flows and dividends + buybacks. That index was constructed by Research Affiliates, the group bullish on EM value to begin with. While not a “value” index per se,  the emphasis on real companies with real profits and real dividends biases the portfolio toward value stocks.

Finally, one new option is the LSV Emerging Markets Fund (LVAZX) which launched January 17, 2019. LSV famously attempts to exploit the psychological quirks of other investors, and its principals include several renowned economists who helped found the discipline of behavioral finance. LSV has managed this strategy for more than 10 years in a series of separate accounts and European investment vehicles. Over that decade, their separate account composite, net of fees, returned 7.1%, the MSCI EM index returned 5.8% and the MSCI EM Value index made 4.6%. The performance of LSV’s other funds has been inconsistent, but it bears watching.

Bottom Line:

It’s easy to allow our short-term travails –apocalyptic headlines abound – to blind us to long-term opportunities. Indeed, asset classes become long-term opportunities precisely because so many of us become anxious and blinded. While a conservative asset allocation might make all the sense in the world just now, considering EM value for a portion of your equity allocation might well be the most profitable path you’ve got.

Fortunately, in Seafarer and a small handful of others, you’ve got better choices than every before.

Crawford Small Cap Dividend Fund (CDOFX), October 2019

By David Snowball

Objective and strategy

Crawford Small Cap Dividend pursues attractive long-term total return with below-market risk. They pursue that goal by investing in a portfolio of small-cap US companies that demonstrate a consistent pattern of earnings and dividend growth. Their discipline is bottom-up, value-oriented and focused on company fundamentals. There are currently 72 stocks in the portfolio.

Adviser

Crawford Investment Counsel. Crawford is an investment management boutique headquartered in Atlanta, Georgia. The firm was found in 1980 and is owned by the Crawford family. John H. Crawford III, the firm’s founder, is their CEO and CIO. John H. Crawford IV joined him in 1990 and serves as director of equity investments. David Crawford joined the firm in 1992 and serves as its president.

They manage about $6.3 billion in assets (as of 30 June 2019) for institutions, private clients and their advisors. The firm is particularly proud of the high level of investor loyalty which, they believe, is driven by a combination of strong performance, good risk management and a high level of client service. They advise the three Crawford funds, including Crawford Dividend Growth and Crawford Multi-Asset Income.

Manager

John H. Crawford, IV and Boris Kuzmin. Mr. Crawford is Director of Equity Investments and one of the firm’s co-owners. He’s been with Crawford since 1990. Before that, John worked at Merrill Lynch Capital Markets. John received his BBA in Finance from The University of Georgia and his MS in Finance from Georgia State. He has earned the Chartered Financial Analyst designation, which is pretty major. I celebrate the fact that he’s Chair on the Board of Trustees for the University of Georgia Foundation; even in a thriving state like Georgia, higher education needs the help of all of the smart people it can muster.

Mr. Kuzmin is a Senior Research Analyst and Director of Small Cap Strategy. He’s been with the firm since 2004. Before that, he was an Equity Research Analyst at Emory Investment Management which is responsible for the endowments of Emory University, the Carter Center and Emory Healthcare. He earned his BS in Economics with Honors from the Russian Academy of Economics and his MBA from Emory. Like Mr. Crawford, he has earned the Chartered Financial Analyst designation.

They are supported by a team of six investment analysts.

Strategy capacity and closure

The strategy, including this fund and separate accounts managed using the same strategy, will continually evaluate capacity and may institute a soft close at $2.0 billion and around $2.5 billion, the managers would seriously consider a hard close. The fund has $220 million in assets and the separate accounts add about $30, which puts current assets in the strategy at around $250 million.

Management’s stake in the fund

Mr. Crawford has invested between $500,000 and $1 million in the fund. Mr. Kuzmin has invested between $10,000 – 50,000. As of December 30, 2018, none of the fund’s trustees had chosen to invest in it.

Active share

96.22. “Active share” measures the degree to which a fund’s portfolio differs from the holdings of its benchmark portfolio. High active share indicates management which is providing a portfolio that is substantially different from, and independent of, the index. An active share of zero indicates perfect overlap with the index, 100 indicates perfect independence. The “active share” research done by Martijn Cremers and Antti Petajisto finds that only 30% of U.S. fund assets are in funds that are reasonably independent of their benchmarks (80 or above) and only a tenth of assets go to highly active managers (90 or above).

CDOFX has an active share of 96, which reflects a very high degree of independence from its benchmark Russell 2000 Index.

Opening date

September 26, 2012

Minimum investment

$2,500 (as of July 2023)

Expense ratio

0.99% after waivers on assets of about $285.8 million (as of July 4, 2023).

Comments

Some funds simply demand attention. We run extensive data analyses each month, both for individual fund profiles and broader articles. I noticed that a surprising number of screens had Crawford Small Cap Dividend pop up. By way of example, Crawford popped up in a screen for our article on picking your first ESG / sustainable investing fund (Finding ESG Fund One, April 2019), in a list of high-performing funds with excellent sustainability scores despite not having a formal ESG mandate.

Likewise, as we were preparing our “Small Wins for Investors” (August 2019) feature, Crawford popped up for an expense ratio reduction and our quick capsule of the fund reminded us of their appeal:

Crawford Small Cap Dividend (CDOFX) is a five-star small-cap fund with below-average expense ratio. On September 1, the cap on their expenses fell another 6 points to 99 bps for the no-load shares. As with Cove Street, there’s a lot to like here: high sustainability score, very high active share, much higher-than-average quality portfolio for a small-cap fund, and admirably low-risk scores.

By Morningstar’s scoring, they are a five-star small-cap blend fund. By MFO’s, they are an equity-income Great Owl; that is, an equity-oriented fund that generates substantial income and that has risk-adjusted returns in the top 20% of its peer group for every period longer than 12 months. It’s particularly striking that Crawford excels in both its small-cap Morningstar category and its all-cap Lipper category.

That led us to promise, in September, a profile of the fund for October.

The managers of the Crawford Small Cap Dividend Fund build their portfolio around three principles:

  1. Find small-cap, blue-chip companies
  2. Buy them at an attractive price
  3. Hold them, generally for three or more years.

That first step represents the fund’s greatest distinction. When we think of small-cap companies, we tend to imagine relatively young, relatively untested businesses. While that’s a good general rule (manager John Crawford notes that a third of the companies in his benchmark index, the Russell 2000, are losing money), Crawford is looking for the exceptions to the rule. By way of illustration we can look at the history of the fund’s top three holdings:

  • Top holding Simulations-Plus was founded in 1996 and employs about 100 people but
  • #2 holding Mueller Water Products was founded in the 1850s; it makes the guts of things like fire hydrants and gas lines and employs 4,200 people.
  • #3 Avnet was founded on New York’s Radio Row in the 1920s; it’s an electronics and engineering firm that employs 15,000 people in 125 offices and has been repeatedly recognized as “a World’s Most Ethical Company by Ethisphere Institute.”

For them, small-cap, blue chips are firms that:

Have been paying, and preferably growing, dividends for at least three years;

Have stable earnings and strong free cash flow, which means they’re not dependent on external funding nor hostage to interest rate changes;

Have a history of allocating capital well; and,

Have market caps between $100 million and $5 billion; the portfolio has an average market cap of $3.1 billion

The firm believes that “quality and dividends are inexorably linked, and we look to a company’s dividend history as an initial indicator of quality.” Growing dividends, among other things, signal a firm’s ability to grow cash flows over time.

That’s translated to a portfolio that is strikingly higher quality than its peers. Morningstar calculates that 16% of Crawford’s firms have an economic moat; that is, a sustainable business advantage. That is well more than double their peers’ commitment to high-quality stocks and four times higher than their benchmark index’s.

source: Morningstar.com           

The combination of a high-quality, risk-conscious portfolio with the tendency of underfollowed small caps to become misunderstood and mispriced has then translated into strikingly stronger results than its peers have managed.

Comparison of 5-Year Performance (Since 201409)
  APR

Max DD Recvry
mo
Std dev DS dev Ulcer Index Bear mkt dev Sharpe
Ratio
Sortino
Ratio
Martin Ratio Capture ratio
Crawford Small Cap Dividend 8.6% -16.0 12+ 13.7 8.9 4.5 7.7 0.56 0.87 1.71 0.95
Small-cap core average 5.2 -21.5 13 15.8 10.9 6.9 9.3 0.27 0.40 0.67 0.74
Equity Income Average 6.6 -12.8 13 11.4 7.5 4.2 6.8 0.51 0.78 1.59 0.87

Here’s how to read that table: CDOFX has outperformed its small-cap core peer group by every measure of return (APR), risk (maximum drawdown, time to recover from the max drawdown, standard deviation, downside – or “bad” – deviation, bear market deviation and Ulcer index which factors together the depth and length of drawdowns), and risk-adjusted returns (Sharpe ratio, the more conservative Sortino, the much more conservative Martin and the capture ratio, which measures both the upside and downside capture of the S&P 500’s movement) over the past five years. It has substantially outperformed its Lipper peer group – remember: those are 145 mostly safe, conservative, large-cap dividend-payers – in raw return while only modestly greater volatility, which means that its risk-adjusted performance exceeds that of its peers.

Bottom Line

Lipper views equity-income funds as such distinctively conservative creatures that they classify them separately from categories such as large-cap value, where most equity income funds reside. It is rare to find the upside potential of a small-cap portfolio with so many of the characteristics of a conservative large-cap one. Cautious, long-term investors who sense opportunity in the reversal of the long domination of large caps over small caps might put CDOFX high on their due diligence list.

Fund website

Crawford Investment Counsel

Crawford Mutual Funds

Invenomic Fund (BIVRX/BIVIX/BIVSX), October 2019

By David Snowball

Objective and strategy

Invenomic Fund is seeking long term capital appreciation. They pursue that through a widely diversified long-short portfolio comprised, primarily, of domestic stocks. The long and short portfolios each held about 130 positions, as of August 2019. The long portfolio is generally fully invested in undervalued, timely stocks while the size of the short portfolio varies based on the opportunities available. The long portfolio is all-cap and might include equity securities other than just common stocks. The fund’s short portfolio is broadly diversified and targets stocks which the manager believes are both overvalued and likely to fall. The short portfolio is not designed merely as a defensive buffer; it is designed to deliver positive returns and reduce the overall risk of the portfolio through individual security selection.

Net equity exposure (percentage long minus percentage short) averaged 24% since inception (June 19, 2017) through August 2019. Among the tools available for hedging its equity exposure are investments in high-yield bonds and options.

Adviser

Invenomic Capital Management, LP. Invenomic was founded in 2015 to provide investment management services to institutional clients and high net worth individuals worldwide. The firm has five investment professionals and about $226 million in assets, as of August 2019. They offer their services through a ’40 Act fund and a private partnership; driven by external demand, within four to six months, the strategy should be available globally through a UCITS.

Originally, Invenomic served as the fund’s sub-advisor. In the spring of 2019, the fund’s original advisor, Balter Liquid Alternatives, made a strategic change-of-direction which led the fund to become an independent offering. In a considerable vote of confidence, “virtually everyone who touched the product at Balter” (Mr. Motamed’s estimation) has chosen to join Invenomic Capital: former Balter CEO Brad Balter, former Balter COO Jay Warner, former Balter CIO Ben Deschaine, and former Balter CCO Rebecca Gompper among them. From the potential investor’s perspective, that’s relevant because it means this is a small shop with an exceptionally strong team even beyond the investment side of the operation.

Manager

Ali Motamed and Ben Deschaine. Before launching Invenomic Capital, Mr. Motamed was a Senior Analyst and a Portfolio Manager with Robeco Investment Management for over 12 years (Portfolio Manager from July 2013 – October 2015) where he co-managed Boston Partners Long/Short Equity Fund (BPLEX) and a related strategy. He was awarded Portfolio Manager of the Year in the Alternatives Category by Morningstar in 2014.

Mr. Deschaine joined Invenomic when the group split with their former partner, Balter. Mr. Deschaine was Balter’s CIO and now serves as Invenomic’s president. While Mr. Motamed is responsible for the fund’s day-to-day construction, Mr. Deschaine is not only responsible for all of Invenomic’s non-investment business activities, but also helps to track and assess factor-based risks to the portfolio.  “It’s a funny world,” Mr. Motamed notes, “where investing has become so factorized that factor volatility exceeds market volatility; need to understand those masked sources of risk.” Before Balter, he worked with Sabertooth Capital Management and Federal Street.

Messrs. Motamed and Deschaine are assisted on the investment side by three analysts, Paul Goncalves Jr., Nate Victor, and Brendan Triano. Mr. Motamed was looking for bright and ambitious younger colleagues and screened, in particular, for analysts who had voluntarily pursued the rigorous, multi-year process of becoming a CFA charterholder or had backgrounds in computer science. He found that in Mr. Goncalves, who has experience analyzing cyclical businesses, Mr. Victor whose specialty is in tech and Mr. Triano whose special strengths are in computer science.

Strategy capacity and closure

The strategy capacity across all vehicles is about $3 billion.

Management’s stake in the fund

Mr. Motamed has invested more than $1 million in his fund. Mr. Deschaine has “a substantial investment,” but a more precise range won’t be available until after the publication of the fund’s new Statement of Additional Information.

Opening date

June 19, 2017

Minimum investment

$5,000 (BIVRX), $50,000 (BIVIX) and $50 million (BIVSX). The Super Institutional BIVSX share class will probably be capped at three or four investors; currently there is one investor in the share class.

Expense ratio

Net expense ratio of 3.18% for Investor class, 2.93% for Institutional class and 2.68% for Super Institutional class shares. The fund expenses are capped at 2.48% for Investor class, 2.23% for Institutional class and 1.98% for Super Institutional class. The assets under management are $1.4 Billion. Each share class has a redemption fee of 1% within 60 days of purchase.

[July 2023]

Comments

This is an update of our May, 2019 profile. This is a good fund that had a bad summer. While the summer months have seen two major developments surrounding the fund, neither of those developments changes our bottom line:

Invenomic has had an exceedingly promising start … Their approach is distinct, their strategy is disciplined, and their manager is well-tested. On whole, investors anxious about both preserving capital and generating positive returns in turbulent markets should consider putting Invenomic high on their due-diligence list.

Development #1: Balter is out of the picture.

At least “Balter” the firm and brand name is out of the picture. “Balter” the person has left Balter the firm to join Invenomic.

As we noted, briefly, in June:

The Balter Invenomic Fund (BIVIX) is in the process of shedding Balter. As a practical matter, that will translate to a name change, Invenomic Fund, and little more. The proxy document offers this somewhat cryptic explanation for the change:

BLA (i.e., Balter Liquid Alts) informed the Board that it was making this request because it is currently exiting the investment advisory business due to uncertainty involving a “seed investor” which could potentially affect its ability to provide services to the Fund and other funds in the future. BLA believes that this transition is in the best interest of the Fund and its shareholders as it will provide continuity for the Fund and create a more direct relationship between shareholders and Invenomic. The seed investor currently holds a non-voting equity interest in BLA and initially contributed seed capital for the Fund. 

On whole, the development appears to be amicable and driven by Balter’s business needs rather than any tension between Balter and Invenomic.

For Invenomic investors, this might be a blessing in disguise. Many of the Balter investment-support professionals chose to accept positions with Invenomic. That represents a substantial inflow of talent, much of which once divided its attention between a host of Balter funds and which now will focus their energy exclusively on Invenomic. That also allows Mr. Motamed to maintain his focus on the portfolio. In a September 2019 conversation, Mr. Motamed noted, with an almost gleeful note in his voice, “I have never felt better. I feel so calm. I understand exactly what’s going on because I have no one else in my way, I don’t have to spend time justifying things to a corporate parent.”

Fund flows have been consistently and, in some cases, dramatically positive. The prospect that a European investment house will commit large amounts to an upcoming UCITS version of the portfolio, while not guaranteed, is surely helpful.

As additional depth and redundancy, Invenomic has hired Blue River Partners out of Dallas to come in monthly to go over operations with a fine-tune comb, which helps with back-up and business continuity protection.

Development #2: Summer sucked.

Really bad. The fund dropped 3.4%, which had it trailing 99% of its peers. The manager described it as “the worst stretch” in memory. Mr. Motamed and I spoke for about a half hour in early September. His explanation for the summer swoon is that his long book is value-oriented and does not favor high-momentum stocks.

This was arguably the most historic momentum run in a four-month period, ever. It was driven by a flight to quality over the summer: everyone fled everything that had the slightest question. It was a market positioned for maximum insanity.

In the short term, that created pain on the long side. We were more comfortable taking some momentum risk on the long side. We were very good on the short side even despite insanity.

On the long side, that crazy flight has fed us opportunities. We are finding companies with no trade war risk, companies whose free-cash flow yields are in the mid-teens. It was a chance to buy incredible opportunities at insane valuations.

Frankly, I think our long book is amazing. The headwinds abated when narrative on tariffs abated: every tweet used to be about ratcheting-up the trade war, now every tweet is an opportunity to ratchet-down the dynamic. We were buying stocks that were priced for the worst-case; we can make a lot of profit on them if the news going forward is just “bad” rather than “awful.” For example, we were up 220 bps one day this week with no market exposure and no major news.

In support of his “most historic run” claim, Invenomic shared Bloomberg data on the divergence between high beta momentum and low beta momentum stocks, as measured by the Goldman Sachs High Beta Momentum Index (GSPRHIMO). GSPRHIMO is a pair trade that represents going long US High Beta Momentum Winners and short US High Beta Momentum Losers – essentially long the stocks up the most and short the stocks down the most recently. GSPRHIMO had its strongest 90 day return (56.1%) since inception from mid-April to late August. The chart below displays rolling 90 day returns of the index from GSPRHIMO inception (May 29, 2009) through August 2019.

This effect is further illustrated by indexes that track low-vol stocks, as many low-vol stocks have benefited the most from this recent strong run for momentum. As of early September, the Fidelity Low-Volatility Factor ETF (FDLO) was up nearly 25% YTD, 400 bps above the market, with gains of 6.3% during the three, volatile summer months. The corresponding Value Factor ETF (FVAL) returned barely half as much over the summer with a portfolio of companies that had better growth prospects than FDLO’s and were selling at just over half the price (measured by free-cash flow).

For Invenomic investors, the summer does not provide any cause for real concern. For prospective investors, it might provide an interesting entry-point. Mr. Motamed’s description of his investment discipline is “grind, grind, grind, pull back, then explode.” While the fund’s expense ratios remain a concern for us, since they create a permanently high hurdle for the managers, they have, to date, earned their money. For prospective investors, they warrant attention, investigation and dialogue with the team.

Fund website

Invenomic Fund (BIVIX).

Launch Alert: Grandeur Peak Global Contrarian

By David Snowball

Grandeur Peak Global Contrarian Fund (GPGCX) launched on Tuesday, September 17, 2019. It is Grandeur Peak’s first fund launch since 2015. Like the other core Grandeur Peak funds, Global Contrarian is capacity-constrained and will, in all likelihood, be closed to new investors in relatively short order. The exact strategy capacity, the Grandeur Peaks folks tell us, is hard to pin down because it’s affected by the liquidity of the names in the portfolio and the demands from some of the other GP funds whose portfolio overlaps it. Certainly more than $100 million, likely well under $300 million.

Of the seven extant Grandeur Peak funds, Global Stalwarts (GGSOX) and International Stalwarts (GISOX) remain open to all investors, Global Micro Cap (GPMCX) is closed to new investors and the remaining funds are closed to new investors through intermediaries but open to investors who invest directly through Grandeur Peak.

Grandeur Peak is a premier global micro- to small-cap investor with a bent toward quality and growth. Their portfolios typically hold between 100 – 300 stocks. Global Contrarian will be distinctive because it will be more value-oriented and, conceivably, more concentrated. Their description is “take larger and broader positions in out-of-favor and undervalued companies, sectors, and geographies.” In general, managers running growth-oriented portfolios track these stocks, but tend to avoid them because they don’t fit their mandates.

The portfolio will target firms that fall into one of five categories:

  • Core Contrarian: High quality companies in an out-of-favor industry or geography.
  • Fallen Angels: Quality growth companies that we believe have hit a temporary “bump in the road.”
  • Undiscovered Growth: High-quality companies that are growing, with nice headroom, but are not yet broadly discovered.
  • Under the Radar: Quality companies with underappreciated growth opportunities.
  • High Yield or Sum of Parts: Strong income producer with lower earnings growth; undervalued when aggregating total assets.

The firm’s CIO, Randy Pearce, argues that the sorts of stocks in the Contrarian portfolio have the potential to be substantially mispriced because neither growth managers nor index funds are able to invest in them: “The general market shift towards passive investing [means] there are plenty of good small/micro-cap companies that aren’t captured by passive products and are trading at even more appealing valuations. We’ve waited eight years to launch this fund. The timing feels right both for our team and the market opportunity.”

All of the other Grandeur Peak funds, with the exception of Global Microcap (GPMCX), have outperformed their peer groups by 210 – 420 bps annually since inception. The Grandeur Peak funds performed brilliantly in their first several years, and the GP folks agree that recent performance has been “fine but nothing break through.” Eric Huefner, GP’s president, points to a couple factors that have been impeding the funds’ short-term performance:

We haven’t been in a great market for our quality focused style. We’ve always talked about seeking to keep up in bull markets and outperform in a bear markets…well a 10-yr bull market hasn’t given us the best opportunity in which to shine, so we feel good about staying ahead of the benchmarks. We have also been swimming against a significant Emerging Markets headwind in our portfolios the last few years; we over-weighted EM because we think there are better long-term values there and we’re not going to try to make macro or market calls.

Since GPMCX is so distinctive – it closed on the first day of operation, has the second-lowest average market cap of any global fund, and its sector weightings often vary from its peers by 2:1 or 3:1 – the fact that it trails its Morningstar peer group is not particularly telling.

The portfolio managers for the Global Contrarian Fund will be Mark Madsen and Keefer Babbitt, with Robert Gardiner as the Guardian Portfolio Manager. Both managers are also on the Global Reach Fund (GPROX) team, and Mr. Madsen co-manages the International Opportunities Fund (GPIOX).

While designated an “institutional” fund, the minimum initial investment is $2,000. The minimum for a college savings account is $100. The Fund is, of course, available directly from Grandeur Peak and should be available through most of its existing channels (Schwab, TD Ameritrade, Pershing, Fidelity, etc.) though it sometimes takes a few days/weeks before a new fund is active on every platform.  The Grandeur Peak website has additional details.

Funds In Registration

By David Snowball

The Securities and Exchange Commission, by law, gets between 60 and 75 days to review proposed new funds before they can be offered for sale to the public. Each month, Funds in Registration gives you a peek into the new product pipeline. Most funds currently in registration will become available by late October.

Our list contains 22 new funds and active ETFs. We don’t track passive ETFs but, if we did, we’d mention the wicShares Merger Arbitrage ETF , offered up by Water Island Capital, advisors to the venerable Arbitrage Fund (ARBFX) and three others. Funds worth putting on your radar include Brown Advisory Tax-Exempt Sustainable Bond Fund, a fund combining low volatility, sustainability and tax avoidance; the family of Harbor Robeco Conservative Equity funds, a distinct break from Harbor’s normal model, providing lower-risk, ESG-screened exposure to the US, developed international, emerging and global markets; and the Oelschlager Equity and Technology Funds, which marks the return of a talented and thoughtful manager following his abrupt and startling departure from the family of Oak Associates funds that his father started and for which he was manager and co-CIO.

Absolute Core Strategy ETF

Absolute Core Strategy ETF, an actively-managed ETF, seeks positive absolute returns over a period of approximately five years. We’ll note, in passing, that there are 1400 funds that have managed that exact task over the past 10 years and a total of six that have managed it over the past 20. The plan is to buy 20-25 undervalued stocks. The fund will be managed by Robert Mark of St. James Investment Company. Mr. Mark has been using this same strategy in a set of separate accounts that he’s managed for, well, about three months. June 1, 2019, according to the prospectus. Not a lot of guidance there. Its opening expense ratio is 0.85%.

AlphaCentric LifeSci Healthcare Fund

AlphaCentric LifeSci Healthcare Fund will seek long-term capital appreciation. The plan is to invest in healthcare stocks and, if they get nervous, maybe inverse ETFs and defensive options, too. The fund will be managed by Mark G. Charest, Ph.D. of LifeSci Fund Management. Its opening expense ratio has not been disclosed, and the minimum initial investment will be $2,500.

Anfield Tactical Fixed Income ETF

Anfield Tactical Fixed Income ETF, an actively-managed ETF, seeks total return with capital preservation as a secondary objective. The plan is to invest tactically in three to 10 income-oriented ETFs; the deviously simple idea is to buy sectors that are going to rise and avoid the others. The fund will be managed by Peter van de Zilver and David Young of Anfield Capital. Its opening expense ratio is 1.30%.

Anfield U.S. Equity Sector Rotation ETF

Anfield U.S. Equity Sector Rotation ETF, an actively-managed ETF, seeks to outperform traditional large-cap equity indices and styles over full market cycles by investing in, and rotating through, the 11 sectors of the equity market. The fund will be managed by Peter van de Zilver and David Young of Anfield Capital. Its opening expense ratio is 1.60%.

BrightStone Li-Fi Technology Opportunities ETF

BrightStone Li-Fi Technology Opportunities ETF, an actively-managed ETF, seeks capital appreciation. The plan is to purchase the stocks of companies whose products or services are tied to Light Fidelity (“Li-Fi”) technology. Li-Fi is a wireless network that transmits signals via light rather than via radio signals. This led me down a minor rabbit hole as I tried to figure out how exactly that would work; the short answer is that there would be an LED mounted in the ceiling, flickering at 1 Mhz and connected devices all over the room, even those not in direct line-of-sight, could pick it up. The fund will be managed by David Bolton of BrightStone Global LLC. Its opening expense ratio has not been disclosed.

Brown Advisory Tax-Exempt Sustainable Bond Fund

Brown Advisory Tax-Exempt Sustainable Bond Fund will seek high level of current income exempt from Federal income tax by investing primarily in intermediate-term investment grade municipal bonds while giving special consideration to certain environmental, social, and governance criteria. The fund will be managed by Stephen M. Shutz and Amy Hauter of Brown Advisory. Its opening expense ratio is 0.61%, and the minimum initial investment will be $100.

Franklin Blockchain Enabled U.S. Government Money Fund

Franklin Blockchain Enabled U.S. Government Money Fund will seek as high a level of current income as is consistent with the preservation of shareholders’ capital and liquidity. It’s just a money market fund. Not to say that the “blockchain enabled” part is tawdry marketing but, really. Here’s the role of blockchain: “Blockchain-based shares; no investment in cryptocurrencies… the Fund’s transfer agent will maintain the official record of share ownership in book-entry form, the ownership of the Fund’s shares will also be recorded on the Stellar network, an electronic distributed ledger that is secured using cryptography (referred to as a “blockchain”) …The Fund’s investment manager believes that blockchain-based shares will provide increased transparency to Fund shareholders and may, in the future, permit reduced settlement times and provide other benefits to Fund shareholders.” The fund will be managed by Franklin Advisers. Its opening expense ratio has not been disclosed, and the minimum initial investment will be $20.

Goldman Sachs Income Fund

Goldman Sachs Income Fund will seek a high level of current income, and secondarily, capital appreciation. The plan is to create a multi-sector portfolio of U.S. and foreign investment grade and non-investment grade fixed income investments of varying maturities. The average maturity will range from 0 – 8 years. The fund will be managed by Ashish Shah, Co-Chief Investment Officer of Global Fixed Income, and Ron Arons, both of GSAM. Its opening expense ratio on any of the six share classes has not been disclosed, but the minimum initial investment for Investor class shares will be zero.

Harbor Mid Cap Fund

Harbor Mid Cap Fund will seek long-term total return. The plan is to buy undervalued mid-cap stocks, I think; the prospectus is really not a marvel of clarity and concision. The fund will be managed by Paul E. Viera of EARNEST Partners. Its opening expense ratio is 1.25%, and the minimum initial investment will be $2,500.

Harbor Robeco US Conservative Equities

Harbor Robeco US Conservative Equities will seek long-term growth of capital. The plan is to invest in stocks with “a  lower downside risk profile relative to the U.S. equity markets.” Such stocks might be characterized by the following:

  • low volatilities,
  • low market sensitivities,
  • high dividend yields,
  • attractive valuation,
  • strong momentum, and
  • positive analyst revisions.

The team will also impose an ESG screen but, on face, a wimpy one. The goal is an ESG score “at least as high as those of the Fund’s [as yet unnamed] benchmark index.” Really, if your benchmark index does not have an ESG screen, how high a bar are you setting for yourself just to match it? The fund will be managed by a team from Robeco Institutional Asset Management US. Its opening expense ratio is 0.80%, and the minimum initial investment will be $2,500.

The same prospectus lists three other funds managed by the same team, with the same discipline and same objective. They are:

Harbor Robeco International Conservative Equities Fund
Harbor Robeco Global Conservative Equities Fund
Harbor Robeco Emerging Markets Conservative Equities Fund

This is all sort of a big deal because this is a break for Harbor Funds. Their usual modus operandi is to find a fund they like and then clone it. It’s very rare for them to start with a blank slate.

Harbor Robeco Emerging Markets Active Equities Fund

Harbor Robeco Emerging Markets Active Equities Fund will seek long-term growth of capital. The plan is to invest in EM stocks using “a bottom-up driven investment strategy to gain exposure to the value, quality, momentum, and analyst revision factors within a tracking error limit.” The team will also impose an ESG screen. The fund will be managed by a team slightly different team from Robeco Institutional Asset Management US. Its opening expense ratio is 1.24%, and the minimum initial investment will be $2,500.

Nationwide Risk-Managed Income ETF

Nationwide Risk-Managed Income ETF, an actively-managed ETF, seeks current income with downside protection. The plan is to buy the Nasdaq-100 Index and an options collar. The hope is that the options will yield 6-10% a year, providing the risk-management in the name. The fund will be managed by a team from Harvest Volatility Management. Its opening expense ratio has not been disclosed.

Oelschlager Equity Fund

Oelschlager Equity Fund will seek long-term capital appreciation. The plan is to invest in 25-40 domestic growth stocks, and try to be patient with them. The fund will be managed by Mark Oelschlager, formerly manager of Pin Oak Equity Fund, the Live Oak Health Sciences Fund and the Red Oak Technology Select Fund. Its opening expense ratio is 1.10%, and the minimum initial investment will be $2,000.

Oelschlager Technology Fund

Oelschlager Technology Fund will seek long-term capital appreciation. The plan is to invest in 25-40 tech stocks and try to be patient with them. The fund will be managed by Mark Oelschlager, formerly manager of Pin Oak Equity Fund, the Live Oak Health Sciences Fund and the Red Oak Technology Select Fund. Its opening expense ratio is 1.10%, and the minimum initial investment will be $2,000.

QRAFT AI-Enhanced U.S. High Dividend ETF

QRAFT AI-Enhanced U.S. High Dividend ETF, an actively-managed ETF, seeks long-term total returns through regular dividend income and capital appreciation. Qraft is a South Korea-based provider of artificial intelligence investment systems and currently offers services to various financial institutions in Korea. The Adviser has licensed Qraft’s proprietary artificial intelligence security selection process for the management of the Fund.  Invoking terms like “deep learning technologies” and “Bayesian neural networks,” the plan appears to be buying 100 dividend-paying stocks based on estimations of short-term price momentum. The fund will be managed by Andrew Serowik and Travis Trampe who will “purchase and sell securities based on recommendations by the AQUA database” but who also have “full discretion” to ignore it. Its opening expense ratio has not been disclosed.

Rational/Pier 88 Convertible Securities Fund

Rational/Pier 88 Convertible Securities Fund will seek total return. The plan is to invest in convertible securities. The fund is a converted hedge, and will be managed by Pier 88 Investment Partners. Its opening expense ratio is 0.99%, and the minimum initial investment will be $1,000. As an aside, for $1,000 you can either invest in the “Institutional” share class and pay 0.99% or the “C” share class and pay 1.99% for the same thing. Ummm … is this a test?

Sierra Warrington Absolute Return Fund

Sierra Warrington Absolute Return Fund will seek total return. The plan is to invest primarily in long and short call and put options on futures contracts on the S&P 500 Index, and in cash and cash equivalents. The fund will be managed by Scott C. Kimple and Mark Adams of Warrington Asset Management. Its opening expense ratio is 2.44%, and the minimum initial investment will be $10,000. Note to the fund adviser: you forgot to put the name of the fund in the prospectus. The first time it’s mentioned is in the mailing address, near the end of the prospectus. Marketing tip: think about putting it on the cover!

Source Dividend Opportunity ETF

Source Dividend Opportunity ETF (DVOP), an actively-managed ETF, seeks total return. The plan is to buy 25-40 dividend paying stocks, including the ten highest yielding stocks in S&P 500 Value Index. The fund will be managed by Brendan Voege of Source Asset Management. Its opening expense ratio is 0.5%.

Sprott Gold Fund

Sprott Gold Fund will seek long-term capital appreciation. The plan is to invest in gold miners and processors, with the proviso that up to 20% of the fund’s assets might be invested directly in gold bullion. This is a rechristened version of Tocqueville Gold Fund and the fund will be managed by the same three guys. Bearish investors are generally blissful about owning gold; that said, the predecessor fund returned an average of 0.6% annually over the past decade. Its opening expense ratio has not been disclosed, and the minimum initial investment will be $1 million.

Manager Changes, September 2019

By Chip

Every month we track changes to the management teams of equity, alternative and balanced funds, along with a handful of fixed-income ones. Why “a handful”? Because most fixed-income funds are such sedate creatures, with little performance difference between the top quartile funds and the bottom quartile, that the changes are not consequential. Even in the realms we normally cover, the rise of management committees dilutes the significance of any individual’s departure or arrival.

This is another of the months in which the number of funds making changes is relatively large – 55 – but the number making dramatic changes is minimal. Alger Emerging Market’s founding manager, Deborah Medenica, has left and is being replaced by a three-person team. Crow Point Small Cap Growth gets its fourth new management team in a decade. Driehaus, which has a very distinctive and aggressive style, lost the contract to manage two Opus funds. Otherwise, just team tweaks.

Ticker Fund Out with the old In with the new Dt
AFMCX Acuitas US Microcap Fund No one, but . . . Meros Investment Management, L.P. has been added as another sub-adviser. They join teams from AltraVue Capital, LLC; ClariVest Asset Management, LLC; and Falcon Point Capital 9/19
AIEMX Alger Emerging Markets Fund Deborah Velez Medenica is no longer listed as a portfolio manager for the fund. Daniel Chung, Gregory Jones, and Pragna Shere will now manage the fund. 9/19
AAGPX American Beacon Large Cap Value No one, but . . . Effective December 31, 2019, Katherine Cannan, of Massachusetts Financial Services Company will be added as a portfolio manager, joining the rest of the team. 9/19
CWGIX American Funds Capital World Growth and Income Fund Mark Denning is no longer listed as a portfolio manager for the fund. Sung Lee, L. Alfonso Barroso, David Riley, Joyce Gordon, Alex Sheynkman, Michael Cohen, and Jin Lee will continue to manage the fund. 9/19
AEPGX American Funds EuroPacific Growth Fund Mark Denning is no longer listed as a portfolio manager for the fund. The eight other team members remain in place. 9/19
ANEFX American Funds New Economy Fund Mark Denning is no longer listed as a portfolio manager for the fund. Timothery Armour, Claudia Huntington, Harold La, and Caroline Jones will continue to manage the fund. 9/19
NEWFX American Funds New World Fund Mark Denning is no longer listed as a portfolio manager for the fund. Carl Kawaja, Nicholas Grace, Jonathan Knowles, Christopher Thomsen, Robert Lovelace, Wahid Butt, Winnie Kwan, Bradford Freer, and Steven Backes will continue to manage the fund. 9/19
ANFLX Angel Oak Financials Income Fund (formerly known as Angel Oak Flexible Income Fund) Clayton Triick will no longer serve as a portfolio manager for this fund, moving over to the team at Angel Oak Multi-Strategy Income Fund. Cheryl Pate joins Johannes Palsson, Navid Abghari, and Sreeniwas Prabhu on the management team. 9/19
ANGLX Angel Oak Multi-Strategy Income Fund No one, but . . . Clayton Triick joins Berkin Kologlu, Sreeniwas Prabhu, Sam Dunlap, Kin Lee, and Colin McBurnette on the management team. 9/19
BXMIX Blackstone Alternative Multi-Strategy Fund No one, but . . . Raymond Chan joins Gideon Berger, Min Htoo, Robert Jordan, Ian Morris, Stephen Sullens, and Alberto Santulin on the management team. 9/19
BAEMX BMO LGM Emerging Markets Equity Fund Effective November 26, 2019, Damian Bird will depart LGM Investments Limited and his portfolio management duties. Irina Hunter and Rishikesh Patel will continue to manage the fund. 9/19
CAVAX Catholic Values Equity Fund Travis Prentice and Montie Weisenberger are no longer listed as portfolio managers for the fund. Jeff Walkehorst, David McGonigle, Mark Giovanniello, and Eric Brown join the rest of the team in managing the fund. 9/19
KNG CBOE Vest S&P 500 Dividend Aristocrats Target Income ETF Effective immediately, Rachel Ames no longer serves as a Portfolio Manager. Karan Sood and Howard Rubin continue to serve as portfolio managers of the fund, as they have since its inception. 9/19
NLGIX Columbia Global Strategic Equity Fund Mark Burgess is no longer listed as a portfolio manager for the fund. William Davies joins Melda Mergen in managing the fund. 9/19
GAMIX Crow Point Small-Cap Growth Fund Tom Norton and Alan Norton no longer serve as portfolio managers of the fund. Peter DeCaprio and David Cleary will now manage the fund; they are the fund’s fourth new management team in 10 years. 9/19
PIPEX Cushing MLP Infrastructure Fund (which at the end of the year changes its name and ticker to Cushing MLP Infrastructure Fund NXGNX) Effective as of December 1, 2019, Paul Euseppi and John Musgrave depart. Saket Kumar, Alex Palma and Hari Kusumakar will join long-time manager Jerry Swank. 9/19
DEDAX Delaware Emerging Markets Debt Fund No one, but . . . Alex Kozhemiakin joins Mansur Rasul and Sean Simmons in managing the fund. 9/19
DPREX Delaware Global Listed Real Assets Damon Andres, Babak Zenouzi, and Scott Hastings are no longer listed as portfolio managers for the fund. Stefan Löwenthal and Jürgen Wurzer are now managing the fund. 9/19
FAHDX Fidelity Advisor High Income Advantage Fun Harley Lank no longer serves as portfolio manager of the fund. Brian Chang and Mark Notkin will now manage the fund. 9/19
FAGIX Fidelity Capital & Income Fund No one, but . . . Brian Chang joins long-time manager Mark Notkin in managing the fund. 9/19
FMIMX FMI Common Stock Fund Matthew J. Goetzinger no longer serves on the team. Dain C. Tofson has joined Patrick English, John Brandser, Jonathan Bloom, Robert Helf, Benjamin Karek, Andy Ramer, Daniel Sievers, Matthew Sullivan, and Jordan Teschendorf in managing the fund. 9/19
FMIJX FMI International Fund Matthew J. Goetzinger no longer serves on the team. Dain C. Tofson has joined Patrick English, John Brandser, Jonathan Bloom, Robert Helf, Benjamin Karek, Andy Ramer, Daniel Sievers, Matthew Sullivan, and Jordan Teschendorf in managing the fund. 9/19
FMIHX FMI Large Cap Fund Matthew J. Goetzinger no longer serves on the team. Dain C. Tofson has joined Patrick English, John Brandser, Jonathan Bloom, Robert Helf, Benjamin Karek, Andy Ramer, Daniel Sievers, Matthew Sullivan, and Jordan Teschendorf in managing the fund. 9/19
HGXAX Hartford Global Impact Fund Eric Rice will leave effective October 3, 2019. Tara Stilwell will now manage the fund. Both are employees of Wellington Management, which implies continuity going forward. 9/19
HNRGX Hennessy BP Energy Fund Effective as of September 5, 2019, William Woodson “Trip” Rodgers is no longer a manager of the fund. Benton Cook joins Toby Loftin and Tim Dumois in managing the fund. 9/19
HEOAX Highland Long/Short Equity Fund Effective immediately, Michael McLochlin will no longer serve as a portfolio manager for the fund. Bradford Heiss and James Dondero will continue to manage the fund. 9/19
HMEAX Highland Merger Arbitrage Fund Effective immediately, Michael McLochlin will no longer serve as a portfolio manager for the fund. Bradford Heiss, Eric Fritz, and James Dondero will continue to manage the fund. 9/19
EMIAX Invesco Oppenheimer Emerging Markets Innovators Fund Heidi Heikenfeld will no longer serve as a portfolio manager for the fund. Justin Leverenz will continue to manage the fund. 9/19
HYLV IQ S&P High Yield Low Volatility Bond ETF Dan Roberts will no longer serve as a portfolio manager of the fund. Joseph Cantwell will join Scott Dolph and Alexandra Wilson-Elizondo in managing the fund. 9/19
JPHAX JPMorgan Floating Rate Income Fund Christopher Musbach will be assuming a new role within J.P. Morgan Investment Management Inc. and will no longer serve as a portfolio manager for the fund. William Morgan, James Shanahan, Alexander Sammarco, and Michael Schlembach will continue to manage the fund. 9/19
MTRAX MainStay Income Builder Fund Effective January 1, 2020, Dan Roberts will no longer serve as a portfolio manager of the fund. The rest of the team will continue to manage the fund. 9/19
MTMAX MainStay MacKay Total Return Bond Fund Effective January 1, 2020, Dan Roberts will no longer serve as a portfolio manager of the fund. The rest of the team will continue to manage the fund. 9/19
MASAX MainStay MacKay Unconstrained Bond Fund Effective January 1, 2020, Dan Roberts will no longer serve as a portfolio manager of the fund. The rest of the team will continue to manage the fund. 9/19
EXEYX Manning & Napier Equity No one, but . . . Marc Tommasi joins Christian Andreach, Ebrahim Busheri, and Jay Welles on the management team. 9/19
EXOSX Manning & Napier Overseas Jeffrey Donlon will no longer serve as a portfolio manager for the fund. Christian Andreach and Jay Wellles will join Marc Tommasi and Ebrahim Busheri on the management team. 9/19
MNREX Manning & Napier Real Estate Michael Magiera will no longer serve as a portfolio manager for the fund. Elizabeth Mallette, Joseph Rydzynski, and Corey Van Lare will continue to manage the fund. 9/19
NFACX Neuberger Berman Focus Fund No one, but . . . Hari Ramanan has been added as a portfolio manager, joining Timothy Creedon and David Levine on the management team. 9/19
NGQIX Neuberger Berman Integrated Large Cap Fund Benjamin Segal and Elias Cohen are no longer listed as portfolio managers for the fund. Jacob Gamerman and Simon Griffiths will now manage the fund. 9/19
OISC Opus International Small/Mid Cap ETF Len Haussler and Adam Eagleston are out, as is Driehaus Capital Management. John “JD” Gardner and Beckham Wyrick will now manage the fund. 9/19
OSCV Opus Small Cap Value Plus ETF Len Haussler and Adam Eagleston are out, as is Driehaus Capital Management. John “JD” Gardner and Beckham Wyrick will now manage the fund. 9/19
OIOAX Orinda Income Opportunities Fund Joshua Rowe no longer serves as a portfolio manager for the fund. Paul Gray and Ian Goltra continue to serve as co-portfolio managers for the fund. 9/19
OTCRX Otter Creek Long/Short Opportunity Fund Michael Winter will no longer serve as a portfolio manager for the fund. R. Keith Long rejoins Tyler Walling on the management team. Mr.Long originally serves from inception through 2017, then stepped aside. 9/19
TRLAX T. Rowe Price Retirement Income 2020 Fund No one, but . . . Kimberly DeDominicis will join Jerome Clark and Wyatt Lee on the management team. 9/19
TBWAX Thornburg Better World James Gassman will no longer serve as a portfolio manager for the fund. Di Zhou will continue to manage the fund. 9/19
TVLAX Touchstone Value Fund Jeff Fahrenbruch no longer serves as a portfolio manager to the fund. Mark Giambrone, Lewis Ropp, and David Ganucheau continue to serve as portfolio managers of the fund. 9/19
GUIQX Victory INCORE Investment Quality Bond Fund S. Brad Fush and Gregory Oviatt have resigned as portfolio managers of the fund. Richard Cosul, Edward Goard, and James Kelts will continue to manage the fund. 9/19
RLDAX Victory INCORE Low Duration Bond Fund S. Brad Fush and Gregory Oviatt have resigned as portfolio managers of the fund. Richard Cosul, Edward Goard, and James Kelts will continue to manage the fund. 9/19
MUCAX Victory INCORE Total Return Bond Fund S. Brad Fush has resigned as portfolio manager of the fund. Richard Cosul, Edward Goard, and James Kelts will continue to manage the fund. 9/19
BLHY Virtus Newfleet Dynamic Credit ETF Jonathan Stanley no longer serves as a portfolio manager of the fund. William Eastwood and Eric Hess join David Albrycht and Francesco Ossino on the management team. 9/19
NFLT Virtus Newfleet Multi-Sector Bond ETF Jonathan Stanley no longer serves as a portfolio manager of the fund. Benjamin Caron joins the team. 9/19
WSBFX Walden Balanced Fund (formerly Boston Trust Asset Management Fund) No one, but . . . Amy Crandal Kaser and Jason O’Connell joins Domenic Colasacco on the management team. 9/19
WWLAX Westwood LargeCap Value Fund Varun Singh is no longer listed as a portfolio manager for the fund. William Sheehan joins Scott Lawson, Matthew Lockridge, and Casey Flanagan on the management team. 9/19
WCGNX William Blair Mid Cap Growth Fund No one, but . . . James Jones joins Robert Lanphier and Daniel Crowe on the management team. 9/19
WSMNX William Blair Small-Mid Cap Growth Fund No one, but . . . James Jones joins Robert Lanphier and Daniel Crowe on the management team. 9/19
ZFLAX Ziegler Senior Floating Rate Fund No one, but . . . Roberta Goss joins George Marshman, Gil Tollinchi, and Scott Roberts on the management team. 9/19


Briefly Noted

By David Snowball

Updates

Approach with caution, perhaps mixed with mild annoyance. Brown Brothers, Harriman announced a series of moves this month:

on September 9, 2019, they launched BBH Select Series – Large Cap Fund (BBLRX/BBLIX)

on September 20, 2019, they announced the closing of BBH Core Select (BBTEX) to new investors

on September 23, 2019, they announced the liquidation of BBH Core Select, effective October 9, 2019.

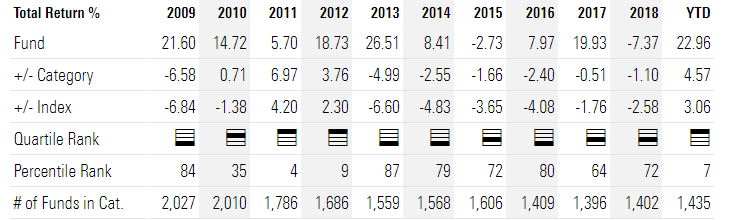
BBH Core Select was a superstar fund from 2005-12, and assets poured in. Over those years, it grew 20-fold in size to $6 billion. 2017 is the fund’s first above-average year since then and money has been rushing out the door: it appears to have had net inflows in one month between 2013-2018 and the incessant outflows have forced the managers to liquidate a portfolio with lots of embedded capital gains, which is causing more flight and is deterring new investments. Closing BBTEX at the same moment you open BBLIX effectively flips on a neon sign that reads “BBH Core Select without the tax risk: enter here!”

BBH Select Series-Large Cap Fund (BBLRX / BBLIX) is a clone of Core Select The prospectus is pretty explicit about the connection, as when it discusses “the performance of a composite of accounts managed by BBH&Co. that have investment objectives, policies and strategies substantially similar to those of the Fund (i.e., BBH&Co.’s Core Select Strategy).” The new fund’s expense ratios are 0.80% and 1.05% for Institutional and Retail, respectively, and the minimum initial investments are $10,000 and $5,000.

Three consequences of the change:

  1. The remaining BBTEX shareholders become heir to the fund’s remaining tax bill. This is not structured as a tax-free reorganization.

  2. BBH buries six years of mediocrity.

  3. New BBRLX shareholders get to start with a clean tax slate, which might increase the prospect that there will be new BBRLX shareholders.

We called BBH after the liquidation of BBTEX was announced, asking for comment on why they’d chosen to liquidate the fund. The phone representative was unable to address the question and promised to forward it to people who could. As of our publication deadline, we haven’t heard back.

The prospectus for the US Vegan Climate ETF (VEGN) is now available for interested parties. It aspires to track the Beyond Investing US Vegan Climate Index which seeks to address the concerns of vegans, animal lovers, and environmentalists. Ummm… why exclude tobacco and guns? There are certainly perfectly fine reasons for doing so, but neither seems much implicated in either of the fund’s titular concerns.

Briefly Noted . . .

Thanks to The Shadow and the folks on MFO’s discussion board; the former for catching a bunch of interesting developments that were otherwise under the radar and the latter for helping to think through their significance. I enjoyed reading their discussions.

SMALL WINS FOR INVESTORS

Effective immediately, the O’Shaughnessy Market Leaders Value Fund (OFVIX), the O’Shaughnessy Small Cap Value Fund (OFSIX) and the O’Shaughnessy Small/Mid Cap Growth Fund (OFMIX) will no longer charge a redemption fee on Class I shares redeemed within 90 calendar days of purchase.

Effective December 2, 2019, purchases of Class A shares of PIMCO Short Asset Investment Fund (PAIAX) will no longer be subject to an initial sales charge or contingent deferred sales charge. This is a development worth noticing. When you see “cash” listed in the portfolio of one of the PIMCO funds, they don’t mean that the money is in a mayonnaise jar on Funk and Wagnall’s back porch. They mean it’s been invested, primarily, in commercial paper which is designed to be highly liquid with returns a bit greater than the rate of inflation. PAIAX is a mutual fund that gives retail investors access to that same conservative, strategic cash portfolio. Our profile of the fund, from 2013, concluded,

This fund will not make you rich but it may be integral to a strategy that does. Your success, like the ants, may be driven by two different strategies: never leaving a crumb behind and being ready to hop on the occasional compelling opportunity. PAIAX has a role to play in both. It does give you a strong prospect of picking up every little crumb every day, leaving you with the more of the resources you’ll need to exploit the occasional compelling opportunity.

Prospector Capital Appreciation (PCAFX) and Prospector Opportunity (POPFX) have both announced e.r. reductions of 5 bps. In the case of tiny but excellent funds, that’s sort of icing on the cake.

Effective September 13, 2019, Scharf Investments, will be reducing the Fund’s minimum initial investment for the Institutional of the Scharf Fund (LOGIX) from $5 million to $1 million.

CLOSINGS (and related inconveniences)

Effective at the close of business on November 8, 2019, Cohen & Steers Real Estate Securities Fund (CSIEX) will be closed to new investors.

I just report ‘em: “Effective at the open of business on September 16, 2019, shares of the Equable Shares Large Cap Fund (EQLIX) will be offered for purchase. Effective as of the close of business on September 18, 2019, the Fund will be closed to all new purchases.” Equable did the same shut/open/shut flutter with its small cap fund last month.

Effective September 10, 2019, James Alpha MLP Portfolio (JAMLX) closed to both new and existing shareholders. With $7 million in assets and a one-star rating, one imagines this is prelude to liquidation.

OLD WINE, NEW BOTTLES

Effective October 1, 2019, Advisory Research Emerging Markets Opportunities Fund (ADVMX) will change to Vaughan Nelson Emerging Markets Opportunities Fund and the five-star Advisory Research International Small Cap Value Fund (ADVIX) will change to Vaughan Nelson International Small Cap Fund. Each Fund’s investment objective and principal investment strategies will remain the same after the name change.

Effective November 4, ARK Industrial Innovation ETF (ARKQ) will be renamed ARK Autonomous Technology & Robotics ETF. Here’s the key: currently they focus on “industrial innovation” but soon they’ll focus on “disruptive innovation” (mostly industrial).

Perhaps responding to The Ohio State University’s attempt to trademark the word “The,” Baillie Gifford is getting out of The fund business and into the Baillie Gifford Fund business. Effective as of November 25, 2019, the name of each Baillie Gifford fund is changed as follows:

Current Name New Name
The Asia Ex Japan Fund Baillie Gifford Asia Ex Japan Fund
The EAFE Fund Baillie Gifford International Growth Fund
The EAFE Choice Fund Baillie Gifford EAFE Plus All Cap Fund
The EAFE Pure Fund Baillie Gifford Developed EAFE All Cap Fund
The Emerging Markets Fund Baillie Gifford Emerging Markets Equities Fund
The Global Alpha Equity Fund Baillie Gifford Global Alpha Equities Fund
The Global Select Equity Fund Baillie Gifford Global Stewardship Equities Fund
The International Concentrated Growth Fund Baillie Gifford International Concentrated Growth Equities Fund
The International Equity Fund Baillie Gifford International Alpha Fund
The International Smaller Companies Fund Baillie Gifford International Smaller Companies Fund
The Long Term Global Growth Equity Fund Baillie Gifford Long Term Global Growth Fund
The Multi-Asset Fund Baillie Gifford Multi Asset Fund
The Positive Change Equity Fund Baillie Gifford Positive Change Equities Fund
The U.S. Equity Growth Fund Baillie Gifford U.S. Equity Growth Fund

Boston Trust Asset Management Fund (BTBFX) has changed its name to Walden Balanced Fund (WSBFX). Collectively, the fund family moved from Boston Trust and Walden Funds to Boston Trust Walden Funds.

On or about November 1, 2019 Catalyst IPOX Allocation Fund (OIPAX) will become the Catalyst Enhanced Core Fund. When that happens, the mandate to focus on IPOs will be eliminated and expenses will drop substantially.

Sometime before year’s end (they’re not yet able to commit to a date) Cambria Core Equity ETF (CCOR) and its manager leave Cambria to become the Core Alternative ETF. They expect the e.r. to tick down, but everything else remains the same. It’s an options-based fund that’s had one relatively good year (top 3%) and one relatively bad one (bottom 10%), both with positive returns in the low single digits. The equation Core Equity = Core Alternative strikes me as odd since it suggests very different visions of the fund’s role and nature.

Effective as of December 1, 2019, the Cushing MLP Infrastructure Fund’s name and ticker (PIPEX, reflecting the focus of MLP’s on oil and gas pipelines) will change to the Cushing NextGen Infrastructure Fund (NXGNX). The high cost/low purpose “C” share class will, I’m glad to report, vanish. After the change their infrastructure focus will broaden to include “industrial infrastructure companies, sustainable infrastructure companies and technology and communication infrastructure companies.” They’ll also drop fees a bit and add three new co-managers.

Effective on or about October 14, 2019, the First Western Funds become the Oakhurst Funds. In particular,

Current Name New Name and Ticker Symbol
First Western Funds Trust Oakhurst Funds Trust
First Western Fixed Income Fund Oakhurst Fixed Income Fund OHFIX
First Western Short Duration Bond Fund Oakhurst Short Duration Bond Fund OHSDX
First Western Short Duration High Yield Credit Fund  Oakhurst Short Duration High Yield Credit Fund OHSHX

Following a change of the underlying index, on October 1, 2019, SPDR Nuveen S&P High Yield Municipal Bond ETF (HYMB) becomes SPDR Nuveen Bloomberg Barclays High Yield Municipal Bond ETF. Changes between near-identical indexes are usually driven by company financials: if Bloomberg will license use of their index for substantially less than S&P charges, the fund will flip.

Steben Alternative Investment Funds, advisor to the Steben Managed Futures Fund (SKLAX) is being bought by Octavus Group, LLC, advisor to the LoCorr Funds. One senses a name change on the horizon. The fund isn’t as bad as it, at first glance, looks. It missed a massive move by its benchmark index that occurred during the fund’s first 11 months of operation, but it’s been solid since.

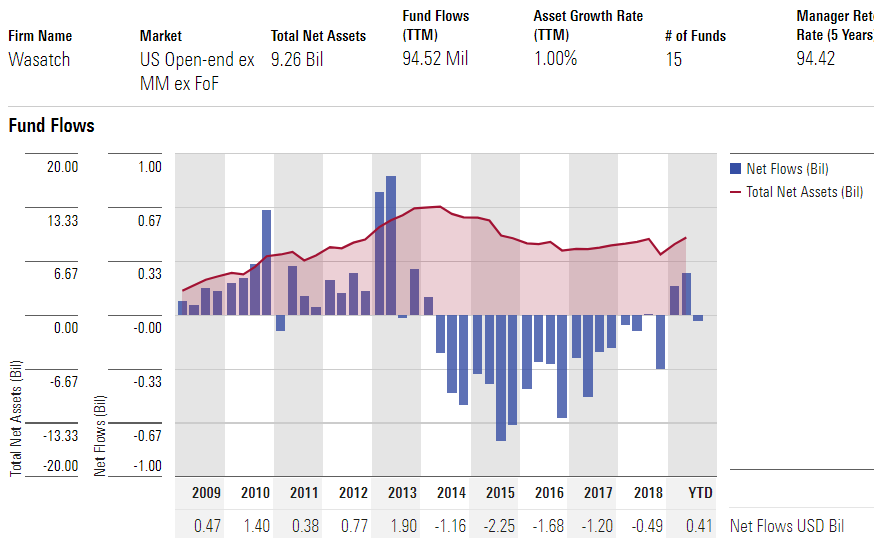
As of September 24, 2019, Wasatch Advisors has rebranded as Wasatch Global Investors. Wasatch’s president Eric Bergeson argues that “Global” better reflects “our global business” and the fact that almost half of their assets are in global and international strategies. Skeptics on the MFO discussion board promptly identified the change as a marketing strategy. Given five years of steady outflows, enhanced marketing is surely warranted.

One speculation was that the firm might be marketing itself, potentially to a European acquirer.

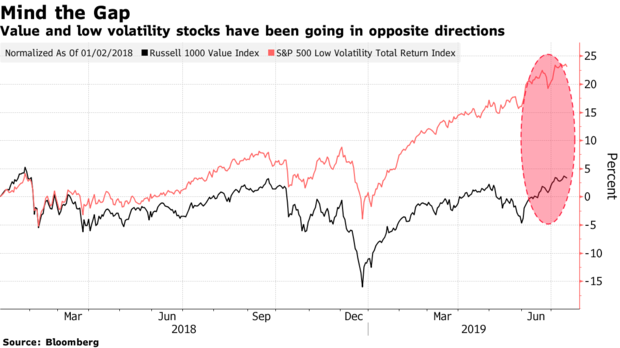
Less low: On or around November 1, 2019 Westwood Low Volatility Equity Fund (WLVIX) becomes Westwood Total Return Fund. As now, it will seek total return but it will no longer promise “a lower level of volatility than traditional equity-oriented strategies over a market cycle” and it will no longer constrain itself to be 80% invested in equities.

On the same day, Westwood Short Duration High Yield Fund (WSDAX) becomes Westwood High Income Fund and it also dispenses with the “while experiencing lower volatility” piece. Westwood Market Neutral Income Fund (WMNUX) becomes Westwood Alternative Income Fund but they merely tweak the wording in their mandate without noticeably changing it.

OFF TO THE DUSTBIN OF HISTORY

AdvisorShares New Tech and Media ETF (FNG) will be liquidated on October 11, 2019. The fund managed to lose 27% last year and 34% so far this year, turning a $10,000 initial investment into $5,123 … and, I guess, a nice tax deduction? I’m guessing that the fund’s ticker is a nod to its initial enthusiasm for FAANG stocks.

Alambic Mid Cap Plus Fund (ALMGX) and Alambic Small Cap Plus Fund (ALGSX) closed to new investments on September 23, 2910 and will discontinue their operations effective October 28, 2019. The funds have $4 million between them; to their credit, much of it is their managers’ money. Small Cap started strong, then tailed off. Mid Cap never had noticeable traction in either performance or marketing.

AlphaCentric Small Cap Opportunities Fund (SMZAX) gave its two weeks’ notice and liquidated on September 27, 2019.

Altegris/AACA Real Estate Income Fund (INMAX) will be liquidated on October 28, 2019. The fund has just $200,000 in assets, none of it from its managers.

The Board of Trustees of American Beacon Funds has approved a plan to liquidate and terminate the American Beacon Ionic Strategic Arbitrage Fund (IONAX) on or about October 15, 2019.

American Century Adaptive Equity (AMVIX) failed to adapt. It remains open to new investments until November 11 but will liquidate one month later.

AMG Managers Amundi Intermediate Government Fund, AMG GW&K U.S. Small Cap Growth Fund (ATASX), AMG Managers Amundi Short Duration Government Fund and AMG Managers Essex Small/Micro Cap Growth Fund (MBRSX) will all be liquidated on or about October 29, 2019.

The Chadwick & D’Amato Fund (CDFFX) will cease operations on October 28, 2019. It’s a $33 million tactical allocation fund whose tactics have earned it about 3% a year over the past decade.

CVR Dynamic Allocation Fund (CVRAX) becomes a former fund on Halloween, October 31, 2019.

Direxion Daily Euro STOXX 50 Bull 3x Shares (EUXL), Direxion Daily High Yield Bear 2x Shares (HYDD) and Direxion Daily 7-10 Year Treasury Bear 1x Shares (TYNS) will all liquidate on October 18, 2019.

HSBC Asia ex-Japan Smaller Companies Equity Fund (HAJAX) and HSBC Emerging Markets Debt Fund (HCGAX) will cease its investment operations and liquidate their assets on or before October 28, 2019.

In cleaning up after their acquisition of the Oppenheimer funds, Invesco has announced a long series of liquidations:

Invesco Tax-Exempt Cash Fund

Invesco OFI Pictet Global Environmental Solutions Fund

Invesco Strategic Real Return Fund

Invesco Alternative Strategies Fund

Invesco Multi-Asset Inflation Fund

Invesco Emerging Markets Flexible Bond Fund

Invesco Oppenheimer Global Unconstrained Bond Fund

Invesco Oppenheimer Preferred Securities and Income Fund

Invesco Oppenheimer SteelPath MLP & Energy Infrastructure Fund

Invesco Oppenheimer SteelPath Panoramic.

Folks following Invesco/Oppenheimer might want to review an extended and thoughtful discussion of the merger on MFO’s discussion board.

James Alpha MLP Portfolio (JAMLX) has closed to new investors. That announcement said nothing to imply the fund’s imminent demise but a $7 million asset base and one-star rating implies a short stay in hospice.

JOHCM US Small Mid Cap Equity Fund (JODIX) will liquidate on October 11, 2019. Tiny fund with tepid results. It was managed by a London-based team who’d moved from Fidelity’s quant division, Pyramis, to J O Hambro to manage the strategy.

JPMorgan Emerging Economies Fund (JEEAX) undergoes liquidation and dissolution on or about October 24, 2019

None of Lazard Emerging Markets Income (LEIOX), Lazard Explorer Total Return (LETOX) and Lazard US Realty Equity (LEROX) will survive Halloween, 2019. It’s in the best interest of their shareholders, we’re told, that they go. It’s easy to make that case for the first two (small and stumbling) funds, harder with the four-star, Bronze-rated Realty Equity fund. The fund, in both good years and bad, leaked assets.

The $7 million Mount Lucas U.S. Focused Equity Fund (BMLEX) will cease its business, liquidate its assets and distribute its liquidation proceeds on or about October 25, 2019. It’s not a bad little fund, but it appears that a major investor left in late 2016, taking two-thirds of the fund’s assets when it left. They haven’t been able to gain market traction since.

Segall Bryant & Hamill Smid Cap Value Dividend Fund (WTSDX) will be liquidated on or about October 29, 2019. The good news was that flows were pretty stable, the bad news was that the fund still had under a million in assets.

Trillium All Cap Fund was authorized in 2015 but never launched. The advisor has determined that the shares will never be offered. I keep rooting for Trillium: a rare women-owned advisor, experienced managers, ESG focus, $500 million in assets, one pretty solid fund and one pretty weak one.

Early this year, the NYSE gave USCF Summerhaven SHPEN Index Fund (BUYN) six months to find at least 50 shareholders or face delisting. They haven’t managed that yet, but have been given an additional three months before facing the prospect of delisting. Losing money in each of its two years of existence, and losing money this year while its peers are nearing double-digit gains, has made that task difficult.

VanEck Vectors High Income Infrastructure MLP ETF (YMLI) is winding down, a process which is expected to be complete on or about October 25, 2019.

As of December 1, 2019, VanEck Vectors High Income MLP ETF (YMLP) will change:

    1. its name, to VanEck Vectors Energy Income ETF
    2. its benchmark
    3. its investment objective
    4. its investment policy
    5. its investment strategies
    6. its tax status and
    7. its fees.

Otherwise nothin’ to see here folks, just move along.