


Momentum is contrasted with “Buy and Hold” to develop a Tactical Sleeve. The objective is to increase risk-adjusted returns and benefit from the evolving business cycle.
I have written articles on Mutual Fund Observer about investing according to the business cycle, fund rotation, and trend following as well as finding funds that manage risk over the complete business cycle. As an individual investor nearing retirement, I like to evaluate funds and the investment once a month and make small adjustments if appropriate. I am settling on having 75% of my portfolio in buy and hold funds that get rebalanced roughly once a year or when the markets reach extremes, and 25% for a Tactical Sleeve. Tactical Strategy and Strategic Asset Allocation are defined by Investopedia as:
Tactical trading (or tactical asset allocation) is a style of investing for the relatively short term based on anticipated market trends. Tactical trading involves taking long or short positions in a range of markets, from equities and fixed income to commodities and currencies. Diversified long-term portfolios will often include a tactical trading overlay, which involves allocating part of the portfolio to short-term and medium-term trades, in order to boost overall portfolio returns.
Strategic asset allocation is a portfolio strategy. The investor sets target allocations for various asset classes and rebalances the portfolio periodically. The portfolio is rebalanced to the original allocations when they deviate significantly from the initial settings due to differing returns from the various assets.
I have been building the Ranking System for a couple of years, but only added the Watchlist with Tactical View this past month. In this article, I compare my Ranking System which consists of seven factors including momentum to the Momentum Factor. The Ranking System is intended to identify funds with good long-term histories that are doing well now while the Momentum Factor attempts to find funds that are now trending up and attracting inflows. The first step is to choose a manageable number of funds to include in the Watchlist based on the direction that I believe the investment environment is headed. The final product divides the nearly sixty funds in the Watchlist into nine boxes of lower, medium, and high Rank versus lower, medium, and high momentum. The positioning of the funds are relative to each other and will move around based on mostly momentum.
This article is divided into sections for those who wish to skip to particular topics of interest. Key Points are added at the top of each section for those who have limited time.
- Adjusting Allocations: Keeping Your Powder Dry (cash, COTZX/CTFAX)
- Sector and Business Cycle Rotation
- One Stop Shop Mutual Funds with a Tactical Strategy
- Momentum vs Author’s Ranking System
- Closing
Adjusting Allocations: Keeping Your Powder Dry
Key Point: COTZX/CTFAX is selected as a partial alternative to holding cash. The fund changes allocations to stock, based on cyclically adjusted valuations.
John Bogle, Founder of the Vanguard Group and the father of passive index investing, wrote Enough: True Measures of Money, Business, and Life. In 1999, Mr. Bogle was “concerned about the (obviously) speculative level of stock prices.” Mr. Bogle reduced his equity exposure to about 35 percent of assets, which he held through the time of writing Enough in 2010. Currently, this is approximately my allocation to stock.
“Clearly, investors would have been wise to set their expectation for future returns on the basis of the current sources of returns rather than fall into the trap of looking to past returns to set course. That dividend yield as 2000 began was at an all-time low of just 1 percent and the P/E at a near-record high of 32 times earnings together explain why the average return on stocks in the current decade is at present running at an annual rate of less than 1 percent.”
The stock market by about any measure is in bubble territory. One solution is to follow Mr. Bogle’s lead and increase allocations to cash or bonds. Timing the market is difficult to do consistently. Take Columbia Thermostat. It had a drawdown of 43% during the Financial Crisis but performed outstandingly during the 2020 recession. D. Michael Sullivan from Raymond James Financial Services explained to me that when the Financial Crisis began Columbia Thermostat would either be invested 100% in stocks or 100% in bonds. It has changed its strategy to be based on an allocation table.
Effective May 1, 2021, Columbia Thermostat Fund changed its allocation table which is based on the level of the S&P 500 as shown in Table #1. The new allocation is now 10% equity and 90% fixed-income compared to the prior allocation of 50% equity and 50% fixed-income. When Columbia Thermostat updated its allocation, I moved my “Dry Powder” to COTZX/CTFAX.
The updates to the S&P 500 Index levels in the table below are calculated based on a cyclically adjusted price-to-earnings (P/E) ratio for the prior seven-year period. If the P/E ratio is in the top 25%, we determine that the market is “expensive” and use the full version of the table. As a result of last year’s historic rise, we are currently in the top ninth percentile of P/E—well within the top 25% that designates an expensive market.
Table #1: Columbia Thermostat Allocation Table – May 2021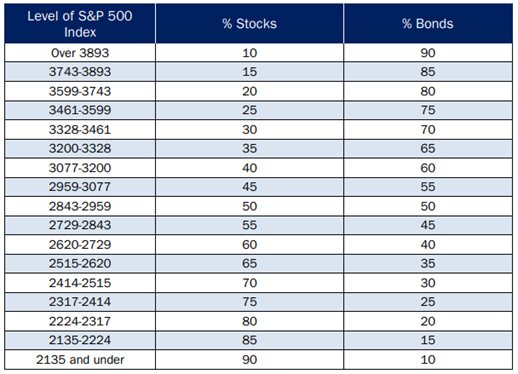
We are in the “Everything Bubble” and interest rates are low, and likely to rise if inflation proves to be more than transitionary. Over 70% of the bonds currently listed in COTZX/CTFAX have a rating of “A” or higher and an effective duration of about 5 years. Interest rates are low and may rise, reducing the returns of bonds, but quality short to intermediate bonds will lose less than stocks.
Sector and Business Cycle Rotation
Key Point: At the time of this writing, Technology Funds are down 6% for the past three months as investors rotate into inflation hedges, value stocks, industrials, materials, infrastructure, and international stocks.
Fidelity provides their summary of sector performance during the business cycle as shown in Table #2. Investors (and massive stimulus) have pushed valuations to extreme levels, particularly in technology which does well when the economy is rebounding or in a mid-cycle stage. There appears to be a rotation into assets that perform better during the late stage of a business cycle such as materials, consumer staples, health care, energy, and utilities. While I include representative funds from most sectors in the Watchlist, I focus attention on the “late stage” funds. There is a large disconnect between the markets and economy, and I believe that while the economy may churn on with the continued stimulus, while high valuations and margin debt ensure there will be high volatility over the next few years. My focus remains on capital preservation and managing risks.
Table #2: Sector Performance During the Business Cycle
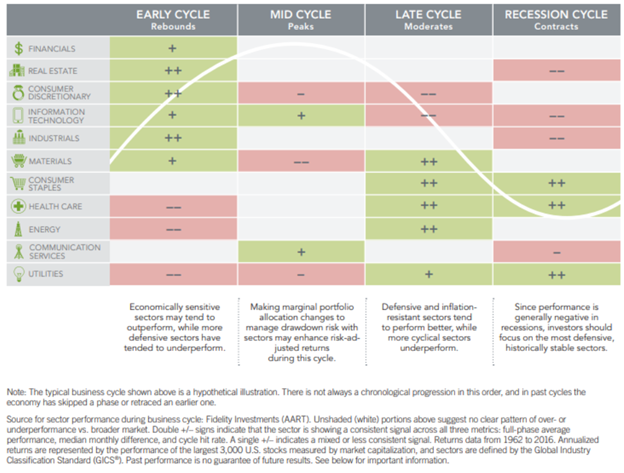
Source: Fidelity
Table #3 shows the performance of sectors over the past twenty years. Consumer Goods (Staples) and Health Care have historically done the best during downturns. Utilities and Materials perform in line with the S&P 500. Technology and Real Estate were influenced by the Housing and Technology Bubbles and performed significantly worse during downturns. The Price to Earnings Ratio (P/E) shows that all sectors are highly valued. Industrials and real estate have come off slow years and now have strong returns year to date. Utilities are having higher returns relative to 2020. Debt to Equity (D/E) gives an indication of which industries may be most affected if interest rates rise. Consumer Goods, Health Care, and Consumer Services have the highest risk adjusted returns (Martin Ratio).
Table #3: Sector Performance – Twenty Years
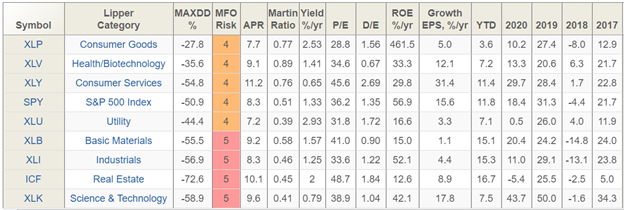
Source: MFO Premium data and screener
Table #4 is my blueprint for asset rotation and allocation following the business cycle. There is no traffic sign shown what stage of the business cycle the economy is in, but momentum provides clues where investors think it is headed.
Table #4: Asset Performance During the Business
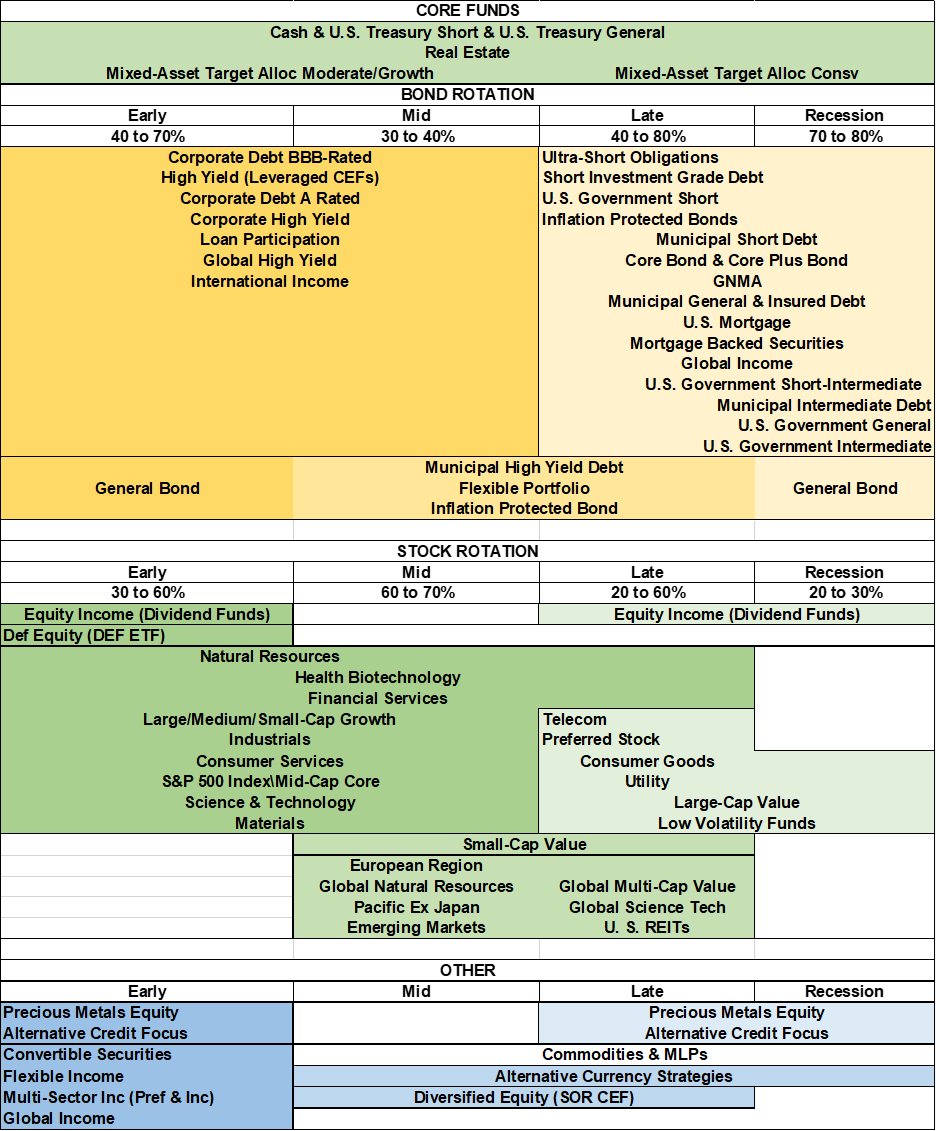
Source: Author
One Stop Shop Mutual Funds with a Tactical Strategy
Key Point: With valuations at extremes, conservative funds for long-term buy-and-hold positions are evaluated with respect to the Tactical Sleeve. I expect these funds to outperform more aggressive funds over the next decade.
Benjamin Graham, Warren Buffett’s mentor, described in The Intelligent Investor that allocations should never be less than 25% to stocks, nor more than 75% based on market conditions. Warren Buffet closed Buffett Partnership in 1969 because of valuations:
However, I just don’t see anything available that gives any reasonable hope of delivering such a good year and I have no desire to grope around, hoping to “get lucky” with other people’s money. I am not attuned to this market environment and I don’t want to spoil a decent record by trying to play a game I don’t understand just so I can go out a hero.
Table #5 shows the One Stop Shop Funds from my article last month which use a tactical strategy and have achieved excellent risk adjusted returns with relatively low drawdowns. My objective nearing retirement is to build a low-risk portfolio that is easy to manage. I look for funds where the fund managers do the heavy lifting. “Week” refers to the week ending May 14th when the S&P 500 lost about 1.3%, intermediate treasuries lost about 0.2%, and gold gained 0.6%. This provides some relative insight into how the One Stop Funds might perform during a downturn. COTZX held up relatively well, as did most of the other funds. FMSDX and JABAX will tend to be more volatile. After researching these funds further, I favor adding PRSIX as a lower-risk conservative fund with a tactical strategy, given that I already own FMSDX and COTZX/CTFAX.
Table #5: One Stop Shop Funds Momentum Metrics (Returns as of May 14th)
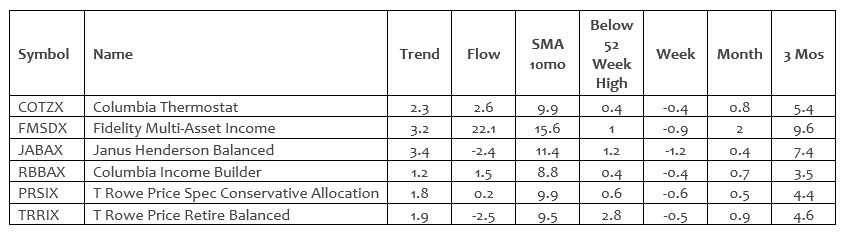
Source: MFO Premium data and screener
Momentum vs Author’s Ranking System
Key Point: Momentum and the Author’s Ranking System are used to identify both long term buy and hold funds as well as funds for the Tactical Sleeve. My view of the economy and market does not change much from month to month, so I only make small adjustments to my portfolios each month.
I built my Ranking System to consist of Long Term Performance using MFO Composite Ratings and Ferguson Metrics for the Lipper Category, Medium Term Performance over three years using Risk Adjusted Returns (Martin Ratio) and volatility (Downside Deviation), Short Term Performance using three-month trends and investment flows, Snapshot information such valuations and yield, and various momentum estimates. The objective is to identify good funds to buy for the long term that are doing well now. Figure #1 shows sector, value, and international fund performance over the past five years. They have underperformed the S&P 500 which will tend to lower them in the Ranking System.
Figure #1: Sector, Value and International Fund Performance – Five Years
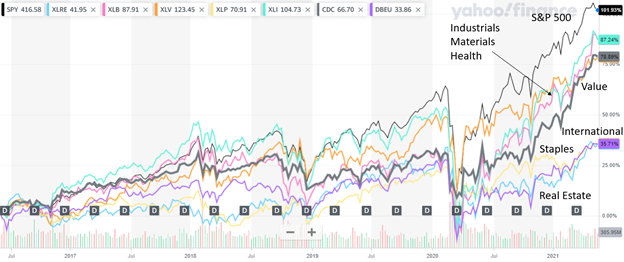
Source: Yahoo Finance
Figure #2 shows these same funds are now outperforming the S&P 500, and momentum will tend to increase them in the Ranking System. These are the types of funds that I look for to own as more tactical investments. They have not performed as well over the past five years, but may be relatively undervalued and starting a trend upwards. The Momentum Indicator consists of a three-month trend combined with the one-month return, money flows, and a combination of algorithms that search for funds that are starting to trend upwards.
Figure #2: Sector, Value, and International Fund Performance – Three Months
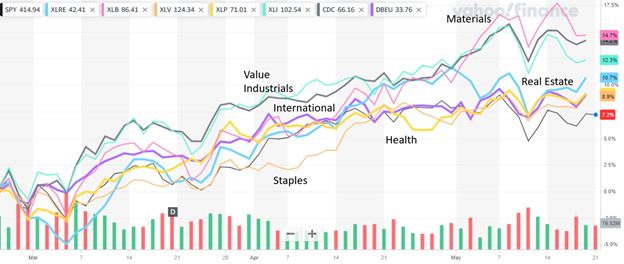
Source: Yahoo Finance
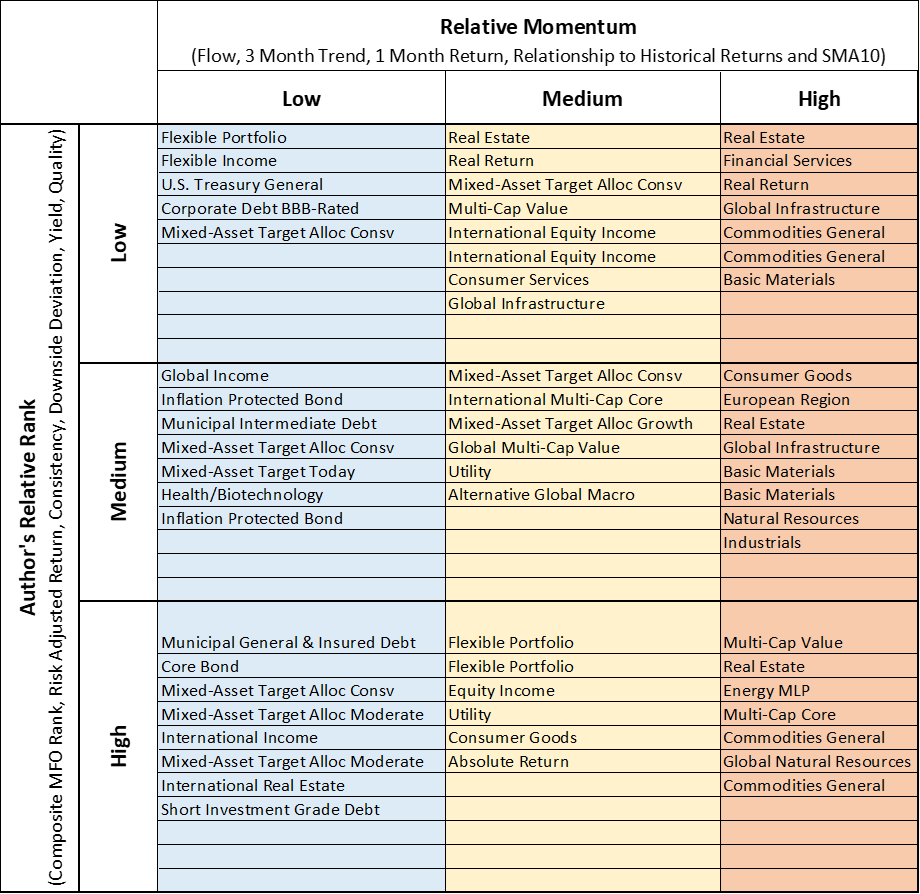
Figure #3 contains the funds in my Watchlist displayed as Author’s Ranking System versus Momentum. For Buy and Hold Funds, I generally like for funds to have a Rank above 70 which means they are in the top 30% of the thousand funds that I track. There are nearly 60 funds in the Watchlist which are divided with about twenty funds in each of low, medium, and high categories of Author’s Rank and Momentum as shown along the axis. The funds in bold are the One Shop Stop Funds that I wrote about in the MFO May newsletter. Funds that may be candidates for “Bottom Fishing” are those with low Rank and high Momentum. Vanguard Commodities (VCMDX) has a low Rank mainly because it is the only fund that does not have a three-year history. The matrix may be used to compare similar funds. For example, last year I purchased the three-year-old Vanguard Global Wellington (VGWAX) to gain international exposure as opposed to other international funds. I have also been adding the more conservative Vanguard Global Wellesley (VGYAX). As I have described over the past year, I also own the high Rank, high momentum VictoryShares US EQ Income Enhanced Volatility Wtd ETF (CDC) and Amplify CWP Enhanced Dividend Income ETF (DIVO). As an inflation hedge, I own Fidelity Strategic Real Return Fund (FSRRX) because it is more diversified and less volatile than commodity funds.
Figure #3: Author’s Rank vs Momentum Source: MFO Premium data and screener
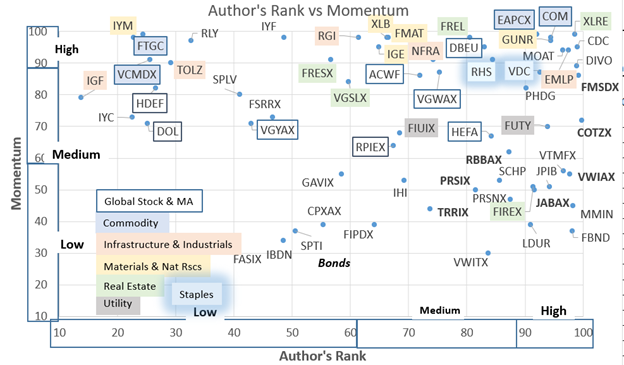
Source: MFO Premium data and screener
Funds will move very slowly along the Author’s Rank because they are based mostly on intermediate and long-term metrics. They will move more quickly along the Momentum axis which is based on one month return, three-month trends, money flows, and momentum algorithms. In general, I expect the bulk of my investments to be buy-and-hold mutual funds in the Medium to High Author’s Rank (>70) boxes with Medium Momentum. I look for Tactical Funds among the exchange traded funds in the Medium and High Momentum Categories and consider the Author’s Rank. A storyline needs to be built around why these Tactical Funds should be in a portfolio. As someone who makes few trades per month, I look for funds starting upward trends. For portfolio adjustments in May, I found value stocks, commodities, natural resources, infrastructure funds, international exposure, and real estate of interest.
A higher-level view of the 59 funds in the Watchlist is shown in Table #6.
Table #6: Lipper Category of Funds in Watch list
Source: Author Using Mutual Fund Observer
Table #7 contains my Tactical View of the funds. The first number is my Ranking System. The second number is the Ulcer Index which measures the length and duration of drawdown over the past three years. Author’s Rank favor’s funds that are less risky than the S&P 500 which has an Ulcer Index of 5.2 for the past three years. The third number is Fund Flows which I include as a Sentiment Indicator. The fourth number is a three-month trend and the final number is a three-month return.
In general, long-term buy and mixed asset mutual funds will move around the medium to high rank and low to medium momentum. The bold funds are the One-Stop Shop Funds that I wrote about last month. The exchange-traded funds are mostly the ones that I look at for tactical assets.
Table #7: Author’s Rank and Momentum Metrics of Funds in Watchlist Source: MFO Premium data and screener
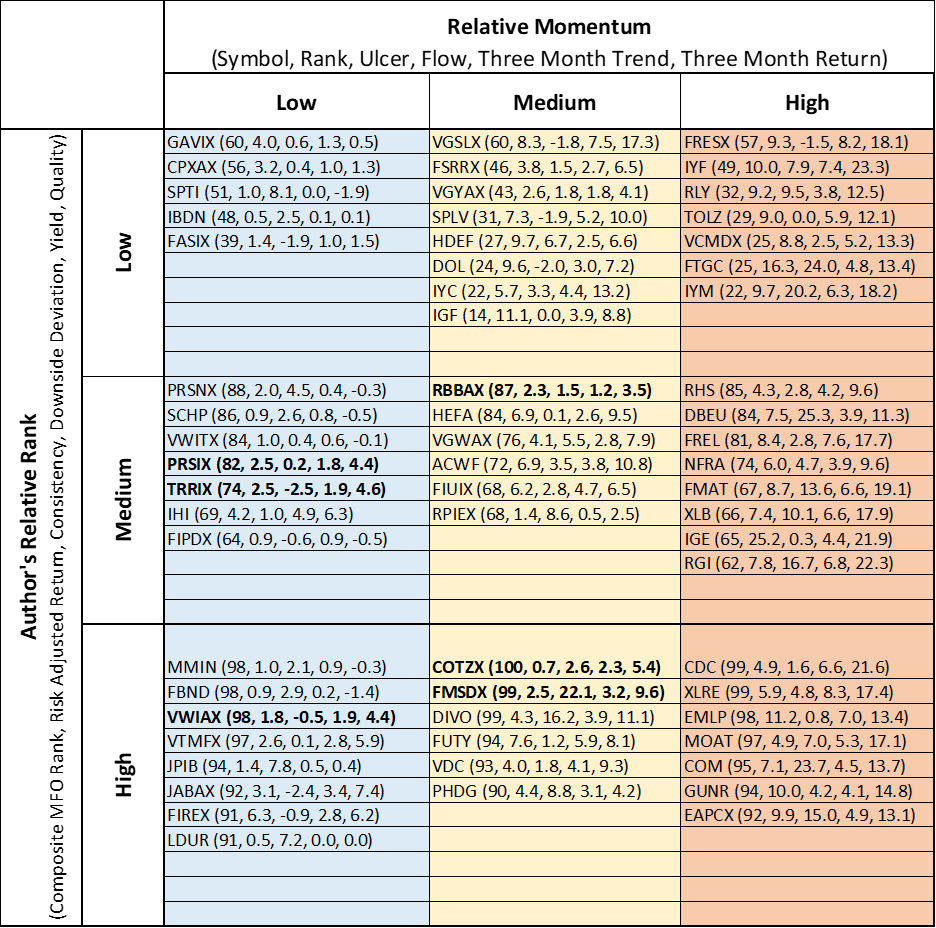
Source: MFO Premium data and screener
Table #8: Fund Names in Watchlist
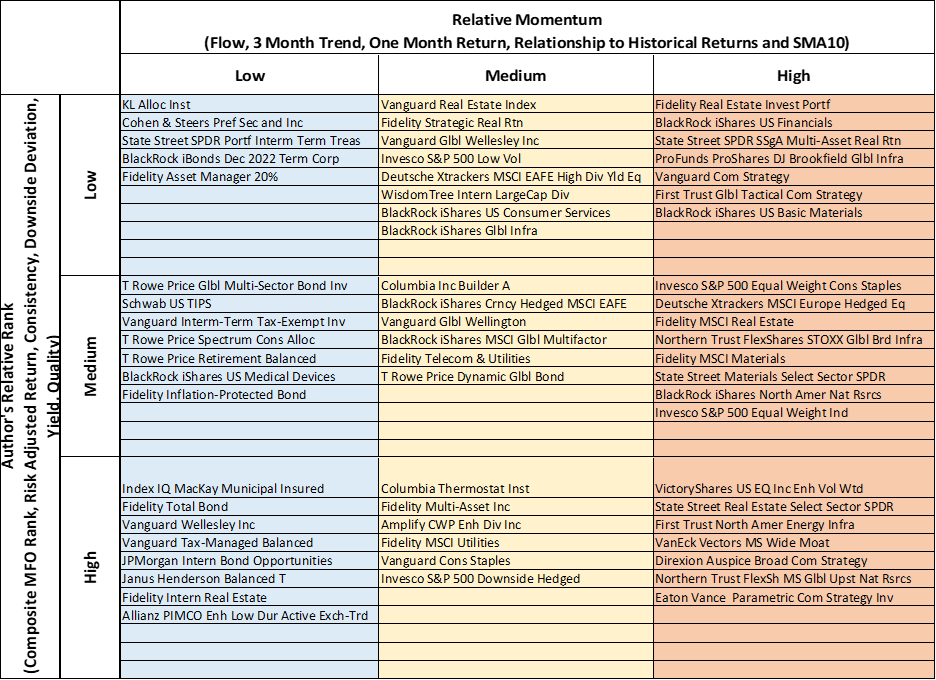
Source: Author
Closing
Over the past year, I have added tactical funds, but it was only last month that I formalized the process. It is important to manage risks. Adding commodities helps protect against the risk of inflation but adds to the risk of drawdowns. To avoid increasing risk in a portfolio, an investor may need to reduce other risky assets. I maintain a diversified sleep at night portfolio with some “Dry Powder” and COTZX/CTFAX, conservative mixed-asset funds (VSCGX, VWIAX), international mixed-asset funds, multi-strategy TMSRX, market neutral ARBIX, multi-asset fund FMSDX, and bonds, and a Tactical Sleeve which contains real estate, real return, commodities, global infrastructure, gold, and value funds.
Best Wishes and Stay Safe!