


The Federal Reserve is raising rates to slow the economy, reduce inflation, and reduce bond purchases (Quantitative Tightening). The International Monetary Fund and World Bank are lowering forecasts of global growth, and the Russian invasion of Ukraine is further disrupting supply chains and raising geopolitical tensions. I am at my neutral allocation of 50% to stocks but have shifted away from the most volatile funds and toward more defensive funds that do well during the late stage of the business cycle and higher inflation. This article describes five funds that I have added to my personal portfolios to provide some protection during these uncertain times.
The war in Ukraine is set to cause the “largest commodity shock” since the 1970s, the World Bank has warned… A new forecast said the disruption caused by the conflict would contribute to huge price rises for goods ranging from natural gas to wheat and cotton.
(Jonathan Josephs, “Ukraine war to cause biggest price shock in 50 years – World Bank“, BBC, 4/27/2022)
I set my retirement date in June after spending 35 years in commodity production, including coal, sulfur, copper, and mostly gold. My first exposure to commodities was in the 1970s when my grandfather, a farmer and rancher, hedged prices against bad weather and price declines. I have followed the impact of globalization on the prices of commodities with more than a casual interest. I have not invested significantly in commodities until recently because globalization has tended to reduce prices until the combined effect of COVID and the Russian invasion of Ukraine disrupted supply chains.
Figure #1 shows that unemployment (green line) is now at the lowest level in sixty years, and labor costs are rising. It also shows that imports of goods (red line) now make up 13 percent of gross domestic product, up from less than 5 percent in the 1960s. Commodity prices are as high as they were in the late 1970s.
Figure #1: Inflation, Unemployment Rate, and Imports of Goods and Services
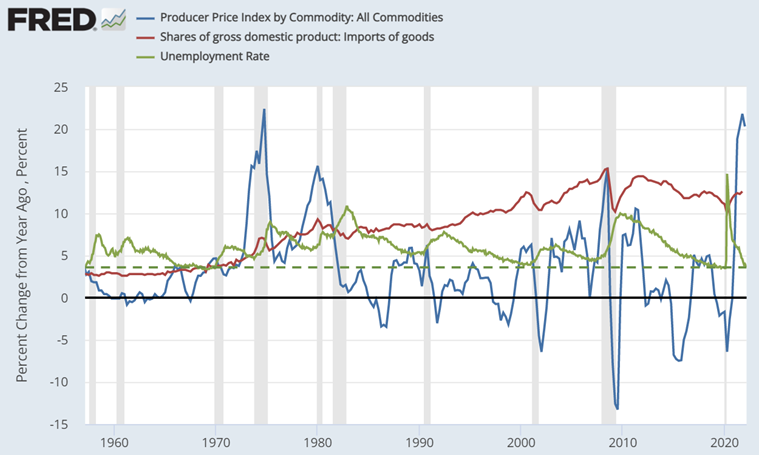
Source: St. Louis Federal Reserve (FRED)
The 5-Year, 5-Year Forward Inflation Expectation Rate, and the 5-Year Breakeven Inflation Rate hover around 3%. Inflation will likely gradually decline slowly from the current 8.5% because it is a global issue that is partly out of the control of the Federal Reserve. See Figure #2.
Figure #2: Global Price of Commodities
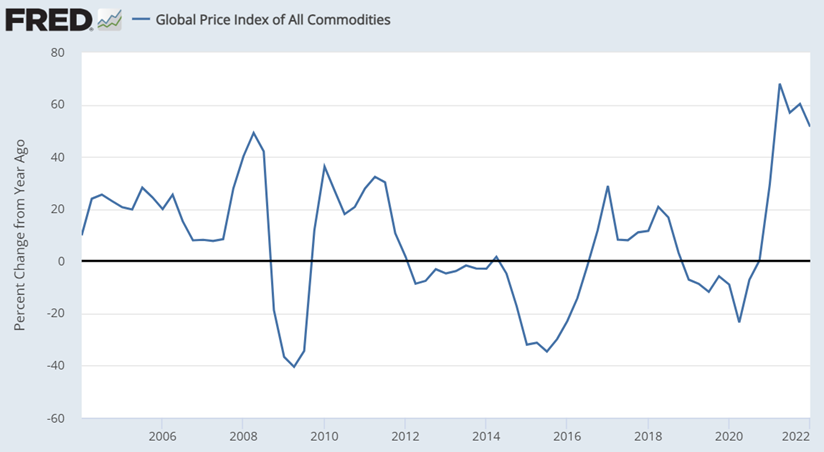
Source: St. Louis Federal Reserve (FRED)
1. Slowing Growth and Rising Inflation
During a normal business cycle, economic growth slows in the late stage as inflation rises. This is because the labor approaches full employment, increasing labor cost pressures, and production is near capacity, so incremental costs to increase production rise. The persistent case of slower growth and higher inflation is known as stagflation. Are we there yet? COVID-induced supply shocks by themselves may not cause stagflation, but combined with geopolitical risks and some extent of deglobalization may.
Dr. Nouriel Roubini describes the current situation of slowing growth and higher inflation in “The Gathering Stagflationary Storm.” Nouriel Roubini, Professor Emeritus of Economics at New York University’s Stern School of Business, is Chief Economist at Atlas Capital Team, CEO of Roubini Macro Associates, and Co-Founder of TheBoomBust.com.
The new reality with which many advanced economies and emerging markets must reckon is higher inflation and slowing economic growth. And a big reason for the current bout of stagflation is a series of negative aggregate supply shocks that have curtailed production and increased costs.
This should come as no surprise. The COVID-19 pandemic forced many sectors to lock down, disrupted global supply chains, and produced an apparently persistent reduction in labor supply, especially in the United States. Then came Russia’s invasion of Ukraine, which has driven up the price of energy, industrial metals, food, and fertilizers. And now, China has ordered draconian COVID-19 lockdowns in major economic hubs such as Shanghai, causing additional supply-chain disruptions and transport bottlenecks.
ESI Analytics Limited makes the point that there is still room to grow in “Macro Update: This Is A Correction And Not A Sustained Bear Market” and that a recession is not imminent.
- Historically reliable macro indicators signal growth for the U.S. economy.
- Our leading indicators weakened slightly during the past month but do not signal an imminent recession yet.
- Sustained bear markets in equities unfolded in recessions only.
- The S&P 500 remains on target for 5000-5200.
I reconcile the two views as a recession in late 2023 is becoming a higher risk, and inflation will be higher for longer than many investors anticipate. Below is my Investment Model, which maximizes returns over the past 27 years by adjusting allocations to stocks between 35% and 65%. The model is based on 27 indicators consisting of over one hundred sub-indicators. The solid blue line shows the model’s current allocation of 65%; however, I am at my neutral allocation of 50%. If the investment environment continues to deteriorate, then I will look for opportunities to reduce allocations to stock to a more defensive 35%. The dashed blue line shows the investment environment is strong but deteriorating rapidly. The red line reveals that not many of the indicators are negative, so the weakness is not broad-based. Anxiety over rising rates, inflation, reducing bond purchases (quantitative tightening), and the Russian invasion of Ukraine have greatly increased volatility.
Figure #3: Author’s Investment Model
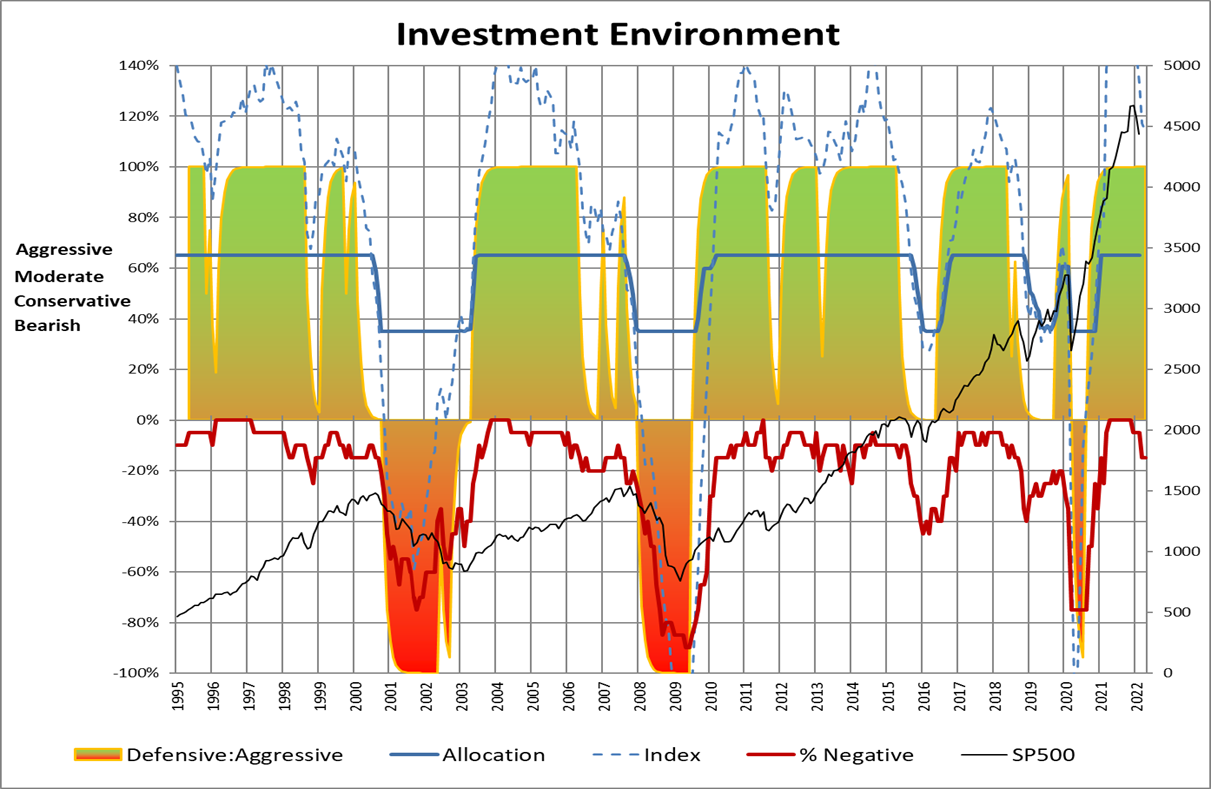
Source: Author
Commodities and real assets provide some of the best protection against inflation, but as current performance proves, they can be volatile. The table below shows the performance of commodities, natural resources, and some of the defensive sectors compared to the S&P 500 over the past twenty-five years covering globalization and low inflation. With the exception of gold and commodities, returns are comparable to the S&P 500, but correlations are low. They perform differently over different stages of the business cycle.
Table #1: Twenty Five Year Performance of Defensive Sectors and Commodities
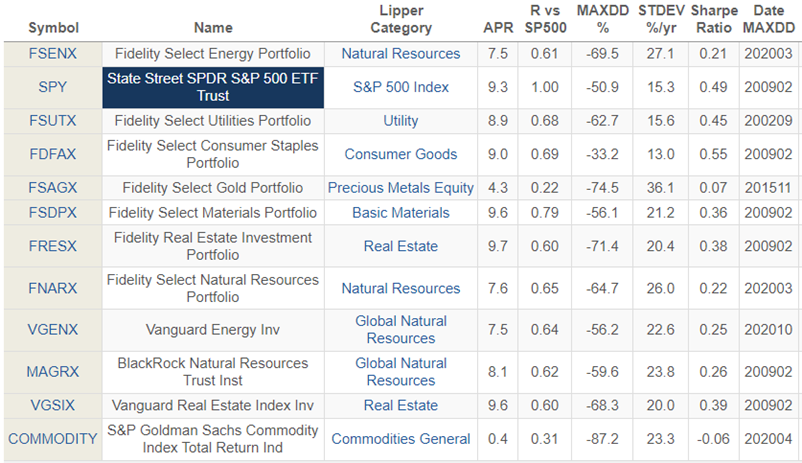
Source: Mutual Fund Observer
2. Rising Inflation and Normalization
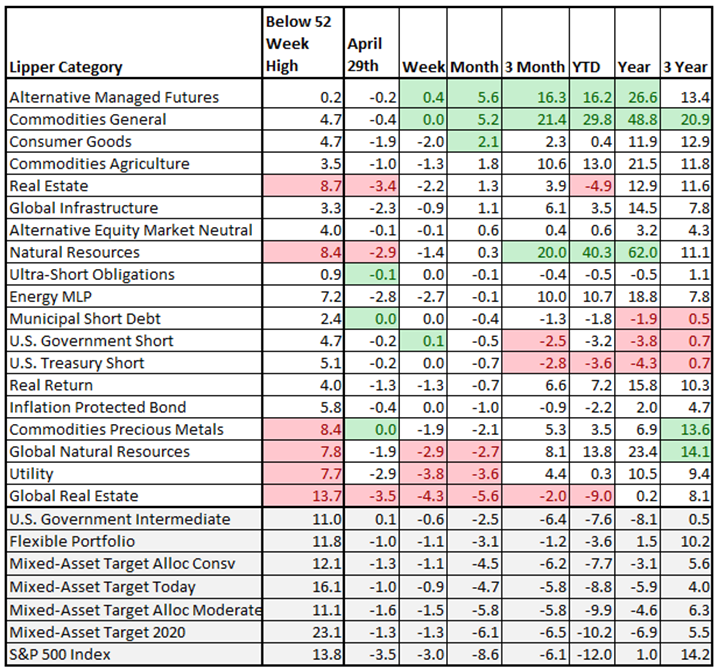
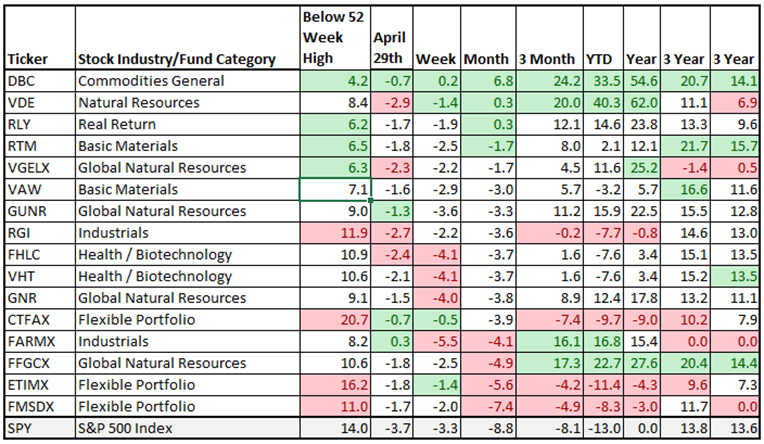
Table #2 contains the average short-term performance of some of the better performing Lipper Categories that I track. The upper section contains categories of funds that have been doing well, and the lower section contains base case funds. Typical mixed-asset funds are down 7 to 10% year to date as of April 29th, while the S&P 500 is down 12%. Intermediate bond funds are down around 8% as well. Some of the funds that have done well year to date tend to be more volatile, as shown for the week ending April 29th.
Commodities and Natural Resources have performed best year to date, but volatility increased recently, and that they are near the 52-week high suggests that they may be overbought in the short term. Contrast this with bonds and mixed asset funds that suffered from the bond rout. Bonds have not provided the usual protection during market downturns as interest rates rise. Funds in the Flexible Portfolio category provide some protection.
Table #2: Best Performing Lipper Categories – YTD
Source: Created by the Author Using Morningstar
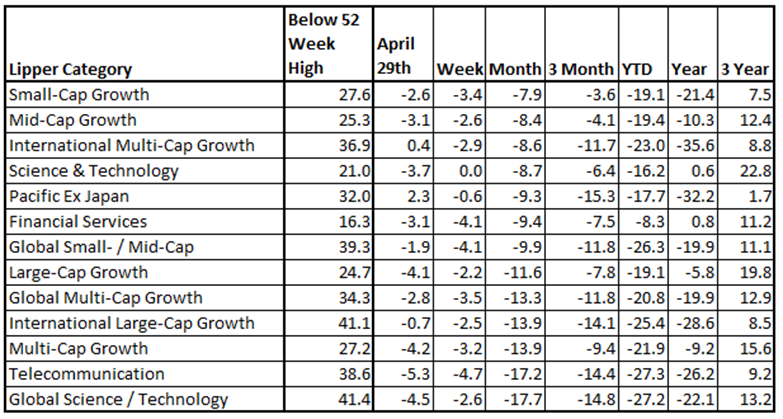
The worst performing categories below are down about 21% YTD. This year investors have shed the growth and technology stocks for money market and defensive funds.
Table #3: Worst Performing Lipper Categories – YTD
Source: Created by the Author Using Morningstar
3. Defensive and Inflation Protection Funds
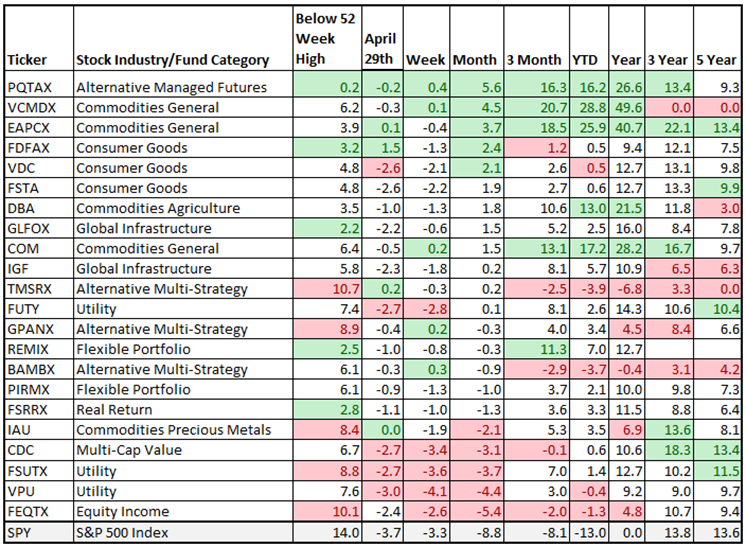
Table #4 shows some of the better-performing funds that I track, sorted from highest one month return to lowest, with the S&P 500 shown as a base case for comparison. This year, I have added or increased allocations in moderate amounts to PQTAX, GLFOX, GPANX, REMIX, PIRMX/PZRMX, and FSRRX, while already owning VCMDX, EAPCX, FSUTX, and TMSRX. To reduce volatility further, I have increased cash by a modest amount.
Table #4: Top Performing, Lower Risk Funds for Defense and Inflation Protection
Source: Created by the Author Using Morningstar
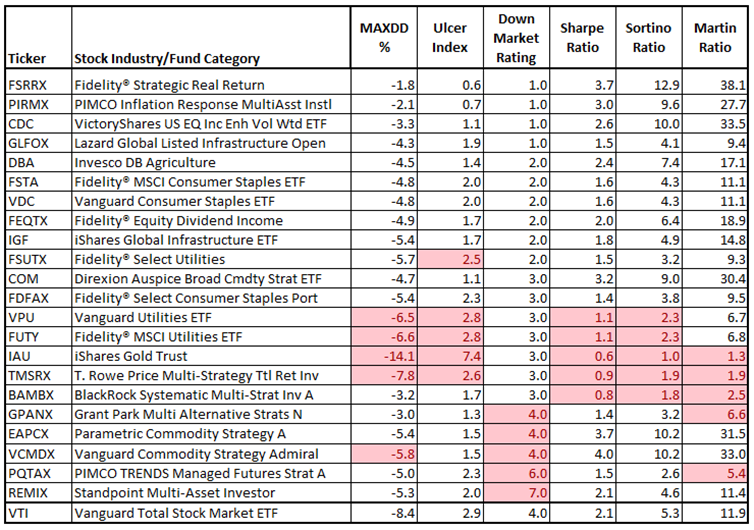
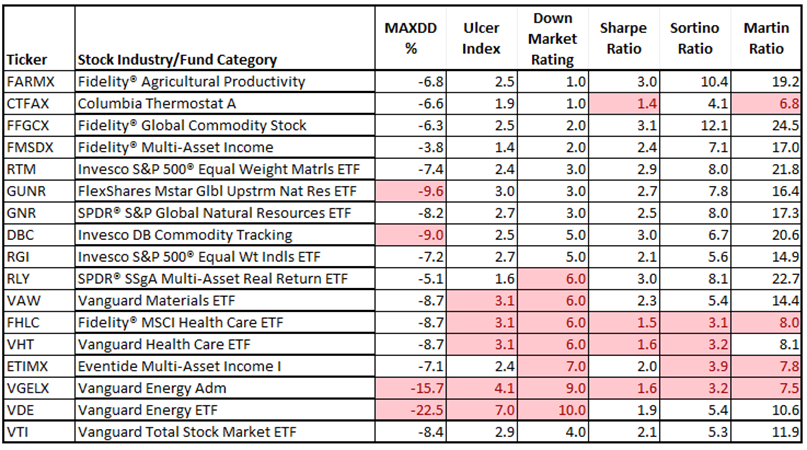
Table #5 shows the risk and risk-adjusted returns from Mutual Fund Observer for these funds for the past two years. The red shaded cells reflect the riskier funds or those with lower risk-adjusted returns. In general, they have been less volatile than the S&P 500 or the Vanguard Total Stock Market ETF (VTI).
Table #5: MFO Metrics – Two Years
Source: Mutual Fund Observer
Figure #4 contains an example fund from different Lipper Categories during the COVID recession. I like the low volatility of Grant Park Multi Alternative Strategies (GPANX), as seen in the dark green line, and the quick recovery of consumer staples (black line).
Figure #4: Fund Performance During COVID Recession
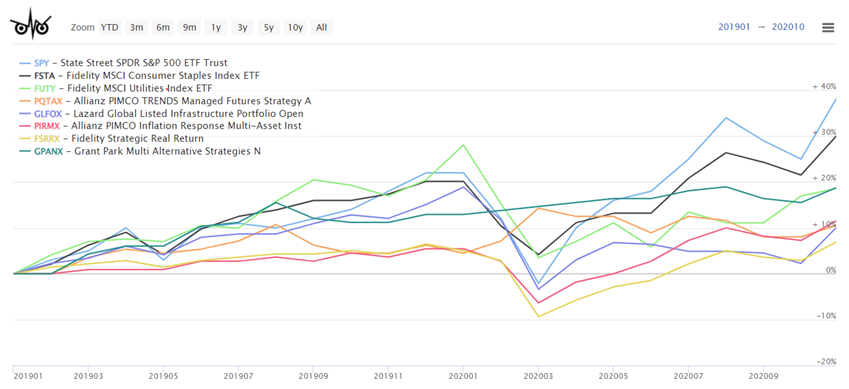
Source: Mutual Fund Observer
Table #6 shows some of the more volatile funds along with others that I have recently written about. I own modest amounts of VGELX/VGENX, FARMX, and FFGCX to protect against inflation and have reduced allocations to some of the more volatile funds such as CTFAX/COTZX and FMSDX.
Table #6: Top Performing, Higher Risk Funds for Defense and Inflation Protection
Source: Created by the Author Using Morningstar
The risk and risk-adjusted returns from Mutual Fund Observer are shown for these funds for the past two years. The red shaded cells reflect the riskier funds or those with lower risk-adjusted returns.
Table #7: MFO Metrics – Two Years
Source: Mutual Fund Observer
4. Fund Strategies and Performance
I use the bucket approach to spread risk in selecting funds for protecting against inflation. I don’t invest more than 5% in any single non-traditional, derivative-based fund. I added or increased allocations to each of the following five funds this year. They have exhibited low to moderate risk and performed well in this volatile market.
Inflation Protection and Real Return
In general, short-duration, inflation-protected bonds have done relatively well with the lowest volatility, followed by real return funds. I invested in the Vanguard Short-Term Inflation Protected Bond Fund (VTAPX). For the MFO October 2021 newsletter, I wrote Comparing Fidelity Strategic and Multi-Asset Income Funds (FADMX, FMSDX, FSRRX). Fidelity Strategic Real Return (FSRRX) is one of my larger holdings. As the markets have become more choppy and inflation increased, I shifted some allocation from Fidelity Advisor Multi-Asset Income (FMSDX/FAYZX) to Fidelity Strategic Real Return (FSRRX). I have also added Allianz PIMCO Inflation Response Multi-Asset (PIRMX/PZRMX), which is categorized as a Flexible Portfolio.
The investment strategy of FSRRX is:
Allocating the fund’s assets among four general investment categories, using a neutral mix of approximately 25% inflation-protected debt securities, 25% floating-rate loans, 30% commodity-linked derivative instruments and related investments, and 20% REITs and other real estate-related investments. Investing in domestic and foreign issuers. Analyzing a security’s structural features and current pricing, its issuer’s potential for success, and the credit, currency, and economic risks of the security and its issuer to select investments. Using fundamental analysis of factors such as each issuer’s financial condition and industry position, as well as market and economic conditions, to select investments…
The investment strategy of PIRMX is:
The fund invests in a combination of Fixed Income Instruments of varying maturities, equity securities, affiliated and unaffiliated investment companies, which may or may not be registered under the Investment Company Act of 1940, as amended (the “1940 Act”), forwards and derivatives, such as options, futures contracts or swap agreements, of various asset classes in seeking to mitigate the negative effects of inflation. It may invest up to 25% of its total assets in equity-related investments.
Table #8 contains the performance of a short-term inflation-protected bond fund, FSRRX, and PIRMX/PZRMX, along with REMIX, which will be described later.
Table #8: MFO Metrics – Inflation Protection and Real Return – Two Years
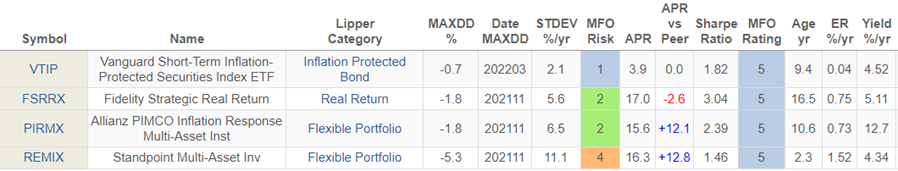
Source: Mutual Fund Observer
Grant Park Multi Alternative Strategies (GPANX/GPAIX)
I have followed Grant Park Multi Alternative Strategies (GPANX/GPAIX) as a potential “All Weather” fund for a few years. I added it to help reduce expected higher volatility over the next few years.
I wrote Alternative and Global Funds during a Global Recession for the MFO September newsletter covering T. Rowe Price Multi-Strategy Total Return (TMSRX) and Grant Park Multi Alternative Strategies (GPANX/GPAIX). Grant Park Multi Alternative Strategies (GPANX/GPAIX) has returned 6% over the past eight years with a maximum drawdown of 14%. During the normalization period from December 2021 through March 2022, the average Alternative Managed Futures Fund returned -0.6%, while the Grant Park Multi Alternative Strategies (GPANX/GPAIX) returned over 3.9%, and during the three month COVID bear market, GPANX/GPAIX returned over 1.6%. During the current normalization period, GPANX outperformed both the T. Rowe Price Multi-Strategy Total Return (TMSRX) and the BlackRock Systematic Multi-Strategy (BAMBX) funds.
The investment strategy of GPANX/GPAIX is:
The fund seeks to achieve its investment objectives by allocating its assets among four independent, underlying strategies. Each strategy seeks to identify profitable opportunities across multiple liquid foreign and domestic markets. The fund seeks to achieve its investment objective by implementing aggressive diversification across these markets, coupled with risk management and position hedging strategies, which allows the fund to seek positive returns while seeking to protect it from unnecessary market risk exposure.
Table #9: Alternative Multi-Strategy Funds – Eight Years
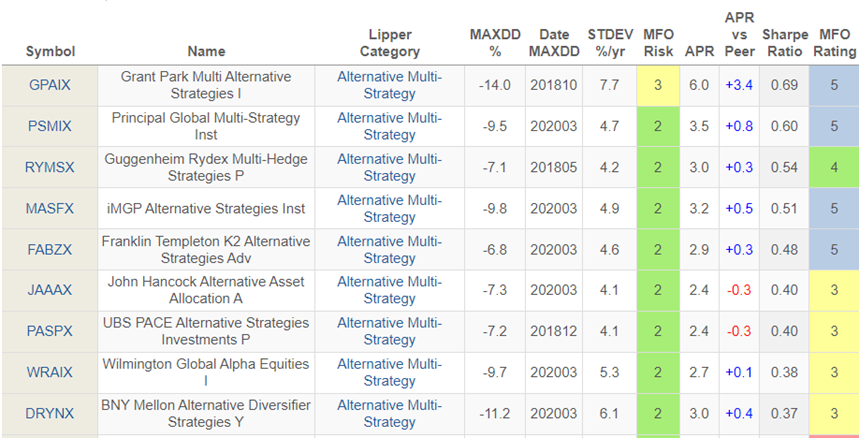
Source: Mutual Fund Observer
Table #10: Grant Park Multi Alternative Strategies (GPANX/GPAIX)
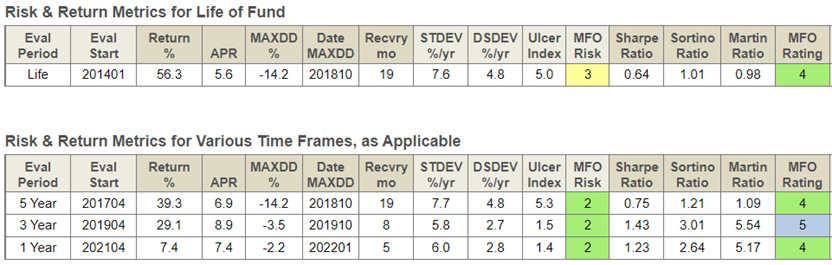
Source: Mutual Fund Observer
Lazard Global Listed Infrastructure Portfolio (GLFOX)
To be honest, what attracted me to Lazard Global Listed Infrastructure Portfolio (GLFOX) was that it was in my employer-sponsored savings plan and doing well. I then researched other infrastructure funds and liked GLFOX as a good long-term performer. Lazard Global Listed Infrastructure Portfolio (GLFOX) is a 12-year-old fund with $7.5B in assets under management and fees of 1.23%. The 12-month trailing yield is 5.0%.
The investment strategy of GLFOX is:
The fund invests primarily in equity securities, principally common stocks, of infrastructure companies and concentrates its investments in industries represented by infrastructure companies. It invests at least 80% of its assets in equity securities of infrastructure companies, which consist of utilities, pipelines, toll roads, airports, railroads, ports, telecommunications, and other infrastructure companies, with securities listed on a national or other recognized securities exchange.
Table #11: MFO Metrics – Lazard Global Listed Infrastructure Portfolio (GLFOX)
Source: Mutual Fund Observer
Allianz PIMCO TRENDS Managed Futures Strategy Fund (PQTAX)
David Snowball pointed out the dismal record of managed futures funds in the June 2018 article, “If You Were A Manager, You’d Be Running A Managed Futures Fund.” It is a good cautionary note. During the normalization period from December 2021 through March 2022, the average Alternative Managed Futures Fund returned 8%, while the Allianz PIMCO TRENDS Managed Futures Strategy Fund (PQTAX/PQTIX) returned over 11%, and during the three month COVID bear market, PQTIX returned over 7%. Professor Snowball’s advice is:
Our recommendations for fund investors remain the same: make your plans before panic strikes, work backward from an understanding of the risks you face and the extent of losses you can bear, build an asset allocation that creates a margin of safety for you and your family and execute the plan with experienced managers who are shielding you from an unjustified risk now in pursuit of exceptional returns in the future.
The investment strategy of PQTAX is:
The fund seeks to achieve its investment objective by pursuing a quantitative trading strategy intended to capture the persistence of price trends (up and/or down) observed in global financial markets and commodities. It will invest under normal circumstances in derivative instruments linked to interest rates, currencies, mortgages, credit, commodities (including individual commodities and commodity indices), equity indices, and volatility-related instruments.
The Allianz PIMCO TRENDS Managed Futures Strategy Fund (PQTAX/PQTIX) is one of the better Alternative Managed Future funds with an MFO Risk of Moderate (3). It is classified as a Great Owl fund. While it has done well for the past eight years, its recent performance is at least partly related to the strong performance of commodities.
Table #12: Alternative Managed Futures – Eight Year Performance
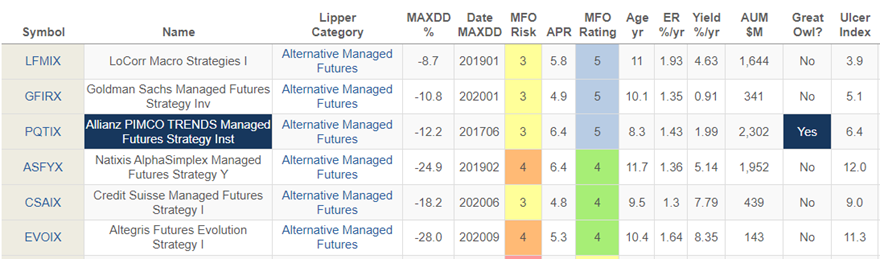
Source: Mutual Fund Observer
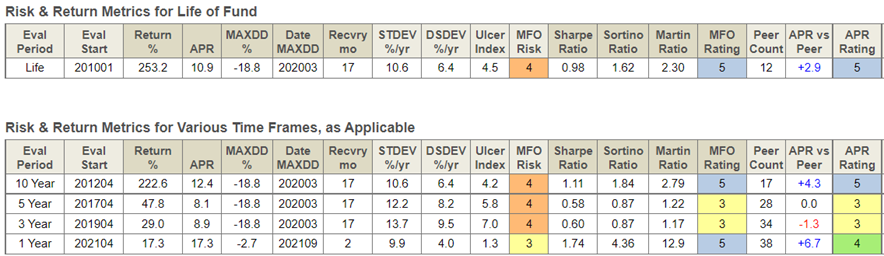
Table #13: MFO Metrics – Allianz PIMCO TRENDS Managed Futures Strategy Fund
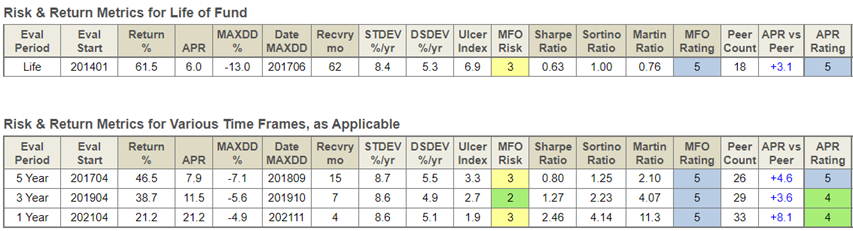
Source: Mutual Fund Observer
Standpoint Multi-Asset Investor (REMIX)
Professor Snowball wrote Standpoint Multi-Asset Fund: Forcing Me to Reconsider, and I purchased a small amount to test the water. It immediately lost 5%. I held on and later added to the position. Standpoint Multi-Asset Investor (REMIX) is classified as a Flexible Portfolio and invests in equities, fixed income, commodities, and derivatives. The fund is two years old and has $276M in assets under management. During the normalization period from December 2021 through March 2022, the Standpoint Multi-Asset Investor (REMIX) returned over 9%. It has had an MFO rank of Moderate Risk (3) for the past two years.
The investment strategy of REMIX is:
The Adviser pursues these returns by allocating the funds assets using an “All-Weather” strategy. All Weather Strategy: The All-Weather strategy is an asset allocation methodology that diversifies across geographic regions, asset classes, and investment styles. The strategy holds long positions in equity ETFs such that exposures resemble those of a global market-cap weighted index of developed markets.
Table #14: MFO Metrics – Standpoint Multi-Asset Investor (REMIX)
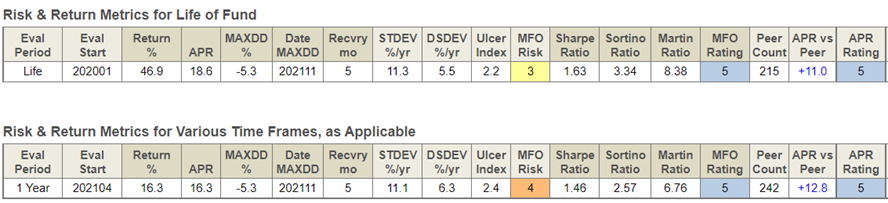
Source: Mutual Fund Observer
Closing
During uncertain times, I like to look at the performance of funds in a shorter time period as a possible window into how they will perform during a major correction. I can then make adjustments at my leisure. On Friday, April 29th, the S&P 500 fell 3.6%. I use the bucket approach with the safest bucket containing living expenses, taking on more risk in Traditional IRAs where taxes have yet to be paid and concentrating most risk in Roth IRAs where taxes have already been paid. I am in my comfort zone. Figure #5 shows the funds that I have been adding or increasing allocations to.
Figure #5: Fund Performance – Two Years
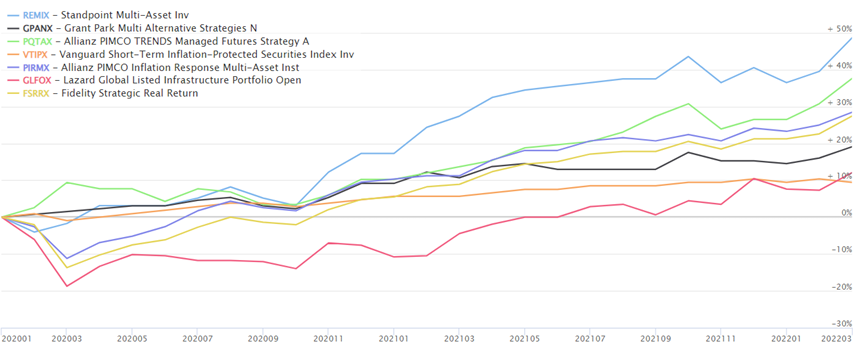
Source: Mutual Fund Observer
I have become decidedly more defensive but not bearish. Utilities have become more volatile, and I have reduced holdings a bit. For May, I am considering exchanging more of a utility fund for one of the above. Time will tell, but at this point, I favor adding to PQTAX.
Best wishes during these uncertain times.