Monthly Archives: February 2022

February 1, 2022

By David Snowball

Dear friends,

Welcome to February. It’s a month frequently associated with the color red – as in Valentine’s Day hearts, chocolate boxes, and scandalous lingerie – but investors have started the year seeing a different kind of red.

Here’s a compendium of every Vanguard index mutual fund (one share class for each) but appearances by a handful of special guests. In one month, investors had YTD returns of …

Vanguard Index unless otherwise specified   January 2022
Grayscale Stellar Lumens Trust Wacky crypto -60.9%
Grayscale Ethereum Trust Ether -44.3%
De-SPAC ETF SPAC -33.0%
Breakwave Dry Bulk Shipping Commodity -30.5%
ARKK Innovation “Disruptive” stocks -29.8%
Grayscale Bitcoin Trust Bitcoin -29.6%
Small Cap Growth Small Growth -18.42%
Extended Market Mid-Cap Growth -15.43%
Growth Large Growth -15.24%
Real Estate Real Estate -12.28%
Mid Cap Mid-Cap Blend -12.07%
Small Cap Small Blend -12.06%
FTSE Social Index Large Blend -11.45%
Total Stock Market Large Blend -10.24%
Global X Gold Explorers Precious metals -9.7%
500 Index Large Blend -9.17%
FTSE All-World ex-US Small Foreign Small/Mid Blend -8.55%
Pacific Stock Diversified Pacific/Asia -7.44%
Small Cap Value Small Value -7.39%
Developed Markets Foreign Large Blend -6.08%
European Stock Europe Stock -5.63%
Total Intl Stock Foreign Large Blend -5.13%
Long-Term Corporate Long-Term Bond -4.97%
Long-Term Bond Long-Term Bond -4.21%
Extended Duration Long Government -3.99%
Value Large Value -3.08%
Emerging Markets Gov’t Bond Emerging Markets Bond -3.04%
Interm-Term Corporate Bond Corporate Bond -2.71%
Emerging Markets Stock Diversified EM Stock -2.43%
Intermediate Bond Intermediate Core -2.32%
Total Bond Market Intermediate Core -2.20%
Short-Term Corporate Bond Short Term Bd -1.26%
Short Term Bond Short Term Bond -1.07%
Total International Bond World Bond – USD Hedged -0.94%

All returns are YTD through 27 January, 2020, per Morningstar.com

That’s not the scariest of the January returns. For those, you need to look at funds and ETFs that have employed leverage: “ultra-bear” and “ultra-bull” funds, some of which have one-month losses of 80-95%. But since you surely didn’t get within a mile of those, we’ll look elsewhere.

What to make of it all? Hmmm …

  1. You cannot buy past returns, and it’s toxic to try.
    The main reason anyone would be interested in those first half dozen funds is that they’ve made crazy money in the past. Breakwave Dry Bulk Shipping made 282% last year, while the Ethereum Trust booked 109%. The Bitcoin Trust returned over 1000% in 2017 and over 100% in two of the past three years. ARKK gained 159% just two short years ago … but the panting crowds who rushed in one year ago are sitting on losses of 43%.
  1. If you care about how stocks have done in January, you really should not be invested in stocks.
    Losing money is not an aberration. It’s a design feature. The only way to earn returns greater than those offered by a risk-free asset is to take risks. In investing, the risk is that the thing you bought with the expectation that it would go up, went down. When we looked at the record of Vanguard’s ten largest equity index funds, we found that they have had a worst-case period in which investors were underwater, on average, for 78 months before their portfolios recovered. Depending on the fund, they fell for between 16 and 30 months before hitting bottom and beginning their rebound.

    As Devesh points out in his January 21 YouTube video on risk and asset allocation, “If you’re going to be invested, every once in a while you’re going to lose money. That is just part of the investment landscape. The only way to not lose money is never be invested.”

  1. You need to balance your concern about the past five weeks with the insane gains you’ve been granted over the past five years.
    And those returns factor in the losses in January. Even after a wretched month, long-term growth investors have pocketed crazy-good returns, far above the 10% that’s viewed as the US stock market’s long-term average.
  1. Asset allocation matters.
    Fidelity’s series of Asset Manager funds are functionally identical, except for the amount of exposure to the stock market that they offer you. In each case, the number in the fund’s name signals the percentage of the portfolio invested in stocks.

    Let’s look at stock exposure (column 1), short-term and medium-term returns (columns 2, 3, and 4), and medium-term volatility (measured by the five-year record from 2017-2021).

    Fidelity Asset Manager YTD return 3-year return 5-year return Max drawdown Standard deviation Bear market deviation
    20% -3.0% 6.0% 4.8% -6.2 4.4 2.8
    30% -3.9% 7.8% 6.2% -8.3 5.9 3.7
    40% -4.8% 9.3% 7.3% -10.2 7.3 4.7
    50% -5.6% 10.6% 8.3% -12.2 8.8 5.6
    60% -6.4% 11.9% 9.2% -14.2 10.3 6.6
    70% -7.2% 13.1% 10.2% -16.2 11.7 7.5
    85% -8.4% 14.9% 11.7% -19 13.9 8.9

    What do you see? Any equity exposure – even as little as 20% – means that you’re going to see red, at least some red, at least some of the time. As equity exposure rises, so do longer-term returns … and the prospects for striking short-term losses and ongoing volatility.

What should you do about it?

Investing is, by its nature, a long-term activity. So …

Step One: you should review your long-term plans. How much risk are you taking? Is it appropriate to your long-term needs and tolerance? Have you chosen appropriate funds or ETFs to implement the plan? Are you investing steadily? If not, change for the better. If so, proceed to Step Two.

Step Two: get on with life. Disconnect from the noise. Read a book. Apple: A Global History (2011) points out that for most of human history, apples were not eaten, they were consumed as cider, and until the 19th century, all cider was “hard cider.” Buy your beloved some chocolates (sugar-free or not, depending). If you screw that up, you need to sing them a love song. (Just a warning.)  Jot down the three things that you’re most grateful for today. (Chip, mostly, but also the fact that we get to bring you three new voices this issue, and the spring semester starts this week, and nearly half of the kids in my Advertising and Consumer Culture course are international students, which should make for really cool discussions). Make a difference in your hometown. (One of my former students is running for Congress. Bless you, Angie, and may god have mercy on your sanity.) Go shovel (or sweep) a neighbor’s walk. Say something nice to the next person you meet. Make a rich soup.

Speaking of new voices!

As part of the plan, other folks have begun stepping up as Snowball was stepping back.

Devesh Shah

Hi, I’m Devesh Shah, and I’m pleased to meet you. As a professional, I was a co-inventor of the CBOE VIX Volatility Index, an equities and derivatives trader, and a Partner at Goldman Sachs. 

My passions now mostly involve writing, teaching about investments, practicing yoga, playing the piano, and volunteering with a non-profit, Sponsors for Educational Opportunities (SEO), that opens up career and college pathways for underprivileged students of color. I am an alum of SEO. My hope for the months ahead is to share a few things I have learnt about investing.

Mark Freeland

Hi, I’m Mark Freeland, and if you read the MFO Discussion Board (as you should), you’ll know me as msf. I, too, am a personal investor who learned about investing over time, following the adage that if you want something done right, do it yourself. At least if one can. Mathematical, scientific, software background, so analytics come pretty naturally to me. I fell into a CFO role at a four-person startup a few years ago; I think because I was the only one who could open a spreadsheet. Prior to that, I’d been on employee committees (again in small companies) recommending 401k investment options.

Bill Moore

The Shadow here! Like Mark, I’m a long-time member of the MFO community. I’ve started over 2300 discussion threads, most focusing on developments in the fund industry. I am a personal investor who was introduced to mutual funds when I was young to fund my college education.  As I have grown older, I have expanded my mutual fund holdings to a point where I probably have too many; however, this year, they all did extremely well due to the overall performance of the market.  I work in the financial industry regulating the consumer finance industry in my state. My hope for the months ahead is that I might share word of developments in the finance industry – the comings and goings, launches and liquidations, the fun and the follies – with you.

Lynn Bolin

As most MFO readers now, I’m Lynn. I’m not really a “new voice” at MFO since I’ve been writing MFO essays that link economic conditions and our changing life needs with portfolio construction since September 2019. I spent several years developing an investment model, and in 2016 sent an article to Seeking Alpha out of curiosity to see if they would be interested in publishing one.  A reader later recommended that I should check out MFO, started incorporating MFO Premium data in my articles, and soon became a contributor at MFO. I really enjoy the format of MFO and learn so much on the discussion board. My hope for the months ahead is to retire and spend more time with family. My wife, Anna, has major landscaping plans for me, which I greatly enjoy, along with an occasional barbeque. High on my bucket list is to visit Yellowstone National Park and explore my new retirement home in Colorado. I have been an inactive member of AAII for decades, but greatly enjoyed their investing conferences. I look forward to greater opportunities to expand my investing knowledge. Retiring will give me more time to explore the great tools available at MFO and to participate in the discussion board more actively.

Contributing, though a bit different, is YogiBearBull, who, like Lynn and MFO Premium’s Charles Boccadoro, was an engineer. Yogi has a broad interest in personal finance, maintains his own personal finance site, and frequently publishes cool and thoughtful summaries (most recently of Barron’s Mutual Fund Quarterly) on the discussion board. We’ll share highlights and links each month.

If you like what they wrote this month, write them and say so! If you didn’t quite agree with them, write them and say so! And if you’d like to join your voice to theirs, write Snowball and let him know.

Congratulations to Citywire for some excellent ARKK Snark

CityWire picked up on a tweet by Joseph Carlson, proprietor of the Joe Carlson Show on YouTube, which has 40,000 subscribers. I don’t know Mr. Carlson, but apparently, he argues for investing in high-quality, dividend-paying stocks, which seems entirely sensible. In any case, he spotted a quiet change on the ARKK Innovation homepage. Alex Steger, writing for CityWire, reports:

Yesterday (27 January 2022), Citywire reported that ARK Invest had quietly changed a prominent box at the top of its online fact sheet for its flagship ARK Innovation ETF (ARKK) from showing not-ideal recent returns to highlighting some more flattering five-year numbers.

The change was first highlighted on Sunday by eagle-eyed Twitter user Joseph Carlson.

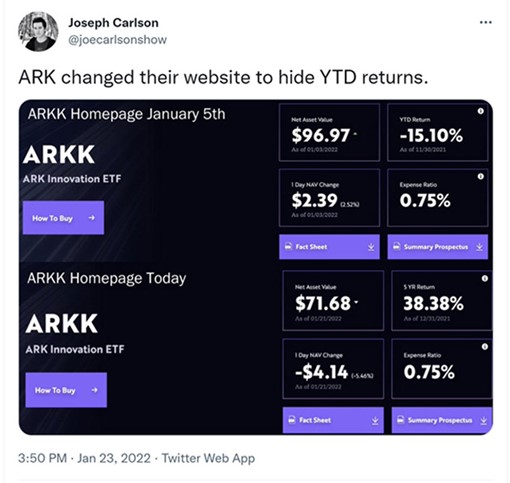
We checked this out using the good old Wayback Machine, and it stood up.

As of January 18, the page ran YTD numbers to the end of the most recent full month, so showed 2021’s 23.38% loss. But on January 19 (by which point the 2022 YTD figure was -21.90%), the box changed to show the annualized five-year number, which to the end of 2021 was a handy 38.38%. Hmm.

But no sooner had our report landed in our readers’ inboxes than… ARK changed it back again!

Justifiable snarking followed.

Thanks, as ever.

Thanks to our faithful contributors this month: Kathy, the folks at S&F Investment Advisors (serious about the fund profile offer, really), Wilson, Sheila from Edgewood, David, Wayne from Starkville, Sunil from Goleta, and John from Pensacola. And, most especially, to our subscribers: Gregory, William, Brian, David, William, Doug.

If you would like MFO to thrive in the year ahead, please support it … either financially or by reaching out to Devesh, Mark, Lynn, and Bill to let them know that you appreciate their dedication and are interested in their insights. You’d be surprised at how far a little encouragement goes!

On behalf of the folks at MFO,

david's signature

Thoughts on Inflation Protection

By Devesh Shah

An entire generation of investors has come of age without needing to learn how to protect portfolios and their wealth from Inflation. The mantra, three or four years ago, was “inflation is dead.” When inflation finally appeared last year, the Federal Reserve Chair declared it to be merely “transitory.” Sticky and low inflation for years has permitted the Fed to keep interest rates at historically low levels – a development which some fear has underwritten federal deficits, emboldened stock speculators, and punished savers. Increasingly, it appears that inflation might be neither dead nor transitory. Which assets could be helpful to an investor who considers the possibility of continued and high inflation a risk?

In the next few pages, I’m going to talk about:

  1. The role of Asset Allocation and major Asset Classes as it pertains to inflation.
  2. The unique place held by Treasury Inflation Protected Securities (TIPS)
  3. Potential risks and rewards in TIPS
  4. Funds that help investors get exposure to TIPS
  5. Series I Bonds

Using asset allocation to address inflation

The late David Swensen, manager of the Yale Endowment Fund, wrote his thoughts on investments for the personal investor in the 2005 book, Unconventional Success: A Fundamental Approach to Personal Investment (2005). Asset allocation (rather than stock picking or market timing) is the foundation for successful investing. Each chosen asset in our portfolio must have a policy objective. Assets must either:

  1. Participate in economic growth and profits
  2. Protect against financial catastrophe
  3. Protect against domestic inflation

Here, we are focused on the third policy objective, inflation. To protect investors from domestic inflation, three major asset classes can do the job in varying degrees:

  1. Domestic Equities (Stocks)
  2. Domestic Equity Real Estate Investment Trusts (Equity REITS)
  3. US Government TIPS (TIPS)

Domestic Corporate Equities/US Stocks:

  1. During periods of actual inflation, corporations attempt to raise prices and revenues. They can accomplish this, but not always immediately, and not always as much as inflation is rising. The linkage of earnings (and stock prices) to inflation exists but is weak. Domestic US Stocks provide a better hedge against domestic inflation over the long term rather than the short-term.
  2. For example, the 1970s experienced high inflation. From 1974 to 1981, CPI averaged 9.3% annually. In that window, the S&P 500 Index had a price return of only 2.89% per year. However, starting in 1982, stocks took off and more than caught up with inflation.
  3. If there is real and persistent inflation, domestic stocks might initially struggle. With enough time and patience, Stocks will eventually

Domestic Equity REITs:

  1. Equity REITs own real estate and lease it to tenants. During periods of inflation, REITs can benefit in 2-3 ways:
    1. The replacement cost of property rises with the cost of construction and labor.
    2. Many leases have automatic rent adjustments tied to the CPI.
    3. REITs may often get a higher long-term rent than otherwise during or just after a period of high inflation.
  2. Equity REITs have a more direct link to inflation than stocks. In a 2017 University of Pennsylvania paper titled Inflation and Real Estate Investments, the authors write:

The period 1974-1981 was the most inflationary eight years in the history of the Consumer Price Index at 9.3% per year, but equity REIT returns easily preserved purchasing power, with income and total returns averaging 10.2% and 16.3% per year.

  1. Equity REITs are better known and more owned since the 1970s. With popularity comes more volatility. For example, when Covid-19 hit the markets, the Vanguard Equity REITs fund declined by 42% in one month and took one year to get back to its pre-Covid price. Equity REITs will likely be ok if there is real inflation, but one must be prepared for volatility.

Treasury Inflation Protected US Government Securities – TIPS

  1. TIPS are bonds issued by the US Treasury. They are the only financial instrument directly linked to changes in the Urban Consumer Price Index (CPI-U). The principal of a TIPS Bond formulaically appreciates with inflation. There is also a fixed coupon paid, but it is close to zero these days. TIPS extend out to 30 years and are issued in the 5-, 10-, and 30-year maturity.
  2. These are some TIPS prices from the WSJ as of Jan 21, 2022:
MATURITY ~ Years to Maturity COUPON BID ASKED YIELD*
2027 Jan 15 5 0.375 107.2 107.24 -1.13
2031 Jul 15 9.5 0.125 107.27 108 -0.69
2051 Feb 15 29 0.125 106.12 106.27 -0.11
    1. The current prices of the TIPS are such that the real yield of each of the TIPS bonds is negative.
    2. A negative yield means that investors are paying the US Government an interest rather than receiving one. Why do investors buy bonds with a negative yield?
    3. Investors must want direct exposure to increasing CPI, and TIPS is the only major asset class with that direct link. Generally, TIPS thrives in unexpectedly high inflation, while Fixed coupon US Government bonds decline.
    4. The iShares 20+ Year Treasury Bond ETF (TLT), which holds fixed coupon bonds, had a total return of -4.6% for the year 2021.
    5. On the other hand, the iShares TIPS Bond ETF (TIP), which holds inflation-linked bonds, had a total return of +5.6% for the year. Despite buying bonds with a negative yield, investors who held TIPS still came out ahead because of the 7% CPI observed last year. For bonds, that’s a good return.

What are the potential rewards and risks for investing in TIPS going forth?

Just like in 2021, future gains in TIPS are likely to come from high levels of CPI, which will increase the Principal value of the bond.

What might future inflation look like?

The bond market’s best expectation, and the one the Federal Reserve loves to watch, is a metric called the 5-Year, 5-Year Forward inflation expectation, which currently stands at 2.12% inflation per year. That’s a lot lower than the 7% CPI of last year and lower than where many think inflation is headed. Let us look at some historical windows:

Period 2000-2020 1983-2000 1972-1983
Average Annual CPI 2.17% 3.27% 8.22%
Scenario “Mild” “Warm” “Hot”

Many think that inflation will come in “under Hot” for 2022 and then simmer down to “Warm” after that. Because inflation is a complex economic phenomenon, and few current market participants have lived through the high inflation of the 1970s, predictions don’t mean much.

The reason to have a core asset allocation to TIPS is to protect against unexpected future inflation. Even if the CPI settles down in the Warm zone, it’s likely an investor will come out ahead in TIPS.

What are the risks involved in investing in TIPS?

  1. If future inflation strangely dips and comes in “Mild,” given the negative yields in TIPS, the investment might scratch or make 1% per year. In that case, 2021 might look like a one-off event.
  2. The Federal Reserve has signaled an end to its bond-buying program (called “quantitative easing”) and hiking interest rates, with the direct goal to beat inflation. Traditionally, when the Fed hikes rates, real yields on TIPS rise. The magnitude of the bond selloff depends on their Duration. Usually, the 30-year TIPS real yields go up somewhere between .60 and .75 percent during the cycle. The PIMCO Long Dated TIPS (LTPZ) fell 23% in 2013 during the first Taper, fell 16% in 2016 during the interest rate hikes, and another 15% in 2018 as the rate hikes continued. However, short-dated TIPS, for example, iShares 0-5 Year TIPS Bond ETF (STIP), with less bond duration, hold up better during tightening cycles.
  3. One of the biggest buyers of TIPS has been the Federal Reserve itself, owning 28% of all outstanding TIPS bonds because of conducting QE. As QE turns to QT, they will buy less and might even reduce their balance sheet, bringing selling pressure on TIPS. The market’s interest in an Asset class wanes when the price returns decline. There could be additional investor outflow from TIPS as an asset class.

With potential negative flows and Fed tightening, TIPS could go through a price selloff. They have already started 2022 on a negative note. However, if inflation continues to come in Warm or Hot, it will be hard to hold TIPS down. The sweet spot might be to be positioned in lower duration TIPS where the flows and the Fed will hurt less while still accruing the benefit if inflation continues to come in Hot.

Gaining TIPS exposure through funds and ETFs

Using the MFO Premium Search engine, I searched for funds with the following parameters:

Objective: Inflation Protected Bond

AUM: Minimum $500mm

Bond Duration: 5 years or less

To compare, I also kept in some benchmark TIPS ETFs and mutual funds:

iShares TIPS Bond ETF (TIP)

Schwab US TIPS ETF (SCHP)

Vanguard Inflation-Protected Securities (VIPSX)

PIMCO 15+ Year US TIPS Index ETF (LTPZ)

STIP, VTIP, ALMIX, STPZ show us as funds with a low nominal maturity and low effective duration. In years the longer-dated TIPS were hurt, these shorter-dated funds were slightly down to even mildly up. The shorter-dated TIPS feels like a safer sleeve that might still meet the policy objective of inflation protection.

One should note that when the principal of the TIPS increases with CPI, this increase is taxable in the current year, even though we do not receive the CPI-adjusted principal back until maturity. TIPS may be inflation-friendly, but they are not tax-friendly. Therefore, Tax-Deferred Accounts might be a better place to house TIPS for most investors.

Wouldn’t we earn more income in some managed bond fund that takes credit risk, high yield bond risk, bank loans, etc? Why bother with TIPS at all? In response, I remind myself that part of an asset’s job is to help protect the portfolio during a financial catastrophe. In every distressed selloff, most of these said credit bond funds suffered a substantial drawdown. Credit funds tend to behave like a mini version of equities. By contrast, US Government Bonds are the only bonds that will retain their buying power. This flexibility allows us to rebalance and buy risky assets (stocks).

Series I Bonds: The small investor’s friend

We share enthusiasm for Mr. Zweig’s favorite secret investment

The best friend of the US Saver has been the Series I Savings Bonds. These can only be bought by US resident investors in sizes of up to $10,000 per year through Treasury Direct (and an additional $5,000 when funded through tax refunds). Series I have gone from relative obscurity to the bond investment du jour with billions invested in the last few months. This interest in Series I has been due to a tactical and a strategic reason. Tactically, the interest received on Series I is backward-looking. The large CPI number will guarantee an almost 7% six-month coupon of that amount from April to October of 2022. Strategically, these bonds have no duration risk. Their price can never go down, and one can choose to pay no taxes until maturity. On the other hand, they must be held for at least a full year, and liquidating before five years incurs a three-month interest penalty. Series I seem like excellent to hold for 2022. $10,000 of investment is a sweet deal, but those with a larger investment capital pool must dig deeper and wider than the Series I Bond.

Learning more …

Those truly interested in understanding the detailed mechanics of inflation and TIPS may watch the following videos I prepared in late 2020 for a YouTube channel I run: Devesh Shah’s Understanding Personal Investments.

  1. Inflation and the Difference between Nominal and Real Returns: Video 31
  2. US Government Inflation Linked Bonds An Overview: Video 37
  3. US Government TIPS Technical Details: Video 38
  4. US Government Savings Bonds An Exceptional Deal for the Small Saver: Video 39


Analysis Paralysis and Talking Heads

By Charles Lynn Bolin

“But I don’t want to go among mad people,” Alice remarked.

“Oh, you can’t help that,” said the Cat: “we’re all mad here. I’m mad. You’re mad.”

“How do you know I’m mad?” said Alice.

“You must be,” said the Cat, “or you wouldn’t have come here.”

– Alice in Wonderland, Lewis Carroll

At the time of this writing, the S&P 500 has fallen 7.8% year to date. Some respectful sources point to retail (small) investors panicking. Alice, the Mad Hatter, and I are not so sure. There are those who believe they can time the markets and are trying to jump ahead of the falling market before the rest of the crowd. Then some investors have the financial acumen to make quick, intelligent decisions. Should you sit back and ignore the volatility, buy the dip or sell the news? The Talking Heads know and will sell you the news or service. For many of us, panic is a realistic option. How do we fight this natural tendency which honed the survival skills of our ancient ancestors?

This article covers the following sections, and readers may skip to the sections of interest.

    1. Analysis Paralysis
    2. Talking Heads
    3. Investment Environment
    4. Storyline
    5. Investment Strategy
    6. Model Portfolios

1.  Analysis Paralysis

    • Analysis paralysis occurs when over-analysis or overthinking of alternatives prevents an individual or a group from making a decision.
    • In investing, analysis paralysis can lead to missed opportunities.
    • Psychologists say the root cause of analysis paralysis is anxiety. We fear choosing the wrong option.
    • Decision-making, both trivial and life-changing, can be improved by resisting analysis paralysis.
    • One tactic: “Stair-step” your decisions, taking a series of small steps towards a big decision.

Analysis Paralysis, Investopedia

Most of us succumb to analysis paralysis at some point while investing. Small investors are generally poor market timers, and Vanguard’s philosophy is that many investors should use low-cost index funds and stick to set allocation, which decreases as we age. I lean more toward Fidelity’s philosophy of investing according to the business cycle. Traveling through empty airports after COVID struck, without standing in lines, and with most shops closed was surreal, and I had some analysis paralysis. Some of my family got COVID while I was out of the country, and I was unable to travel to see them.

The way that I reduce my analysis paralysis is to have a financial plan, follow the bucket approach with three years of living expenses in safe short-term investments, have an investment strategy, simplify investments, and study the markets. I also like the final point in the quote above to make changes in small steps. My view of the investment environment does not change much month to month, and neither should my investments.

2.  Talking Heads

As I’m now in my fourth decade of memo writing, I’m sometimes tempted to conclude I should quit, because I’ve covered all the relevant topics. Then a new idea for a memo pops up, delivering a pleasant surprise.

Latest Memo From Howard Marks: Selling Out, Oakmark Capital

I used the term “Talking Heads” figuratively to represent all financial news sources that tend to be more focused on selling the news than educating the investor. I have learned so much from credible books such as Mastering the Market Cycle by Howard Marks. I am leery of sources that have explanations of daily movements in the stock markets or proclaim future directions with extreme confidence. Unreliable sources can lead to analysis paralysis and anxiety. As I near retirement and have focused on simplifying my investment strategy, I trimmed down the number of news sources that I review to the more reliable.

One of the reasons that I developed the Investment Model was to view the data myself because many of the relationships between indicators and markets are exaggerated by the Talking Heads. Below I show my Orders Indicator, which is a composite of durable goods orders (DGORDER, ADXDNO) and non-defensive capital goods orders (NEWORDER, ANDENO). Orders precede purchases and are a leading indicator of the economy. Orders show the economy is growing but at a slower pace. They are currently suggesting a major slowing of the economy.

Figure #1: Leading Indicator – New Orders

Source: Created by the Author Using the St. Louis Federal Reserve FRED Database

3.  Investment Environment

I wrote a primer on Business Cycle Portfolio Strategy in the December 2019 Mutual Fund Observer newsletter. I am no Benjamin Graham, and while I like his guideline of never investing less than 25% in stock nor more than 75%, as I near retirement, I adjusted the parameters in the Investment Model to a minimum allocation to stocks of 35% and a maximum of 65%.

I discovered the St. Louis Federal Reserve FRED database around 2010 and began building investment models such as the current model shown in Figure #2. The model is based on 32 composite indicators of which the two most negative are inflation and valuations but also productivity, investment, and housing. The S&P 500 has delivered 11% returns for the past 27 years with three major bear markets. Investing according to the Investment Model would have delivered 9.3% annualized returns with lower risk (drawdowns) than the S&P500. Much of the gains in the S&P500 are due to quantitative easing artificially increasing asset prices.

In Figure #2, the dashed blue line is the Investment Environment (IE) which is the basis of the Allocation Index before a 35% and 65% cap is applied. The Allocation Index (blue) is now at 65% stocks, recommending being at the more aggressive end of my allocation range. The red line is the percent of negative indicators and shows the breadth of the slowdown. It is clear that the IE index is falling rapidly, indicating a deterioration of the investment environment. For this reason, I believe that it is prudent to continue (gradually) to reduce risk in portfolios as we near the late stage of the business cycle.

Figure #2: Investment Model

Source: Created by the Author

Figure #3 shows the changes in allocation in the Investment Model.

Figure #3: Investment Model Allocations

Source: Created by the Author

Excellent books on investment models and business cycles are Nowcasting the Business Cycle by James Picerno, Conquering the Divide by Cornehlsen and Carr, Investing with the Trend by Gregory L. Morris, Ahead of the Curve by Joseph H. Ellis, Probable Outcomes by Ed Easterling, The Era of Uncertainty by Francois Trahan and Katerine Krantz, The Research Driven Investor by Timothy Hayes, and Beating the Market 3 Months at a Time by Gerald Appel and Marvin Appel.

4.  Storyline

Fisher is correct that rates may not impact the financial markets in the short term. However, most of the gains got forfeited in every instance as interest rates slowed economic growth, reduced earnings, or created some crisis… Most importantly, a much higher degree of reversion occurs when the Fed tightens monetary policy during elevated valuations.

Don’t Fight The Fed, Lance Roberts

I started building the Investment Model when I discovered the St. Louis Federal Reserve Database (FRED). The Investment Model is intended to have a six-month forward look at general market conditions. It does not understand COVID, nor the tensions with Russia over Ukraine, nor the crackdown in China. However, it does show established relationships between data and the Investment Environment. My ranking system for funds is developed using data from the Mutual Observer Premium Service Multi-Screen. It has more granularity than the Investment Model and is good for confirming trends. I extract data on two hundred quality funds and rank them based on total return trends and fund flows.

One factor that I include in my storyline is the high price of the dollar relative to other currencies, as well as high domestic valuations relative to international markets. As the Dollar Currency Index from CNBC shows, the dollar is at some of the highest levels in the past forty years. The 1980s saw the breaking of inflation, and the late 1990s experienced the technology bubble. I expect the dollar to weaken at some point in the next few years. High debt and deficits are another concern. International funds tend to outperform when the dollar weakens.

Figure 4: Dollar Currency Index

Based on the Investment Model, Ranking System, and my investment sources, I develop a storyline to guide investments. This storyline is reviewed monthly. My storyline for 2022 is:

    • Fear of Fed Tapering will increase volatility. I include defensive but not bearish funds. I exchanged the Fidelity Select Med Technology & Devices (FSMEX) fund because of its high volatility in the Fidelity Model Portfolio for the Fidelity Multi-Asset Income Fund (FMSDX).
    • Inflation will compress high valuations. The economy will continue to grow at a slower rate in 2022. I have included commodity and real return funds and tilt toward value.
    • Inflation will moderate the economy when rates start to rise, further increasing volatility. I own consumer staples and utility funds which tend to do well during the late stage of the business cycle.
    • Concentrated market capitalization in a handful of technology stocks increases risk. I have tilted portfolios away from technology.
    • High valuations relative to international and monetary policy favor international stocks. I tilt toward global developed economies.
    • Interest rates will rise, but the impact will be muted initially because it is coming off a low base.
    • Emerging markets funds may suffer as rates rise. Smaller caps may outperform. I exchanged a modest amount of American New World (NWFFX).
    • I expect the current dip/correction to be short-lived, and the market will recover. I will use market fluctuations to adjust portfolios but not try to time the markets.

5.  Investment Strategy

The long, long bull market since 2009 has finally matured into a fully-fledged epic bubble. Featuring extreme overvaluation, explosive price increases, frenzied issuance, and hysterically speculative investor behavior, I believe this event will be recorded as one of the great bubbles of financial history, right along with the South Sea bubble, 1929, and 2000…

But this bubble will burst in due time, no matter how hard the Fed tries to support it, with consequent damaging effects on the economy and on portfolios. Make no mistake – for the majority of investors today, this could very well be the most important event of your investing lives.

Waiting For The Last Dance, Jeremy Grantham

There are some experienced and successful investors, such as Jeremy Grantham, quoted above, that provide an important perspective to individual investors. While the economy may continue to grow, valuations will compress, and returns will be lower over then few years or decades.

My neutral allocation is 50% to stocks tilted to 65% during the recovery stage of the business cycle and to 35% in the Late Stage as a recession seems more probable. We are in the middle stage of the business cycle, and I have shifted investments to those that do well in the late stage of the business cycle. Most of the funds that I hold are core funds where allocations may tilt slightly, but I reserve approximately 20% to be in a tactical sleeve to adjust according to the business cycle.

6. Model Portfolios

I have built two model portfolios using the Morningstar Portfolio Tool, including dividends, based on my latest articles in Mutual Fund Observer. The two models are intended to be moderately conservative portfolios in Traditional IRAs. The funds and allocations are shown along with one-month, three-month, and year-to-date returns. I like to look at the performance of funds during dips to gain a glimmer of how they might perform during a major correction. The S&P500 (SPY) is shown as a baseline fund. While the S&P 500 fell 7.79% at the time of this writing, the Vanguard model fell only 1.2%. I am especially pleased with the Vanguard Global versions of the Wellington and Wellesley Funds. The domestic Wellington fund may be the riskiest fund in the portfolio. The Commodity Fund did great, but performance is likely to fall as supply chains reopen.

Table #1: Vanguard Model Portfolio for Traditional IRAs

Source: Created by the Author Using Morningstar

There are two ways that I may tilt the Vanguard Model Portfolio to be more conservative: 1) exchange funds in the tactical sleeve (VDC, VPU, VCMDX) for cash or bonds, and 2) exchange the more aggressive VGWAX for the more conservative VWIAX. COTZX changes allocations based on cyclically adjusted price-to-earnings ratios and plays a large part in automatically adjusting allocations to the business cycle. I see no reason to change the portfolio at this time. Commodities are a hedge against inflation, and COTZX is a hedge against a major market correction.

The Fidelity Model Portfolio is also intended to be a moderately conservative portfolio suitable for a traditional IRA. It lost 2.58% year to date compared to 7.79% for the S&P 500 or 33% of the S&P 500 decline. I sold FSMEX early in the market decline because of the high volatility. I also decreased allocations to the emerging market fund, NWFFX, by a small amount.

I selected the funds in the Fidelity Model Portfolio for several reasons, including low correlation to the S&P500, long-term risk-adjusted returns, tactical approach, and stage of the business cycle. I will be monitoring them over the rest of the year. Some will bob while others are weaving.

FBALX is a potential candidate to reduce because of its high allocation to technology. Funds that I may increase allocations to are Consumer Staples (FDFAX) and Columbia Adaptive Risk (CRAAX). The Blackrock Systematic Multi-Strategy Fund (BAMBX) is not part of the portfolio but one that I am considering adding. Its short-term performance has been good.

Table #2: Fidelity Model Portfolio for Traditional IRAs

Source: Created by the Author Using Morningstar

I plan on creating more model portfolios as I retire later this year.

Closing

Far more money has been lost by investors preparing for corrections, or trying to anticipate corrections, than has been lost in corrections themselves.

– Peter Lynch

I don’t disagree with Mr. Lynch, but as I said at the start of this article, there are those that try to time the markets and others such as Benjamin Graham and Howard Marks that successfully adjust risk according to the business cycle and/or valuations. Capital preservation should be an important part of investment strategies as we move toward the normalization of quantitative easing and rates, a maturing business cycle, and extreme valuations.

Writing this article helps me analyze how I invest and where I need to adjust going forward. Each month, I look forward to the “dropping” of the Lipper global data through MFO screens and adjusting my rating system to evaluate the changing trends.

What is Your Edge?

By Devesh Shah

Many people are heartsick after watching the stock market’s gyrations. Some of the people who are queasiest are the young investors who thought, “this is so easy!” as they booked a year’s worth of profit in a single morning, trading meme stocks or NFTs or cryptos or any of a dozen other securities they could barely explain, much less analyze. More will find their moment of reckoning as they confront enormous capital gains tax bills, and sadly reduced portfolios.

I am not criticizing them because, once upon a time, I was them. I would like to share a bit of biography that might help you …and them … and me, manage in the turbulence to come.

– – – – –

The month was May, and the year was 2000. For the first time in my life, I had both the money and the opportunity to get involved in the stock market.

Let me start with the money. I came to America in 1994 from India, sight unseen, for an undergraduate degree at Indiana University. I had exactly one semester’s worth of tuition money, a lot of debt, and family expectations. I had walked away from a full scholarship in Singapore and was “all in” on America. I graduated from IU in three years and then worked at Merrill Lynch in New York from 1997-2000.

The stock market was red hot in the second half of the 1990s. Fellow colleagues, friends I knew from IU, people I had met in New York, were all involved in stocks. I had no money in the stock market. During that time, I was paying down debts in India and student loans from IU. For the first time, around 1999, I was able to save some money, and my attention drifted toward the stock market. But the opportunity to trade was still limited.

I had no family in the US, no background in investment, and no understanding of how the American economy worked. The only difference in my mind from one company to another was the stock name and ticker. In those days, trading required calling an actual broker. I mostly avoided trading because I did not want to sound foolish by buying or selling based on rumors and news stories. Then in May 2000, I joined Goldman Sachs as a derivatives trader. There, things were different. Goldman had an online trading platform. That meant I could trade any stock, and no one would know that I knew nothing. That made me foolishly courageous to trade excessively, and of course, I learnt my lesson the hard way.

The Nasdaq, over the next few years, went on to become the Nas-dawg, and I managed to lose close to fifty thousand dollars! A lot of people lost a lot of money, but I took it very personally. Just a few years earlier, I was wearing second-hand clothes, ironing my own shirts, and walking from the train station in Jersey City to my apartment at two in the night to avoid spending money on a cab. How could I get carried away and risk so much money in the market?

– – – – –

The loss turned me off stocks for personal trading. But I also wanted to learn how to get it right and not waste the loss. At Goldman Sachs, I was surrounded by the best and brightest minds in finance. KK was a senior trader from Tokyo who had been asked to come to New York. Being no fool, he never participated in the stock market bubble. Each time I got overly excited about picking some stock or timing the market, he would only smile and brush away my suggestion. One day, I asked him why he always smiled but never listened to my suggestions. That day he didn’t smile.

KK-san told me he had heard all my stock market babble for months, and he had only one question for me: “What is your edge?”

“What do you mean edge? Isn’t it our job to speculate?” I naively asked.

“Edge,” said KK-san, slowly, “means what do you know about the stock that you are pitching, or about timing the market that gives you conviction? Edge means what do you know that no one else does? Edge means what is your understanding of risk and rewards and the probabilities attached with the distribution of risk and reward, and how is that superior to everyone else’s? A trader’s job is not to speculate. A good trader makes informed risk-reward decisions. A great trader makes those decisions in a big way.”

“How do I get Edge?” I asked attentively. KK-san once again put on his smile and went back to work.

Almost immediately, I understood why I lost a bundle in the stock market. I never had any EDGE. I was simply trading based on rumors and price patterns and whatever garbage news stories everyone else was parroting. Thenceforth, I immersed myself, mind and body, in finding Edge in the markets. I learnt the science and art of options and derivatives trading inside out, first from KK-san, then from reading lots of books, and finally becoming my own teacher through hard work. Knowing when I didn’t have edge made me choose my words carefully when I spoke to others. Instead of talking, I listened, and the edge started coming. The dots started connecting.  

Traders weren’t expected to work evenings and weekends, but I started staying late at work and going into work almost every Sunday afternoon. I learnt a lot from building and running hundreds of fundamental and technical reports on my derivatives positions to calibrate the risks versus rewards available in the market.

Was it easy to find Edge? Never, and not by a million miles. Only liars and geniuses find Edge overnight. Often, I was trapped in the emotions of taking a big risk when I was down, thinking I had Edge when I had none. The market was never friendly. And many other times, I was sure I had Edge, but the market did not support my judgment. It’s not enough that you work hard or work smart; the universe must want you to succeed. But every year, there was some progress. 

Did Edge always bring results? Far from it. Despite having the correct positions, the market is notorious for penalizing traders and testing convictions. There were nights I went home and went straight to sleep. The losses were gut-wrenching. Does having Edge mean I became George Soros or Warren Buffett? No, because there is a certain talent, drive, and ambition, maybe intelligence required, maybe luck and wisdom, that I did not have. Having Edge only means you can do one or a few things well and about as well as the universe allows you to do. But you must knock hard on the Universe’s door and ask for the chance.

– – – – –

I often wonder what would have happened if I had ignored KK-san that day. I know so many other fellow derivative traders from that time who didn’t think it was necessary to get Edge, who continued trading based on guts and instinct rather than finding deep-rooted conviction through hard work and research. They mostly drifted away. On the flip side, I have also seen the people in markets and captains of industry who bring with them wisdom, hyper consciousness, a bold vision, ambition, aggressiveness, humility, and confidence, and they get the fruits they deserve but only after they have been tested. All our modern-day heroes clearly have, or had, Edge in what they are doing.

The GameStop episode is a wake-up call for those without Edge.

One year in the life of GameStop stock

If you think about the winners, they were in early, and they had done the research. They knew enough of the fundamentals and had focused enough on the technical shorts to understand why the stock could have a lopsided outcome. They had some Edge.

Who didn’t have Edge? The hedge funds that were shorting the stock and were too confident of their fundamental analysis over the technical positioning. Who else didn’t have Edge? The me-too traders who bought the stock high and are still nursing the losses. Edge usually defines who loses and who wins. If one truly accepts and believes that Edge matters, then one needs to decide if they have Edge before diving into the next wave of speculative stock trading.

We know we live in a winner take all world. To be a winner, first, we must define which world we are competing in. And we must know who else is competing. We must bring something to that world that is unique so that people will want to come listen to us. In the process, maybe they will say something wise that they have learnt. When others talk, we should listen because when we listen carefully, we might pick up some EDGE.

For most investors, our most reliable Edge lies in a series of virtues that seem painfully out of fashion these days: patience, humility, and diligence. Patience reflects the understanding that we will be holding for years the stuff that others buy and sell a dozen times a day. Humility discourages us from making “big bets” when we’re better off spreading out risks and tempering our expectations. Diligence is the willingness to study, learn, grow and adapt. It teaches us the Art of Adulthood: following our minds rather than our impulses.

What is your Edge?

On Risk

By Mark Freeland

On Risk

Justice Potter Stewart’s most famous line is the one that he most regretted:

I shall not today attempt further to define the kinds of material I understand to be embraced within that shorthand description [“hard-core pornography”], and perhaps I could never succeed in intelligibly doing so. But I know it when I see it, and the motion picture involved in this case is not that. Concurring Opinion, Jacobellis v. Ohio, 378 U.S. 184 @ 197 (1964)

In 1981 he lamented “having said what I said about obscenity—that’s going to be on my tombstone.”

Many investors have the same difficulty with risk that Justice Stewart had with “hard-core pornography,” they are not quite able to define it though they’re pretty sure they know it when they see it. Given that we seem to have entered a period when risk is going to be on a lot of minds, it’s important to understand what it actually is in order to avoid succumbing to it. In the next couple of pages I would like to do four things:

  1. define risk, with an eye to Warren Buffett
  2. celebrate risk, an investor’s essential ally
  3. distinguish “risk” from “risk surrogates” such as volatility, drawdowns, or return deviations.
  4. suggest what investors who understand risk might be doing now

Like many people, as a child, what I did with the money that I didn’t spend immediately was deposit it into a savings account. It’s easy for children to understand a simplified idea of safety. To use ten-dollar words, bank deposits have no risk of nominal loss. Back then, when banks paid what looked like real money, one even got growth at least in nominal (not inflation-adjusted) dollars.

As the banker, the elder Mr. Dawes (Dick Van Dyke), sang in Mary Poppins: “If you invest your tuppence wisely in the bank, safe and sound. Soon that tuppence safely invested in the bank will compound ….”

As investors, we all know that investing entails risk. Whatever that means. Yet the nagging aversion to nominal loss remains. Reviewing my old records of how I invested in my first employer’s company retirement plan, I find that even after several years, about half of my money was in a stable value portfolio.

Meanwhile, coworkers were investing in stocks. They would say they could make money throwing darts at a stock page. And at the time, that was largely true. Still, my reaction was: invest in stocks, are you crazy? It takes a while to get accustomed to risk.

So what is this risk that we’re all averse to? It’s easy to say that the objective of investing is never to lose money, to make a lot of money, and to do that smoothly. It’s also easy to say “Bernie Madoff.” That’s just not the real world. More than that, these objectives hint at risk, but they don’t define it.

A good definition of risk was given by Warren Buffett in his 2011 shareholder letter: “The riskiness of an investment is … measured … by the probability – the reasoned probability – of that investment causing its owner a loss of purchasing-power over his contemplated holding period.” One might refine or modify this slightly to say that risk is the probability of not having enough money available when it is needed (or desired).

This refinement helps in a couple of ways. It incorporates a sense of why we invest. Not losing money is nice, but if we don’t make enough to cover our expenses, that’s still a problem. And it implicitly absorbs problems like having to sell at the wrong time (e.g., sequence of return risk). Selling at a bad time is part of this view of risk because one might not be able to handle the next expense, or the next. By thinking about how one meets spending needs, rather than just about whether a particular investment is profitable (in real terms), one works with a broader concept of risk.

With this idea of risk in mind, if one doesn’t need to draw on money for more than a decade, invest in equities. A diversified portfolio is, at least based on many decades of history, nearly certain to be worth more when that money is finally needed. The greater growth of equities reduces the risk of not having the money needed when investing over long horizons.

What about money that might be needed in less than a decade? It’s over these shorter timeframes that metrics like volatility, maximum drawdown, and time to recovery become significant. In and of themselves, they are not measures of risk. What they do is help investors think about the risk of not having enough money when needed – the likelihood of falling short and the magnitude of the shortfall.

When one holds an investment for a given period of time, what matters is how much one paid for the investment and how much it is worth in the end. What happens in between doesn’t matter. Sure, there’s the matter of whether one can sleep at night with wild gyrations. There’s also the possibility that an investment simply goes south. One should be continually reviewing one’s holdings for unexpected changes. But if the reason one chose the investment hasn’t changed, the zigs and zags along the way are objectively rather unimportant.

While volatility isn’t risk, it still matters. With bad luck, one may wind up buying high (market up) and selling low (market down). The greater the volatility, the more this bad luck may be amplified. A tame investment might be down 5% from its peak when one needs to cash out, while a highly volatile investment might be down 25% at that same moment.

Over longer investment horizons, the greater returns that are associated with higher volatility will tend to more than make up for this worst-case possibility. But over shorter periods of time, volatility at the endpoints (buying and selling) can swamp average expected returns. Because of this, investors tend to use less volatile investments (or a glide path approach) for shorter-term investing.

This fits with the concept of risk as having money at the right time. Investing in less volatile investments over the short term reduces the likelihood of a big loss and thus not having enough money when it is needed. There’s a tradeoff here. One is forfeiting expected gain in exchange for lower risk. Instead of investing in something which, seven times out of ten, leaves one better off, one invests in the “almost sure thing” in order to reduce the risk of a shortfall. In effect, one is buying insurance.

Broadly speaking, insurance is paying to shift risk to ensure that we have money when needed. Or at least to reduce the probability that the money won’t be there. How much we insure depends on how much it will hurt if it isn’t there. As an example, we buy health insurance, even as we hope never to be afflicted by something costing six, seven figures, or more to treat. But we may not insure for 100%. It’s often not worth the extra cost to us.

Unlike individual investors, mutual funds have no money needs that they are targeting. They are designed to be perpetual vehicles. So for mutual funds, we can introduce the concept of a “risk profile.” How much do they expect to gain (or lose) under what conditions? As with individual investors, there is a tradeoff between how much they expect to gain long term and the probabilities of falling short by how much.

With “vanilla” funds, your typical stock, bond, or hybrid fund, the risk profiles are pretty straightforward. People understand how stocks and bonds broadly speaking behave. One can think of an allocation fund as buying insurance to the extent that it allocates money to bonds as opposed to stocks.

Where things get interesting is where funds use derivatives or other techniques to alter their risk profiles. Sometimes what they do is straightforward, and investors can gauge how that investment affects their personal risk – the likelihood of being unable to satisfy cash needs. But often, “elegant” funds are relatively opaque.

Derivatives are used to shift the risks (alter the consequences) of different events. “Hedging” is often mentioned, presumably involving the use of a derivative as insurance to protect against something bad happening. Unlike simple insurance, this risk-shifting may have the effect of moving risk around. It can concentrate risk so that most, perhaps the vast majority of the time, things work well and the fund benefits. But on that rare occasion when things don’t work well, the result can be catastrophic.

A consequence is that funds may “work until they don’t.” A fund may suddenly drop through the floor while doing exactly what it is designed to do. Unfortunately, standard techniques, like checking correlation with other funds, do not necessarily provide much insight into that design since most of the time, the fund behaves “normally.” Until it doesn’t.

Mortgage-backed securities (MBSs) strike me as something that can have this type of behavior. Though I may be nearly alone with my concerns here. Mortgage holders can prepay their mortgages. That’s effectively a call option. This causes MBSs to behave differently in some situations. They are different even from conventional callable bonds, which are typically called if and only if market rates fall below coupon rates.

Generally, MBSs pay more than other debt of similar quality and maturity. They have higher yields because of a “risk premium.” They have extension risk – the risk that mortgage holders will tend not to prepay their mortgages as expected because rates are rising. So just as bond prices are going down due to rising rates, MBS prices will fall faster than other bonds because their effective maturities are growing. The flip side is prepayment risk – that mortgage holders will prepay their mortgages faster than expected (e.g., refinance) because rates are going down. Likewise, this is not good for MBS investors.

That risk premium pays off until it doesn’t. If interest rates change too quickly, these bonds can get battered.

All the mathematically precise figures that one can look up for a fund – volatility, drawdown, and the rest – may not actually be risk, but they still inform us. They give a sense of the risk profile of a fund. We can use that to estimate the chances of meeting our goals, of having enough money for expenses as they are incurred. The more “elegant” a fund is, the more it uses sophisticated techniques to manage (alter) its risk profile, the more one needs to look past the basic metrics and understand the fund in-depth.

Biggest Bang for your Buck

By David Snowball

Fresh from the MFO Archives! An update on a classic essay.

20 equity funds with the best capture ratios over the entire market cycle

Capture ratio is a sort of “bang for your buck” summary. It’s calculated by dividing a fund’s upside capture (a fund that typically rises 1.1% when the market rises 1% has an upside capture of 1.10) by its downside capture (a fund that typically falls 1.1% when the market falls 1% has a downside capture of 1.10). Capture ratios greater than 1.0 reflect funds that produce more gains than losses; all other things being equal, high capture ratio funds are offering you the greatest reward for every unit of risk you’ve been subjected to.

Capture ratios even the playing field for cautious and aggressive investors. A cautious investor might look for a fund with a downside capture of no more than 0.80. Given that constraint, anything above 1.0 is a winner! Aggressive investors might be willing to accept downside captures of 1.10 as long as they’ve been duly compensated. So, for them too, anything above 1.0 is a winner.

By this metric, some funds have long-term returns of 2% (with virtually no downside capture) while others have returns over 12% (with substantially more downside than the most conservative funds but substantially less downside than the market). Depending on your goals, both 2% and 12% can signal major wins.

I screened f0r:

  1. equity-oriented domestic funds, which included “flexible portfolios” and “aggressive allocation” funds but excluded global,
  2. with a capture ratio 1.1 or greater,
  3. with a downside capture ratio of 0.9 or less,
  4. over the past 15 years. The logic is that we want to capture performance across entire market cycles, including both the 2007-09 crash, the bull beginning in 2009 and the miscellaneous crashes and surges since then.

I excluded closed funds and high-minimum ones. I also excluded Copley Fund (COPLX), historically a freakishly excellent fund that lost its manager of 40 years recently. All data is current as 0f 12/31/2021.

    Lipper Category APR APR vs Peer SP500 Down Cap % SP500 Capture Ratio
Changing Parameters CPMPX Flexible 3.4 -2.6 10 1.9
Needham Small Cap Growth NESGX Sm Core 13.1 +4.6 87 1.2
Parnassus Core Equity PRBLX Eq Income 12.4 +4.4 80 1.2
Reynolds Blue Chip Growth RBCGX Multi Gro 13.5 +1.6 79 1.2
AMG Yacktman Focused YAFFX Multi Value 11.5 +3.9 75 1.2
Provident Trust Strategy PROVX Lg Core 11.3 +1.2 73 1.2
SEI Defensive Strategy SNSAX Flexible 1.6 -4.4 10 1.2
Columbia Thermostat COTZX Flexible 7.2 +1.2 45 1.2
BlackRock iShares S&P 500 Growth ETF IVW Lg Gro 13.1 +0.5 90 1.1
Sit Dividend Growth SDVGX Eq Income 10.7 +2.7 90 1.1
Fidelity Contrafund FCNTX Lg Gro 12.6 0 89 1.1
T Rowe Price Dividend Growth PRDGX Lg Core 10.6 +0.5 89 1.1
John Hancock US Global Leaders Growth USGLX Lg Gro 12.2 -0.4 87 1.1
Capital Advisors Growth CIAOX Lg Core 10.4 +0.4 87 1.1
Calvert Equity CSIEX Lg Gro 12.1 -0.5 86 1.1
Meridian Enhanced Equity MEIFX Multi Gro 10.7 -1.1 86 1.1
Nuveen Dividend Growth NSBRX Eq Income 10.5 +2.4 86 1.1
Saturna Amana Growth AMAGX Lg Gro 12.8 +0.2 85 1.1
Sterling Capital Equity Income BEGIX Eq Income 10.1 +2.0 84 1.1
AMG Montrusco Bolton Large Cap Growth MCGFX Lg Gro 11.3 -1.3 84 1.1
Jensen Quality Growth JENSX Lg Core 11.6 +1.6 83 1.1
Amundi Pioneer Fundamental Growth PIGFX Lg Gro 12.4 -0.2 83 1.1
Saturna Amana Income AMANX Eq Income 9.9 +1.8 82 1.1
Vanguard Dividend Appreciation Index ETF VIG Eq Income 10.3 +2.2 82 1.1
Sequoia SEQUX Multi Gro 10 -1.9 80 1.1
Alger Growth & Income ALBAX Lg Core 10.7 +0.6 79 1.1
Vanguard Dividend Growth VDIGX Eq Income 10.8 +2.7 77 1.1
AMG Yacktman YACKX Multi Value 11.1 +3.5 77 1.1
Invesco Defensive Equity ETF DEF Multi Value 9.5 +2.0 76 1.1
Madison Dividend Income BHBFX Eq Income 9.5 +1.4 71 1.1
Intrepid Endurance ICMAX Sm Gro 7.3 -3.3 53 1.1
Aberdeen US Sustainable Leaders Smaller Companies MLSCX Multi Gro 6.7 -5.1 51 1.1
Bruce BRUFX Flexible 8.3 +2.3 57 1.1
FPA Crescent FPACX Flexible 7.8 +1.8 61 1.1
AMG GW&K Global Allocation MBEAX Flexible 7.4 +1.4 57 1.1

Miscellaneous notes:

MFO Great Owl Funds have posted consistently excellent risk-adjusted returns over every trailing measurement period. We have flagged those funds with a bolded blue name.

We’ve also highlighted funds with annual returns above 12% a year and those that capture less than 80% of the S&P 500’s risk with blue highlighting in the corresponding cell.

This list is biased toward mutual funds rather than ETFs by virtue of its time window (15 years ago, there were far fewer ETFs) and its focus on risk management (older ETFs were designed to match markets, not outsmart them). A 15-year retrospective run in 2027 will almost surely have a lot more exposure to active and smart beta ETFs.

Virtus KAR Small-Cap Growth (PXSGX) had the single best risk-return profile, but we excluded it because it’s tightly closed. Good news: in 2021, Virtus KAR recently launched a version with a slightly looser set of constraints, Virtus KAR Small-Mid Growth.

The appeal of the Reynolds Blue Chip (RBCGX) fund is almost entirely driven by its performance during the 2007-09 crash. It appears to have been almost entirely in cash and simply sailed through it. Over the past decade, though, it’s been entirely uninspiring.

FPA Crescent (FPACX) is the largest single holding in Snowball’s non-retirement portfolio, which we mention as a matter of full disclosure rather than as a particular endorsement. FPA recently launched an active ETF that mimics the equity portion of Crescent’s portfolio.

Bottom Line: Statistical screens offer leads, not answers. Your next step is understanding the portfolio behind the excellent numbers. Lewis Braham, a very good financial journalist and frequent contributor to MFO’s discussion board, argues:

I think it is important to analyze sector exposures within funds that performed in the last cycle and analyze how those sectors might perform in the next cycle. Yacktman, for instance, has long held exposure in consumer defensive or staples stocks such as Proctor & Gamble, Coca-Cola, Pepsi, Johnson & Johnson in addition recently to a large slug in Samsung.

The question to ask is has anything changed in the commercial outlook for such steady-eddies? I would argue for instance a lot has changed for a company like Proctor & Gamble as thanks to the Internet the competitive landscape for purchases like razor blades and soap is different. The question then becomes is the money manager aware of these changes. In Yacktman’s case, I think the answer is “yes,” from my experience with them.

Yet just because you’re aware of significant changes in the mainstays of your portfolio, doesn’t mean you have figured out what suitable replacements might be yet. That can be quite challenging.

21 In 21 Plus Annuity Modeling and New Taper Periods

By Charles Boccadoro

We posted month ending January 2022 performance to MFO Premium site early Thursday morning, 3 February. Pretty tough month! Nearly all funds should be included in this “incremental” drop from Refinitiv, but any omissions will be incorporated in the full monthly drop on Saturday.

We hosted our year-end review webinar on 4 January. Thank you again to all who participated! I benefit from these sessions just as much as I hope you do. It was the third consecutive year in which most domestic equity funds did well, enjoying last of the Fed’s “Infinity” round of Quantitative Easing. Energy funds finally recovered. Most bond and emerging market funds struggled in anticipation of tapering and rising rates. Here are links to the chart deck and video recording.

Of the 6,700 mutual funds available in the US, only 21 incurred no drawdown in 2021 (based on month ending total return, excluding money market funds), while delivering returns exceeding their dividend yield, nominally. And, of those, only 17 offer yields greater than a 1-year CD, which is about 0.60%. Three of those (RSIIX, CBLDX, and DGFFX) are advised or sub-advised by David Sherman of Cohanzick Management, whom David Snowball has championed for years. Here are the 21 mutual funds, sorted first by category and then return:


Other notable funds on list profiled previously on MFO: IOFIX, managed by Tom Miner of Garrison Point Capital; ZSRIX (sustainable sister of ZEOIX), by Venk Reddy of Zeo Capital; and ICMUX, by Hunter Hayes of Intrepid Capital.

The table below looks at the funds above that deliver yield, but now since the start of the CV-19 market cycle in January 2020, in order to see how they behaved during the most recent bear. It is sorted by MFO Risk and then MFO Rating and then return. The funds that drew down the least, like TRBFX, ICMUX, and CBLDX, appear to be promising candidates for conservative investors looking for yield.

Most of the site’s new features this month were requested by subscribers:

  • Fund Family Ratings. Carlo Forcione of Putnam Investments suggested we include 1, 3, and 5-year ratings, in addition to lifetime, to better assess the near-term performance of more established families. It’s a good add, which helps adjust expectations. See Families.

  • Fixed Rate Returns. Michael Sullivan of Chesney Sullivan Wealth Advisors suggested we add reference indices to help model an annuity portion of a portfolio. So now in the Portfolios tool, you can input RATE0300 to model say a 10-year MYGA (Multi-Year Guaranteed Annuity), which delivers a fixed 3% return and dividend, along with other funds. See all rates available along with dozens of other reference indices and their convenience symbols, like CASH, SP500, USBOND, on the Definitions page under Reference Indices.

  • Taper Periods. Yet another timely request from Devesh Shah, who publishes the YouTube Channel Understanding Personal Finance. Last July, the Fed announced its intention to begin rolling-back bond purchases. But unlike a similar announcement in 2013, this time there was “no tantrum,” not immediately anyway. To help better assess funds during such times, especially bond funds, we have several evaluation periods, like Taper 1, Normalization 1, Taper 2, Rising Rates. See all available on the Definitions page under Display Period.

One other addition to MultiSearch, the site’s main tool, is Calendar Monthly Return Ratings, which complements the Trend and Momentum metrics.

As always, if you see anything amiss or have suggestions for improvement, let us know and we will respond soonest.

Please enjoy the latest data and features.

Intrepid Income Fund (ICMUX), February 2022

By David Snowball

Objective and strategy

The fund’s goal is to generate current income. In particular, they want to offer an attractively higher yield than comparable maturity US Treasury securities without taking significant default or interest rate risk.

The managers invest primarily in shorter duration corporate bonds, both investment grade, and high yield. They might also own other income-producing securities such as securitized loans and convertible securities. Generally, the majority of securities in the portfolio are part of smaller issues of less than $500 million.

Comments

For investors, there is only one risk: that when the time comes, the sum of their resources will be less than the sum of their needs. Everything else is noise.

For fixed-income investors, there are two sources of risk: the money you’ve lent is not earning enough interest to offset the corrosive effects of inflation, or the people you’ve lent to are not able to repay you. The former is called interest rate risk; the latter is credit risk. In a low-interest rate environment, credit risk may be the lesser of two evils. And in the transition to a rising interest rate one, which combines low current rates with the risk of disruptive rate increases (the ultra-cheap Vanguard Total Bond Market Index Fund lost 1.7% in 2021 then an additional 2% on rate hike fears in just the first three weeks of 2022), it’s all the more worthwhile considering a fund that generates substantial income without courting interest rate risk.

Intrepid Income is one such fund and one of the best in its class.

Intrepid Income’s strategy was launched in the 1990s and became available to mutual fund investors in 2007. Traditionally, it was managed by investors with a strong background in absolute value equity investing. As with funds such as F.P.A. Crescent, they were willing to scour a corporation’s entire capital structure – from common and preferred stock to bonds and loans – to find the most attractive sources of high income and capital appreciation. That led them into “a fairly liberal definition of what it meant to be an income strategy,” according to manager Hunter Hayes, with a fair amount of deep value equity stocks and a willingness to hold substantial cash. While generally successful, that dual focus tended to reduce yield and bump up volatility.

The focus began to change in 2018, with changes in the management team, including the return of Intrepid Capital founder Mark Travis to the manager’s role in November 2018 and the appointment of Hunter Hayes as co-manager in January 2019. Mr. Hayes came from Eaton Vance, where he was an associate on the High Yield team, assisting with the multi-billion dollar Eaton Vance Income Fund of Boston (EVIBX). Before that he’d been a consultant at Deloitte Advisory. Messrs. Travis and Hayes agreed on a bunch of stuff, most notably that:

  1. targeting small issues gave them a useful strategic advantage. Intrepid targets bond issues of $500 million or less, deals which are far too small for major investors like Eaton Vance to even consider. The relative inattention to these smaller offerings meant that mispricing was, if not rampant, common.
  2. the opportunity set was large enough without pursuing much equity exposure. There are, Mr. Hayes argues, lots of sub $200 million issues where they have been able to find yields of 150-200% of those available in larger offerings without any commensurate increase in risk exposure. He points, as an example, to a G.E. bond, part of a tiny $15 million issue, that has three times the yield of other G.E. bonds for the same underlying risk. Something similar occurred with the “deeply busted” convertible securities for a Norwegian shipping company.

At the end of 2021, the portfolio was dominated by three sets of assets.

60% Short-term corporate bonds, both high yield and investment grade. The ratio is high-yield to investment grade was about 4:1

21% convertible securities, which they opportunistically purchase when they’re selling at a discount and are held until they’re in the money. In the worst case, these offer above-market interest because they were bought below par; in the best case, they might offer a bit of capital appreciation.

15% levered loans, quite frequently to cannabis companies. This is a paradigm case of “good businesses that major lenders won’t touch.” They have to pay up.

4% “other,” which includes a smattering of preferred stocks, common equity, and discounted SPACs.

On the whole, that’s been a solid portfolio with a yield-to-maturity of 7.68%. By comparison, the huge Vanguard Corporate Short-Term Bond ETF (VCHS), which targets larger issues and investment-grade debt, sits at 1.5%.

Morning and Lipper have both moved Intrepid between peer groups over time, depending on whether it seems a predominately short-term high yield portfolio or a more opportunistic multi-sector income one. Regardless of which you choose, Intrepid has top tier risk-adjusted returns over time.

Ranking by Sharpe ratio

  3 year 5 year 10 year
Short-term high yield #2 of 17 #2 of 15 #2 of 5
Multi-sector income #6 of 117 #5 of 104 #7 of 61

The only short-term high yield fund with better risk-adjusted returns is RiverPark Short-term High Yield (RPHYX), a great fund but one designed to generate a lower risk-return profile than Intrepid. During the Covid bear market in March 2020, Intrepid Income fell 7.0%, while RiverPark dropped 1.1%. In both cases, that’s their worst-ever drawdown, and it’s hugely superior to the average decline of 9.1% for their peer group. In return for that greater downside risk, Intrepid investors have booked two- to three-times greater gains over time.

Annual percentage returns

  3 year 5 year 10 year
Intrepid Income 7.8% 5.5% 4.3%
RiverPark STHY 2.3% 2.3% 2.8%
Lipper peers 5.5% 4.3% 4.1%

If you are concerned about the prospect of a bear market for conventional (intermediate term, investment grade, domestic) bonds, then it’s reassuring to note that Intrepid operates with unquestioned independence from the market: the firm estimates their “active share” is “essentially 100%,” the fund’s correlation (R-squared) to the bond market is an invisible 0.01, and it has managed a negative downside capture of 30%, which means that the fund has historically risen as the bond market fell.

Bottom Line

The only thing that makes the U.S. stock market marginally attractive is the start of the U.S. bond market. That doesn’t help investors who need income. The “safe” assets and broad aggregate indexes do not seem capable of delivering that income and might not do so for years.

Income investors need to look for funds and ETFs that find income where others aren’t willing or able to look. Funds like Intrepid Income (and, for other investors, RiverPark and Osterweis Strategic Income, another famously independent multi-sector income fund with a 0.85 correlation to Intrepid) are the models to consider. They have clear, risk-conscious disciplines paired with experienced managers who have managed across a variety of economic cycles. They have seen no bankruptcies in portfolio companies in 20+ years and have never “held bad paper.” They consistently produce positive real returns. Their returns are independent of the bond markets, and they’re almost looking forward to the rate hikes which might “give us the opportunity to buy some of the 40 names on our wish list.”

You might add them to yours.

The other details you need to know

Adviser

Intrepid Capital, headquartered in Jacksonville Beach, Florida. The firm was launched in 1994 with an avowed focus on a long-term focus, absolute returns, and deep fundamental company analysis. They provide investment management services to about a hundred high net worth individuals, to three mutual funds, and to two limited partnerships. In all, the firm has about $616.7 million in assets under management.

Managers

Hunter Hayes, CFA and Mark Travis

Mr. Hayes joined Intrepid Capital in 2017. Prior to joining Intrepid, he was a high-yield analyst on a $20 billion Eaton Vance strategy. He is a co-lead portfolio manager here and on the separately managed Intrepid Income portfolio and is also a member of the investment team responsible for the Intrepid Endurance Fund, the Intrepid Capital Fund, and the separately managed Intrepid Small Cap and Intrepid Balanced portfolios. He earned bachelor’s degrees in both finance and piano performance at Auburn and is a C.F.A. charter holder.

Mr. Travis is the firm’s president and founder. He co-manages this fund and the Intrepid Capital Fund, as well as the separately managed Intrepid Balanced portfolio, and the Intrepid Capital, L.P. Mr. Travis began managing this fund at its inception, left the team in 2017, and returned in late 2018. He has 30 years of investment experience.

Strategy capacity and closure

The managers believe the strategy could accommodate $1 billion. Given their special focus on smaller bond issues, they recognize that limiting the strategy size is “super important.”

Management’s stake in the fund

Mr. Travis has invested between $100,000 – 500,000 here, and Mr. Hayes has $10,000 – 50,000.

Opening date

July 2, 2007. The strategy, as distinct from the fund, has been in operation since the 1990s.

Minimum investment

$2,500

Expense ratio

0.91% on assets of $325.3 million, as of July 2023.

Fund website

https://intrepidcapitalfunds.com/strategies/mutual-funds/income/overview/. It’s a pretty sparse site, with almost no new content – other than routine fund documents – posted in the past year or so. For more information, please contact Tommy Isaacs, Vice President, at [email protected] or by telephone (904) 242-5071

© Mutual Fund Observer, 2022. This article reflects publicly available information current at the time of publication. The views and opinions expressed in this article are those of David Snowball of Mutual Fund Observer and do not necessarily reflect the views of Intrepid Capital or its officers. Intrepid has no editorial control over the content of the article or subject matter and is independent of Mutual Fund Observer. For information concerning article reprints or data sources, contact Mutual Fund Observer.

Briefly Noted

By TheShadow

Hi! The Shadow here! I scan SEC filings and other sources for interesting industry developments to share with you. If you see something that you think we should share with readers in the month ahead, drop me a heads-up. If we use it, we’ll happily send an intensely stylish MFO mug to you!

Updates

Smead International Value Fund commenced operations on January 11, 2022. It’s the international version of the five-star Smead Value Fund (SMVLX), and it’s managed by … well, two Smeads. In a fairly awkward sentence, they advertise being a fund for “investors that fear stock market failure through a low-turnover, differentiated value discipline seeking wonderful companies to build wealth.”

The Smeads expressed their dismay with Seattle, whether it’s politics, weather, or coffee, we’re not sure, by relocating to Phoenix, Arizona, in July 2020. At that time, Tony Scherrer, the only non-Smead manager on the funds, declined to move with them and worked remotely. In January 2022, he announced his decision to leave the firm.

Briefly noted

Vanguard Baillie Gifford Global Positive Impact Stock Fund is in registration. They’ll target “businesses that deliver positive change by contributing towards a more sustainable and inclusive world.” This is interesting because it simply moves the five-star Baillie Gifford Positive Change Equities Fund (BPEKX) to Vanguard with a corresponding drop in the investment minimum from $10,000,000 to $3,000.

In a similar vein, Barrow Hanley Concentrated Emerging Markets ESG Opportunities Fund is a converted EM value hedge fund with a pretty strong record. The expense ratio for investor shares will be 1.23%, with a $2,500 minimum.

Oberweis Focused International Growth Fund is in registration. They’ll target 25-30 companies with “above-average long-term growth potential and the potential to exceed consensus analyst expectations.” It will be managed by Ralf A. Scherschmidt, who leads Oberweis International Opportunities (OBIOX), a four-star fund that has pretty much thumped its peers for the 14 years since inception. Institutional for now.

Calamos International Small Cap Growth Fund is in registration. Their universe is “small capitalization, non-U.S. companies, including emerging and frontier markets.” The key risk-managed tool is “top-down diversification by company, industry, sector, country, and currency and focusing on macro-level investment themes.” It will be led by the same team that manages the four-star Calamos International Growth (CIGRX).

Dodge and Cox Balanced Fund will have one designated investment committee, which will manage the entire balanced fund portfolio, rather than two committees. The one committee will be comprised of individuals with expertise in various areas from other committees and a strategy group.

A dozen managers from LMCG Investments are breaking away from their parent (it happens) to form a new investment manager, Leeward Investments. LMCG started life as the venerable Munder Capital (who now remembers Munder NetNet, the epitome of the dot-comm crazies?), then went through a series of predictable name-and-ownership changes over the past 30 years. The breakaway team, headed by Todd Vingers, sub-advises $3 billion in some pretty solid value funds for Touchstone, SEI, and Prudential.

Small Wins for Investors

None noted.

Closing and related inconveniences

None noted.

Old Wine, New Bottles

NT International Small-Mid Cap Fund will change its name on April 1, 2022, to International Small-Mid Cap Fund.

First Eagle of America Fund’s Y class shares (FEAFX) will be converted to A class shares (FEFAX) on February 28, 2022.

Off to the Dustbin of History

Cabot Growth Fund ETF will be liquidated on or about February 2, 2022.

RiverFront Asset Allocation Aggressive and Asset Allocation Moderate Funds were reorganized into the RiverFront Asset Allocation Growth & Income Fund on January 21, 2022.

SIM Income, SIM U.S. Managed Accumulation, and SIM Global Managed Accumulation Funds are to be liquidated on or about February 24, 2002.