The Mutual Fund Observer writes for the benefit of intellectually curious, serious investors— managers, advisers, and individuals—who need to go beyond marketing fluff, beyond computer-generated recommendations, and beyond Morningstar’s coverage universe.
The quote above had a big impact on me in July 2019 when I was first introduced to Mutual Fund Observer, and I became its most enthusiastic fan. I began contributing to the monthly newsletter shortly thereafter. I appreciate the efforts that have gone into creating and maintaining MFO by Professor Snowball, Chip, Charles Boccadoro, Barb Bradac, and Edward Studzinski. You greatly contributed to the financial well-being of so many people. I appreciate that the Premium Service will continue. Thank you.
I would also like to wish all Readers a happy and prosperous New Year. With the MFO newsletter transitioning to new voices after this month, my final article for MFO is the third of a three-part series describing how I have simplified my portfolios using a bucket approach, the business cycle, and of course, the MFO Premium Multi-Screener Tool. Bucket #1 contains three years of living expenses, Buckets #2 and #3 are conservative, traditional IRAs at Vanguard and Fidelity, and Bucket #4 is a tax-efficient after-tax portfolio still in planning. This article describes Bucket #5, which is a Roth IRA managed by Fidelity using the business cycle model.
This article covers the following sections, and readers may skip to the sections of interest. The Key Point is summarized at the beginning of each section for those with limited time.
- Wealth Management Options at Fidelity
- Asset Allocation Strategies through the Business Cycle
- Model Portfolios at Fidelity
- Model Portfolios at Fidelity Institutional
- Fidelity Business Cycle Portfolio
I have created two Watchlists, each with one hundred funds, in MFO Multi-Search for tracking funds available at Fidelity and Vanguard. The Watchlists are available following the Closing in this article along with my ranking of some of these funds based on recent trends. I also identify top-performing funds from Brown Advisory and Grandeur Peaks for further research to determine if I want to add them to the Watchlists.
1. Wealth Management Options at Fidelity
Key Point: There are many Fidelity investment services available to investors with wide ranges of experiences and needs.
I found the post by Bolin “Building a Multi Strategy Portfolio” very
instructive. Building a Multi-Strategy Portfolio – Fidelity Traditional IRA… While this portfolio is just one of his- the “Fidelity Traditional IRA“… I found myself wondering about one sentence he mentioned “a Bucket for a more aggressive Roth IRA managed by Fidelity”… What funds might be in that Roth?-MFO Discussion Board, JonGaltIII
Please see descriptions of those funds included in the “more aggressive Roth managed by Fidelity” in Section #3, Mr. Galt.
I have been using the Fidelity Retirement Calculator for years and discussing retirement planning once a year with a Fidelity Advisor. The Fidelity website for Planning and Advice offers the following services depending upon an investor’s needs:
Table #1: Fidelity Planning Services
| Service | Description | Minimum | Fees |
| Fidelity Go | Robo advisor | $0 | 0.35% > $50,000 |
| Personalized Planning & Advice | Digital investing + coaching | $25,000 | 0.5% |
| Wealth Management | Planning & advice from a dedicated advisor | $250,000 | 0.50%–1.50% |
| Private Wealth Management | Planning & advice from an advisor-led team | $2 million managed through Fidelity Wealth Services | 0.20%–1.04% |
Fidelity offers the option of using an independent advisor and has low-cost index services available. The Fidelity Institutional website covered in this article is for advisors, but it was worth my time to research the site and see what is available. In the Wealth Management services, one of the choices to be made is whether you want a portfolio based on Fidelity Funds, a Blended Approach with funds from other families, and an Index Approach.
In starting a Managed Account, I had a remote working session with my dedicated personal advisor and a Senior Portfolio Specialist to discuss goals and possible solutions. I elected to use the business cycle model portfolio with the Blended Approach for funds. “Investment Team Perspectives” at the Fidelity website provides a good summary each month of the Investment Team’s views including Market Backdrop, Positioning, Performance, and Outlook. They explain changes to allocations that are made.
2. Asset Allocation Strategies through the Business Cycle
Key Point: My base case is a 50% stock and 50% bond and cash portfolio that tilts 15 points higher during the Recovery Stage and 15 points lower in the Late Stage.
At Fidelity, we believe:
-
- Asset allocation is the single most important factor in assessing the long-term risk and return characteristics of a diversified portfolio.
- Efficient portfolio diversification can be one way to lower a portfolio’s risk while maintaining its expected return.
I am a believer in Ed Easterling’s philosophy about secular markets. He is the founder of Crestmont Research and the author of two books on market cycles. Mr. Easterling’s philosophy is that secular bull markets are a time for a “sailing” approach (ie using low-cost index funds), and secular bear markets are a time for a “rowing” approach. Investing along with the business cycle is a form of rowing. I want a portfolio that manages risk based on the business cycle along with the philosophies of Benjamin Graham who advocated having no more than 75%, nor less than 25% allocated to stocks and Howard Marks who advocated adjusting your level of aggressiveness/defensiveness to the environment.
The following table is a good starting point for understanding investing according to the business cycle. The Mid-Cycle is typically the longest. In the current situation with near full employment, higher than normal inflation, loose monetary policy, the foundation is set for monetary tapering and rising rates shifting us into the Late Stage within the next year or two. We should be looking at what does well not only in the Middle Stage of the business cycle but also in the Late Stage with a watchful eye on the next recession.
Figure #1: Typical Business Cycle
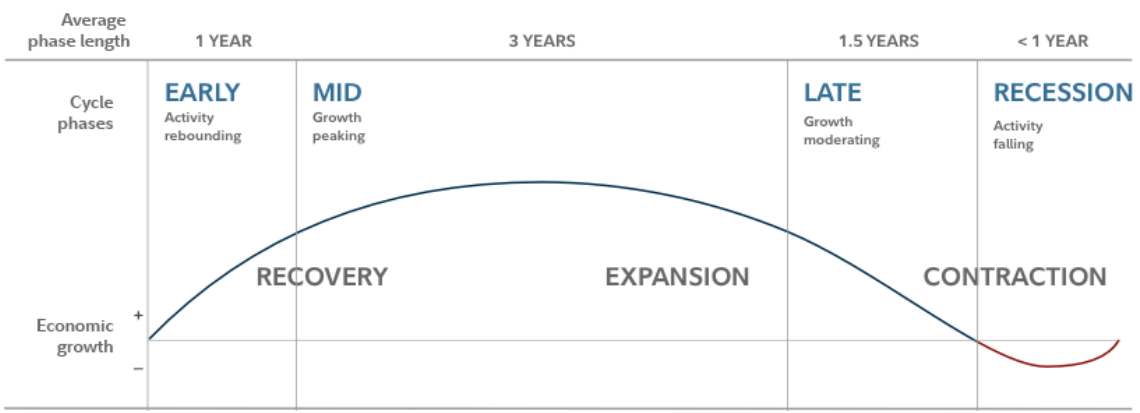
Source: Fidelity
As we move through the business cycle we can rotate through sectors that perform well by stage as shown in Table #2. These sectors can be volatile at inflection points.
Table #2: Sector Performance by Business Cycle Stage
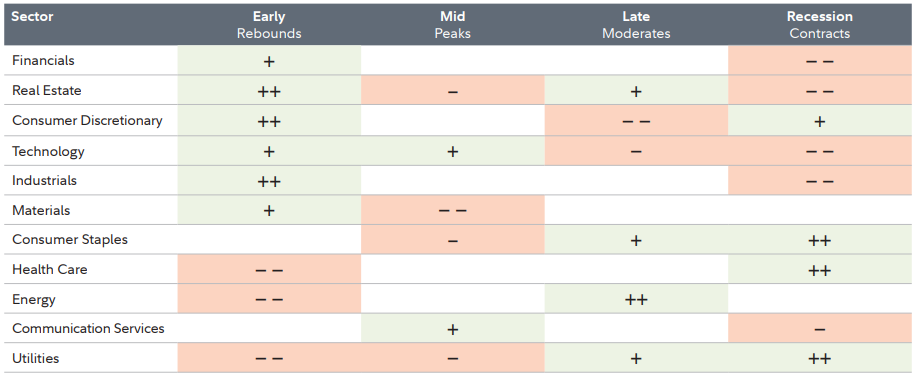
Source: Fidelity
The following chart from The Business Cycle Approach to Asset Allocation by Fidelity Investments quantifies how stocks, bonds, and cash perform compared to a typical portfolio of 50% stocks, 40% bonds, and 10% cash since 1950. The green bar is the average performance, the blue bar is the median performance and the blue diamond (“hit rate”) is the frequency that the asset outperforms the benchmark. Stocks outperform the benchmark portfolio by quite a bit during the Early and Mid-Cycle Stages, but not so much during the late stage. Stocks underperform during a recession.
Figure #2: Asset Class Performance Relative to 50% Stocks/40% Bonds/10%Cash
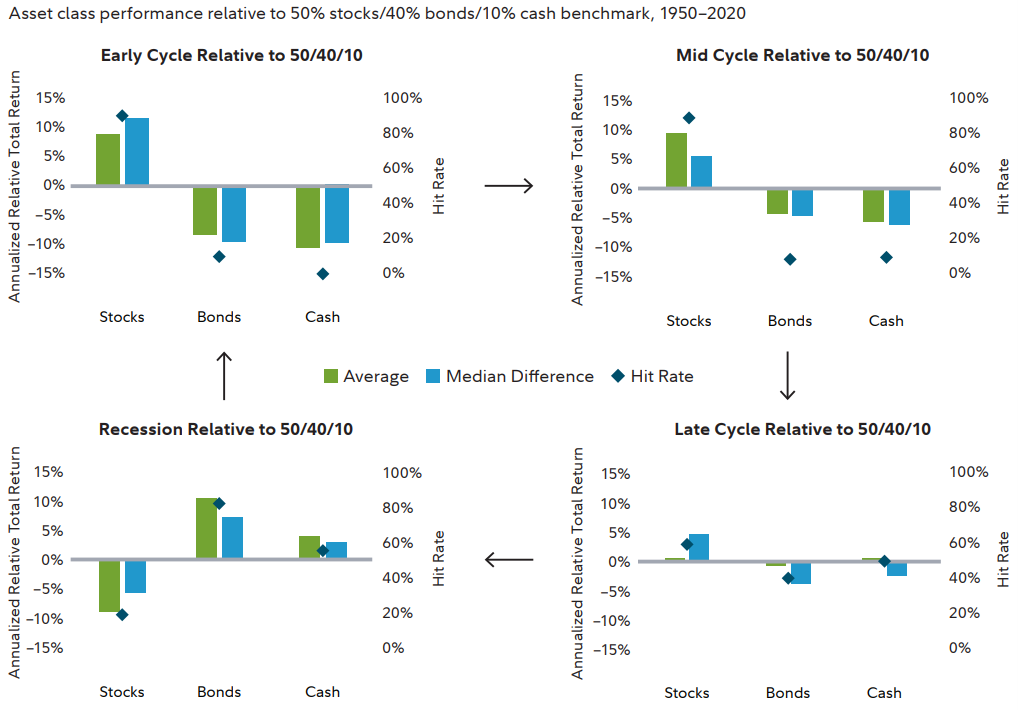
Source: Fidelity
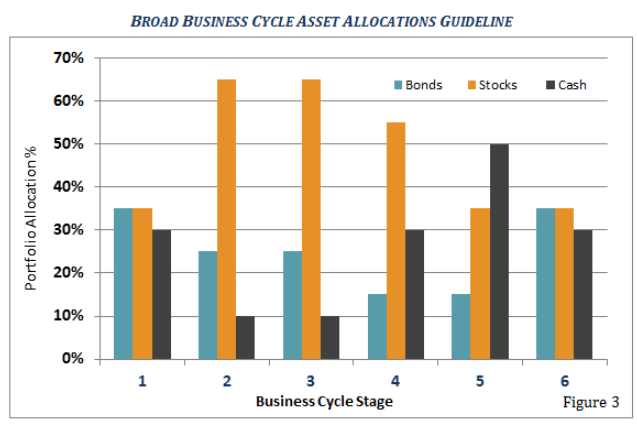
The Figure #3 from Pring Turner Approach to Business Cycle Investing breaks out the business cycle into three stages (1-3) of contraction and Recovery (4), Middle (5), and Late (6) stages of the business cycle. Their allocation guideline begins with increasing allocations to stocks from 35% at the beginning of the contraction to 65% (buy low) as the recovery starts to gain traction and gradually reducing allocations to stocks to 35% by the late-stage (Sell High) of the business cycle. This is great for tax-advantaged accounts may increase taxes in after-tax accounts. I set my target allocation to 50% stocks, 40% bonds, and 10% cash, tilted to 65% stocks coming out of a bear market and down to 35% as the late-stage progresses.
Figure #3: Asset Allocation by Business Cycle Stage
3. Model Portfolios at Fidelity
Key Point: I want a “Balanced” portfolio on average that ranges from “Moderate with Income” during a recession to “Growth with Income” during the Recovery Stage.
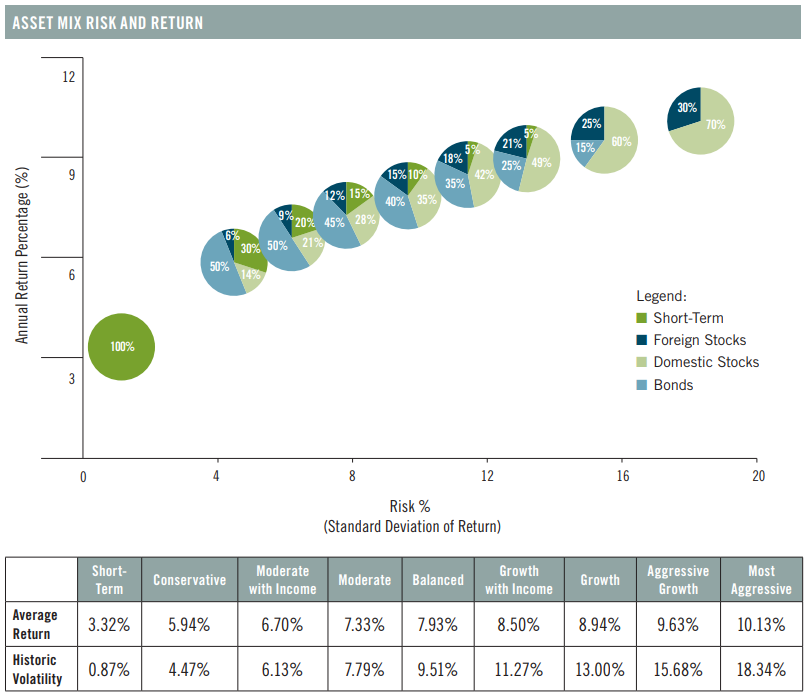
Figure #4 contains the historical return versus volatility. One has to balance life expectancy, short-term needs, and risk tolerance along with the need to save for retirement and other goals. The chart updated for the next decade or two will look dramatically different because of low-interest rates, end of quantitative easing, high valuations, COVID, and possibly inflation.
Figure #4: Target Asset Mixes Return vs Volatility
Source: Fidelity
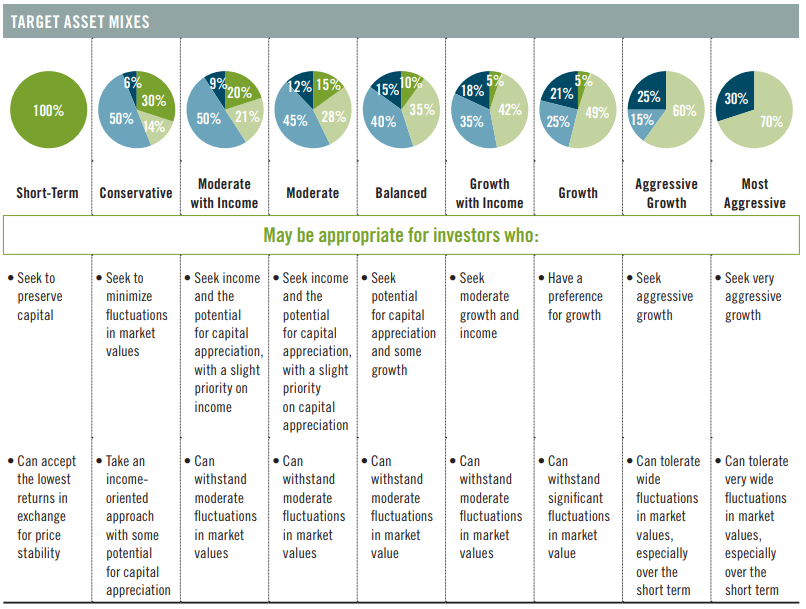
There are many investing ideas at Fidelity to help Do-It-Yourselfers, and those trying to decide if or what type of managed account they want. Figure #5 below from Investment Strategy helps investors decide on their allocation. I want a “Balanced” portfolio on average that ranges from “Moderate with Income” during a recession to “Growth with Income” during the Recovery Stage. Bucket #1 for living expenses will be “Short-Term,” Buckets #2 & #3 (Traditional IRAs) are “Moderate”, and Bucket #5 (Fidelity Managed Roth IRA) is currently “Growth”. Model Portfolios for each of these portfolios will be shown in Section 4.
Figure #5: Target Asset Mixes
Source: Fidelity
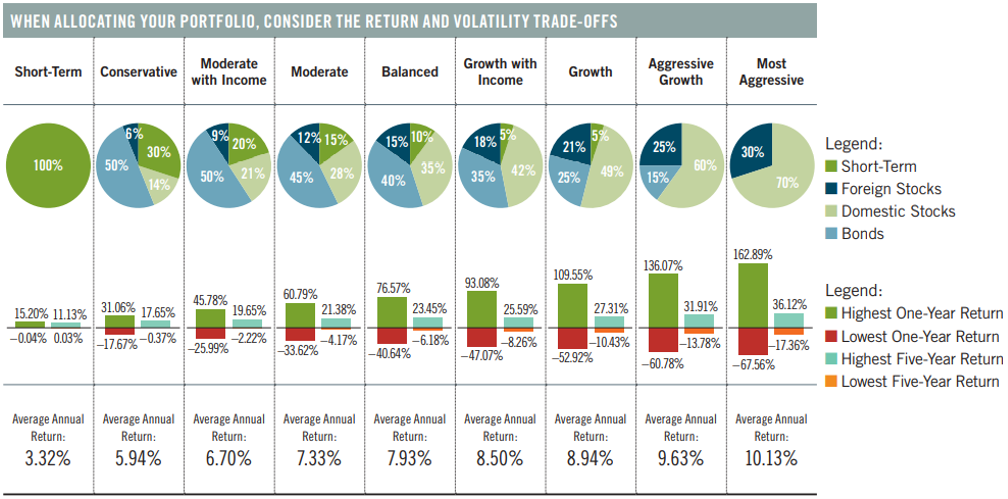
Figure #6 is more valuable for the detail-oriented investor. While the figure includes the extreme of the 1930’s depression, it does show the potential for a balanced portfolio to have negative returns for a five-year period. I find the lowest five-year return of value. Think in terms of relativity. The “Most Aggressive” Portfolio had the lowest five-year return nearly three times worse than a “Balanced” Portfolio with 50% stocks.
Figure #6: Target Asset Mixes Returns and Drawdowns
I used Portfolio Visualizer to show Fidelity and Vanguard Balanced Funds, along with the S&P 500 (SPY), following the Great Financial Crisis. It took three years to get back to ground level for the balanced funds and five years for the S&P 500. The balanced funds had drawdowns of 32 to 40% while the S&P 500 fell over 50%. These are buying opportunities as long as the investor has funds available and fortitude. I believe that a conservative approach will outperform an aggressive approach over the next five to ten years.
Figure #7: Balance Fund Performance vs S&P 500 During the 2008 Recession
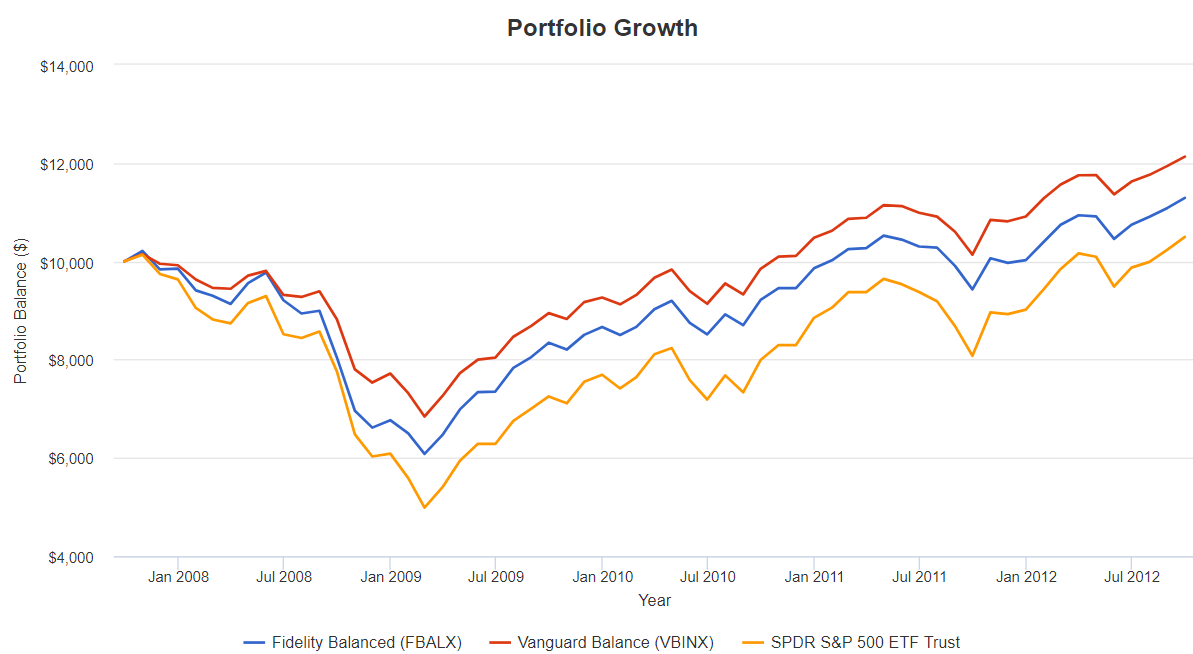
Source: Created by the Author using Portfolio Visualizer
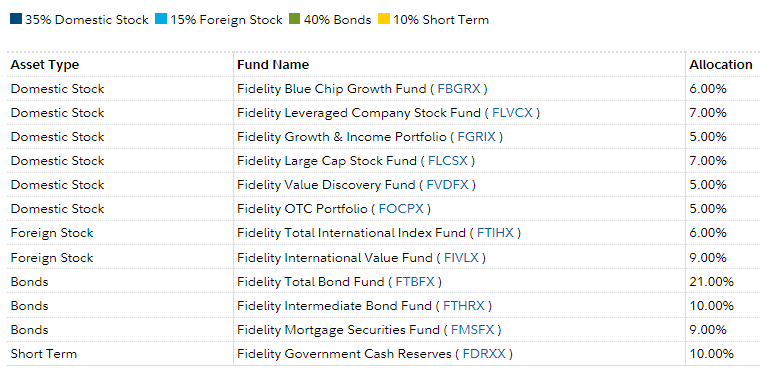
Fidelity Fund Portfolios—Diversified has model portfolios for each of these asset allocations such as this one for the Balanced Portfolio. There are also model portfolios for income and defensive equity.
Table #3: Fidelity Balanced Model Portfolio
4. Model Portfolios at Fidelity Institutional
Key Point: Insights can be gained into how Fidelity manages portfolios by viewing the model portfolios at Fidelity Institutional.
Fidelity Model Portfolios has links to Target Allocation, Business Cycle, Income, Equity, and Bond Models including Blended and Index Focused Models. Details of the funds in these models, as an example, can be found in Fidelity Target Allocation Blended Model Portfolios Detail as shown below.
Table #4: Fidelity Target Allocation Blended Portfolios
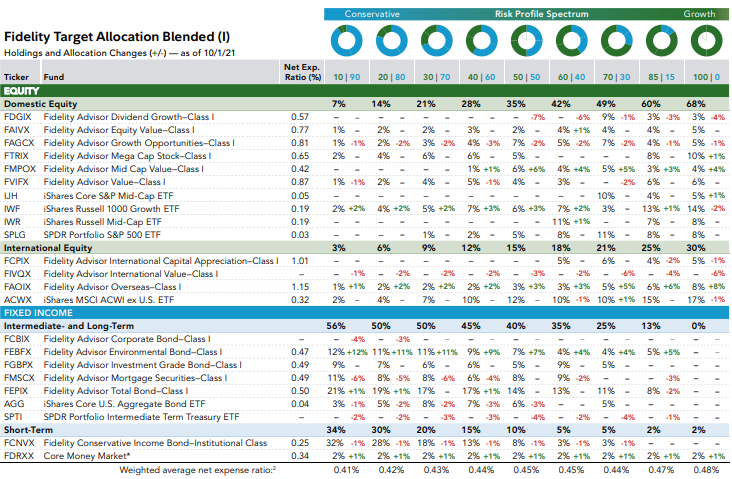
Source: Fidelity
5. Fidelity Business Cycle Portfolio
Key Point: I elected to use a Fidelity Business Cycle Approach in my Roth IRA although it is very different than the one shown in this section.
Fidelity launched business cycle model portfolios in 2019. This section evaluates a Fidelity Multi-Asset Business Cycle Model Portfolio described on the Fidelity Institutional website.
The team’s current view is that we remain in a mid-cycle economic environment, where equities tend to outperform fixed income. The multi-asset model portfolios remain overweight equities and underweight fixed income. In our view, the U.S. economy and activity levels remain strong…
-
Equity allocation in the model portfolios was reduced slightly and exposure to Fixed Income (specifically Investment Grade Bonds and High Yield Bonds) was increased. The roll-off fiscal support, inflationary pressures from supply constraints and a tightening labor market, and moves toward monetary policy normalization contributed to an increased probability of late-cycle…
-
The team believes that inflation may continue to surpass expectations and increased exposure to TIPs and Commodities, which tend to perform well in environments where inflation remains elevated or increases faster than expected…
-
The replacement of sector strategies with diversified U.S. equity managers reduced the sector-risk contribution to total portfolio active risk.
The benchmark allocation between domestic and international equity will change from 60/40 to 70/30.
Table #5: Fidelity Multi-Asset Business Cycle Model Portfolio
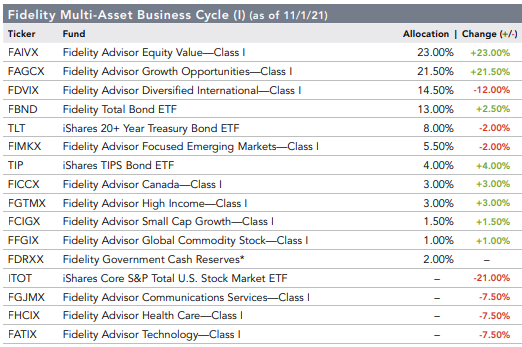
Source: Fidelity
It is not a fair assessment to compare a portfolio with changing allocations to other funds with static allocations. That said, had it had static allocations for the past three years, its performance would have been comparable to the Fidelity Balanced Fund for the past three years which is included as a baseline fund in the table below. MFO Risk classifies it as “Aggressive” (MFO Risk =4).
Table #6: MFO Portfolio Tool with Fidelity Multi-Asset Business Cycle Model Portfolio
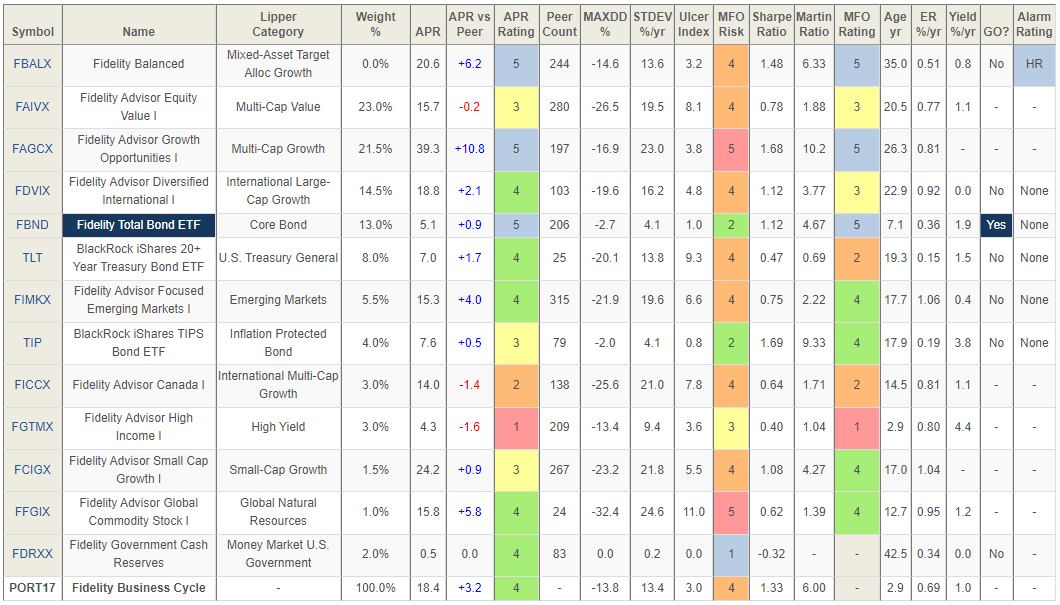
Source: Created by the Author Using MFO Premium portfolio analyzer
Morningstar shows the above business model portfolio to be almost 70 stocks.
Figure #8: Morningstar Analysis of Fidelity Business Cycle Model Portfolio
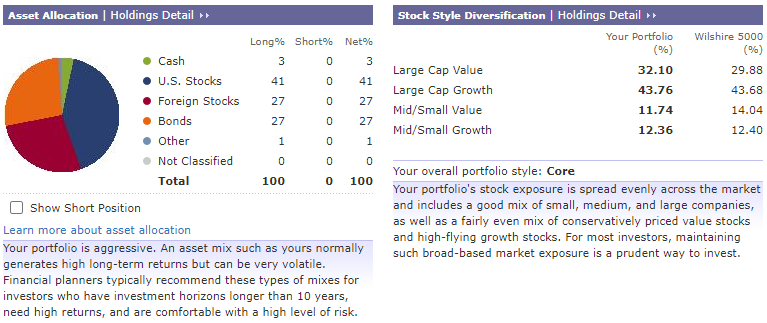
I will summarize my Fidelity Managed Roth IRA as having 75% stocks with 80% of the funds in three traditional Strategic Advisor Funds (domestic stock, international stock, and bonds) and with 20% in a tactical sleeve including mostly small-cap growth and emerging markets, but also a small allocation to high yield bonds. In the short time that I have had the managed account, Fidelity has only made very small changes once a month.
Closing
I reread in the latest MFO, at the end of David’s introductory letter, and there at the end is the notice of a hiatus for the newsletter. I’m sad to see him step away because he put me onto Brown Advisory and Grandeur Peaks funds which have been stellar performers for me, making up 8% of my portfolio. I hope he does periodically offer thoughts about new ideas. Of course, I’ll keep up my premium subscription.
My Friend, Dave H.
These are my sentiments as well, Dave.
These recent articles summarize my journey to transition from a working person to entering retirement in the near future. As a cancer-free cancer survivor, my primary objective is to have a financial advisor that my wife is familiar and comfortable with. I decided to use the Fidelity Wealth services to manage a portion of my portfolio to maximize risk-adjusted returns. Going through the exercise of writing this article helped me to understand the similarities and differences between how Fidelity and I invest and how to merge them into multi-strategy portfolios.
I have enjoyed writing for Mutual Fund Observer and appreciate the support, ideas, and feedback of the many readers in the discussion boards. You have made me a better investor.
To the Sweet Life – La Dolce Vita!
Fidelity and Vanguard Watchlists and Model Portfolios
I described my Traditional IRAs at Fidelity and Vanguard in Building a Multi-Strategy Portfolio – Vanguard Traditional IRA and Building a Multi-Strategy Portfolio – Fidelity Traditional IRA. I have created watchlists of 100 funds for each of the portfolios based on MFO Composite Ratings, Fund Family Rating, Lipper Overall Ratings, Reamer Ratio, and Ferguson Mega Ratio available in MFO Multi-Search. These represent nearly 200 funds in over 90 Lipper Categories. All of the funds except five have histories more than three years of age. The average Fund Family Rating from MFO is 4.4/5.0. This enables me to spend more time looking at which funds will do well going forward and less time looking for funds.
I built a rating system based on Three Month Returns, Three Month Exponential Moving Average, Ten-Month Exponential Moving Average Trend, and Fund Flows. I also made an attempt to classify the funds according to how they perform during each phase of the business cycle. Below are the top funds by rating, excluding funds that do poorly during the Middle, Late, and Recession stages of the business cycle. In November, in the Vanguard Traditional IRA, I exchanged about a quarter of the Vanguard Commodity Strategy (VCMDX) because it has gained a lot during the past year for the Vanguard Wellington (VWELX) Fund. In the Fidelity traditional IRA, I exchanged the Fidelity Freedom 2020 (FFFDX) for the Fidelity Balanced Fund (FBALX) and consumer staples and utility funds.
Fidelity 100 Trending Funds

Vanguard 100 Trending Funds

Fidelity 100 Watchlist:
ACWV, ANWPX, ARTRX, BAMBX, BMNSX, BOND, BOSOX, CDC, CEMB, COM, CRAAX, CTFAX, CWI, DEVDX, DIVO, DLN, DRSK, EAPCX, EMLP, FADMX, FBALX, FBGRX, FBMPX, FBND, FCOR, FDIS, FDRR, FFFDX, FFXSX, FGILX, FHLC, FIREX, FIVFX, FLPSX, FMSDX, FMSFX, FNCL, FNY, FPBFX, FPXI, FSCOX, FSMEX, FSRRX, FSTA, FSUTX, FTABX, FTBFX, FTEC, FTHRX, FTRNX, FUMBX, FXIFX, GUNR, HEFA, HYLS, IAU, ICSH, ICVT, IHDG, IMCG, INFL, IOO, IWL, IWR, JAGLX, JAGTX, JERTX, JPIB, LABAX, LGMAX, NTSX, NWFFX, PHO, PRBLX, PRESX, PRGSX, PRISX, PRMTX, PRSIX, PRSNX, PTIAX, PZRMX, REMIX, RGI, RSP, RTM, SDG, SMMU, SPSB, SPTI, SPY, SUBYX, SWAN, TAIAX, TIPX, TMSRX, TRRIX, TSIAX, WTCOX, XLRE
Vanguard 100 Watchlist:
ACWF, ACWI, AGZ, ARBIX, BAB, BNDW, BNDX, BSV, CDC, COTZX, CRAZX, DODLX, EMXC, EQWL, ESGV, ETIMX, EXCPX, FIW, GSLC, GTO, HEFA, IAGG, IHI, ISTB, IWL, JHMM, LSWWX, ONEQ, PAAIX, PGLOX, PHDG, QQQ, ROUS, RPGEX, SDG, SPLV, SPSB, SPTI, VAW, VBINX, VBK, VCIT, VCMDX, VCOBX, VCR, VCSH, VDC, VDIGX, VEA, VEMBX, VESGX, VFIIX, VFISX, VFITX, VGCAX, VGHCX, VGIT, VGK, VGSH, VGSTX, VGT, VGWAX, VGYAX, VHT, VIG, VIGI, VIPSX, VMBS, VMLTX, VNQ, VNQI, VOE, VONG, VOO, VOT, VPL, VPU, VSGBX, VSGX, VTC, VTCLX, VTHRX, VTI, VTINX, VTIP, VTMFX, VTV, VTWNX, VV, VWAHX, VWELX, VWIAX, VWIGX, VWITX, VWLTX, VWNDX, VWNFX, VWOB, VWSTX, VZICX
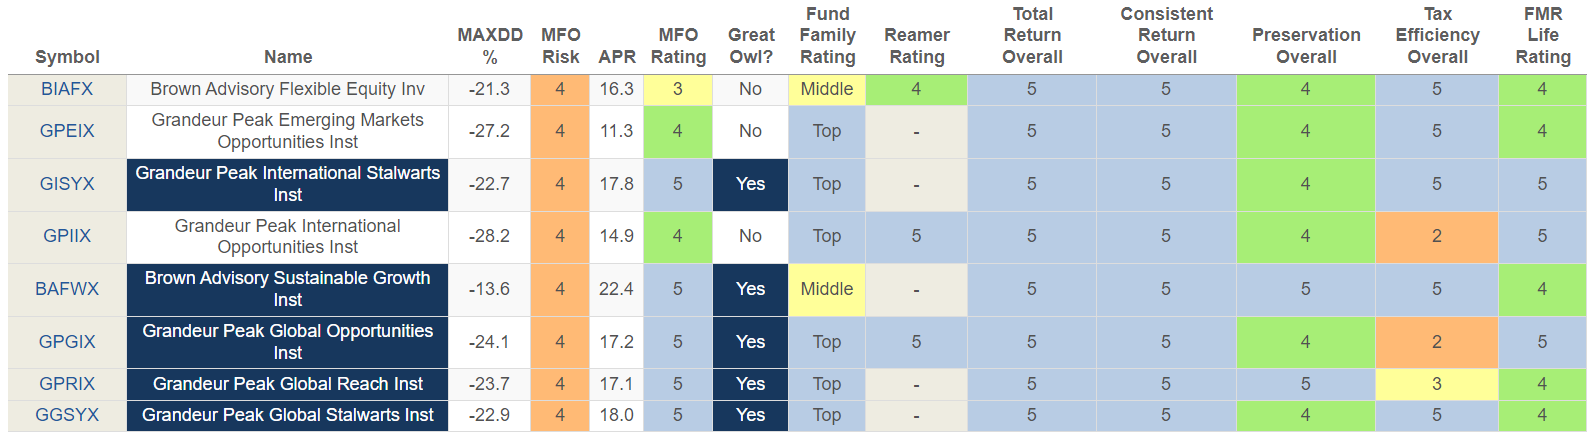
After my friend’s, Dave’s, comment, I extracted top-performing funds at Brown Advisory and Grandeur Peaks to see which might make my Watchlists. The symbols shaded gray are closed to new investors. The links are to articles by David Snowball. There are two emerging market funds of interest that have relatively low exposure to China. The funds are shown in the table below with metrics for six years and ratings for the life of the fund. In order to make my Watchlists, they have to outperform another fund on a risk-adjusted basis without reducing the number of Lipper Categories tracked.
Preliminary Screen Results of Brown Advisory and Grandeur Peaks Funds for further research:
BIAFX, GPEIX, GISYX, GPIIX, BAFWX/BIAWX/BAWAX, GPGIX, GPRIX, GGSYX