


I love reading the monthly discussions from Mr. Bolin. He is providing very useful information month after month. They’re always so insightful and analytical, yet it can be difficult to construct a portfolio because each month brings some new funds and different analyses. It would be very useful if he would have some specific portfolios and update recommended changes when he thinks it’s necessary. This month’s catastrophe portfolio is compelling, and one I may invest in for the long term. As a retiree of many years, it’s just what I want.
– MFO Discussion Board by golub1
I share a personal traditional IRA at Fidelity that I have constructed following Fidelity’s business cycle approach heavily influenced by the risk management philosophy from Mutual Fund Observer. Each investor’s needs are different, and this portfolio is part of a bucket approach as I near retirement with pensions. My Safety Bucket has three years of living expenses, followed by Buckets of conservative Traditional IRAs where taxes will have to be paid, a Bucket for a more aggressive Roth IRA managed by Fidelity where taxes have already been paid, and an after-tax account still in planning.
My strategy is to keep income low after retirement and prior to having to draw required minimum distributions in order to convert a portion of the traditional IRAs to Roth IRAs. After the Closing is a list of articles and references about the funds covered in this article.
1. Reminder of the Long Term Historical Performance
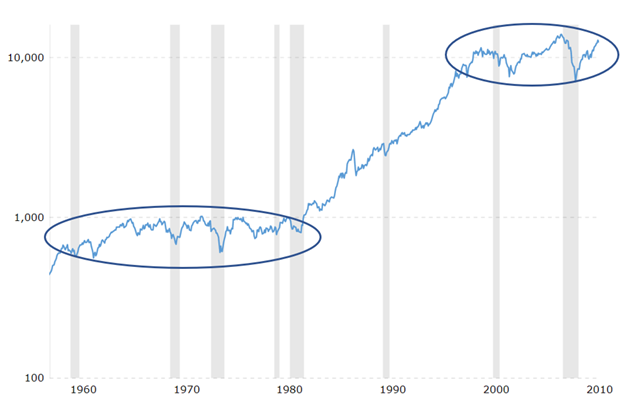
With valuations relatively high, “less than transitionary” inflation, the Federal Reserve tapering QE, and the potential for bond rates to rise, returns are likely to be lower over the next decade similar to the two twenty year time periods where the Dow Jones Industrials was essentially flat as shown in Figure #1. The economy grew, but valuations declined.
Figure #1: Dow Jones Performance Fifty-Year Performance from the 1960s
2. Fidelity’s View of the Business Cycle
Earnings growth seems to have peaked for this cycle, and forward valuations are coming down as well. This is a typical transition in the cycle, which suggests that the rapid ascent of stock prices slows from here…
– Fidelity
The following chart from Mid-Cycle Inflection Point by Jurrien Timmer at Fidelity shows typical patterns when the business cycle enters the middle stage of the business cycle. Earnings continue to grow at a slower rate, valuation multiples compress, and volatility increases. Mr. Timmer goes on to point out that tapering bond purchases could result in bond rates rising which would favor value over growth.
Figure #2: Mid-Cycle Performance
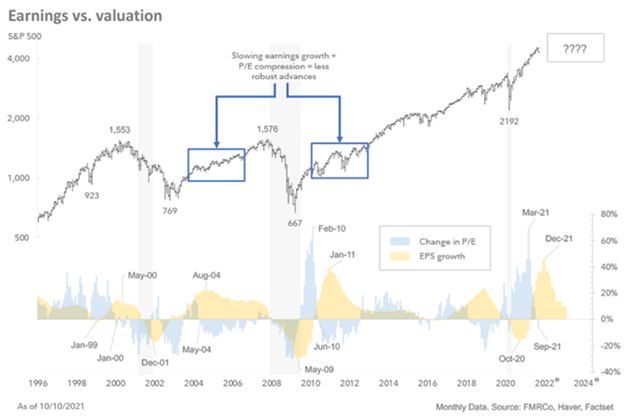
Source: Fidelity
The Middle Stage of the business cycle is typically the longest. Consumer staples, health care, and utilities typically do well in the middle and late stages of the business cycle.
3. Universe of Funds
For this Fidelity Traditional IRA portfolio, I created a Watch List in Mutual Fund Observer Multi-Search Tool of one hundred funds available no-load and with no transaction fees available at Fidelity. They represent 68 different Lipper Categories. Fifty-nine of the funds carry the MFO Great Owl classification. There are 28 Fidelity mutual funds, 40 exchange-traded funds, with the remainder being mutual funds from other fund families. To select the funds, I used the Fidelity Fund Pick List, MFO Risk, MFO APR, MFO Rating, Lipper Preservation, Ferguson Mega Ratio, and Reamer Ratings as shown in the table below.
Table #1: Fidelity 100 Watchlist Metrics
| Rating (Best=5) | MFO Risk | APR Rating | MFO Rating | Lipper Preservation | Lipper Consistency | Ferguson Mega Ratio | Reamer |
| 1 | 13 | 2 | 1 | 0 | 4 | 3 | 3 |
| 2 | 24 | 9 | 1 | 7 | 10 | 11 | 4 |
| 3 | 12 | 18 | 16 | 9 | 10 | 13 | 5 |
| 4 | 45 | 44 | 44 | 37 | 26 | 30 | 16 |
| 5 | 6 | 27 | 38 | 44 | 47 | 32 | 30 |
Source: Created by the Author using MFO Premium screener and data
The Reamer Rating is the quintile ranking of the percentage that a fund’s 3-year rolling returns beat the rolling returns of its category peers over the past 10 years. It is named after Brian Reamer, a Wisconsin-based financial adviser, who uses it to help assess fund performance consistency. The Ferguson Mega Ratio is named after Brad Ferguson of Halter Ferguson Financial, a fee-only independent financial adviser based in Indianapolis, and measures consistency, risk, and expense-adjusted outperformance. Lipper Preservation rating reflects a fund’s historical loss avoidance relative to other funds within the same asset class.
I estimated the typical returns of the funds over the next four years based on average returns by business cycle stage since 1998 if there are two years of mid-cycle performance, one year of late-stage performance followed by a bear market. Core funds (“Steady Eddy”) are funds that I expect to do relatively well over the completion of the business cycle with low drawdown. “Core with a Tilt” funds (such as sectors) are also funds that I would be willing to hold through a bear market, but would probably adjust allocations down. “Rotation funds” are typical late-stage funds (mostly bonds) where investors begin cutting back on risk assets. I include some “Defensive but Not Bearish” Funds that I would consider owning as a recession appears more certain. Finally, there are funds that do well during a recovery but may be highly valued at this time as shown by the returns over the past two years.
Table #2: Fidelity 100 Watchlist By Fund Role
| Purpose | Description | Count | Mid thru Bear Cycle | COVID Bear 2020 | Return Two Year | Price / Book |
| Core | Hold through a bear market | 17 | 8.9 | -9.9 | 15.5 | 7.0 |
| Core with Tilt | Hold through a bear market but tilt allocations (ie sector funds) | 16 | 11.5 | -17.9 | 18.6 | 7.5 |
| Rotation | Late stage rotation to lower risk funds | 37 | 6.3 | -7.4 | 5.5 | 4.2 |
| Defensive | Defensive but not bearish funds | 8 | 0.0 | 14.4 | ||
| Recovery | Funds with inflated values best owned in the recovery stage | 22 | 15.1 | -17.1 | 31.7 | 10.8 |
Source: Created by the Author using MFO Premium screener and data
4. Overview of Selected Funds
Table #3 contains the funds in my Fidelity Traditional IRA. The majority of the funds are “buy and hold” (Core), with five funds that I may rotate over time. Standpoint Multi-Asset Fund (REMIX) is less than two years old, so I will monitor it. The symbols shaded blue have the MFO Great Owl classification. All funds are rated four star or higher by Morningstar except REMIX (Not Rated), CRAAX (3 Stars), and FSRRX (2 Stars).
Table #3: Fidelity Traditional IRA Fund List
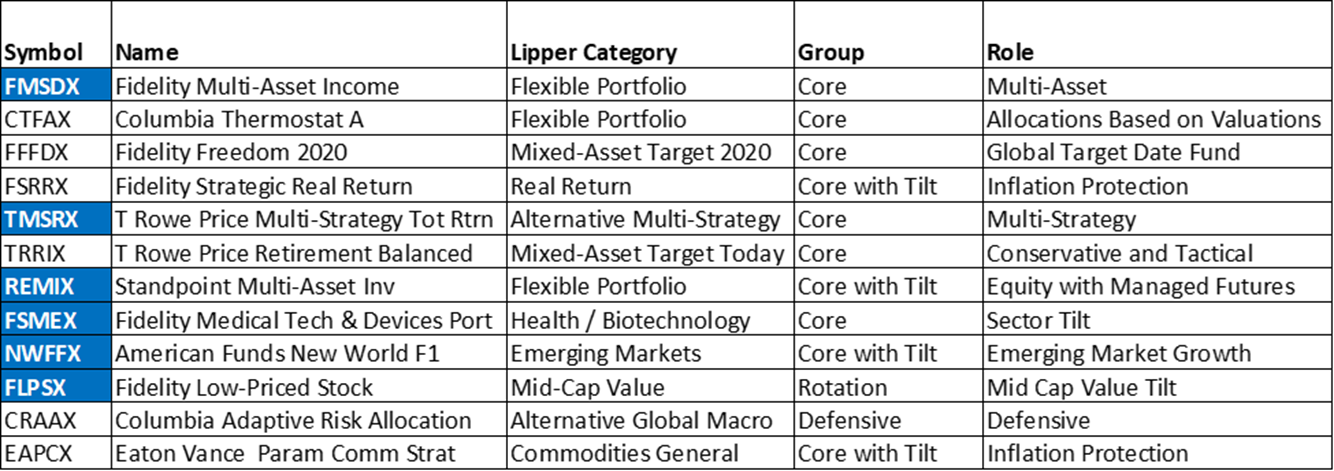
Source: Created by the Author using MFO Premium screener and data
For the middle stage of the business cycle, I am interested in funds that have higher risk-adjusted returns with some momentum. Trend EMA 10 Month shows how the funds are performing relative to their 10-month exponential moving average. They are sorted from highest to lowest. We are now in an inflationary environment and some funds will perform differently as measured by the Percent of the S&P 500 captured. The funds are rated Conservative (MFO = 2) to Moderately Aggressive (MFO Risk = 4). A final check is how the fund has done over the past several years to determine if there is still room to grow. Fidelity Select Medical Technology and Devices (FSMEX) has risen substantially over the past three years which is of concern. T. Rowe Price Multi-Strategy Total Return Fund has low returns year to date, but I hold it for the downside protection.
Table #4: Fund Metrics and Ratings – Life of Fund
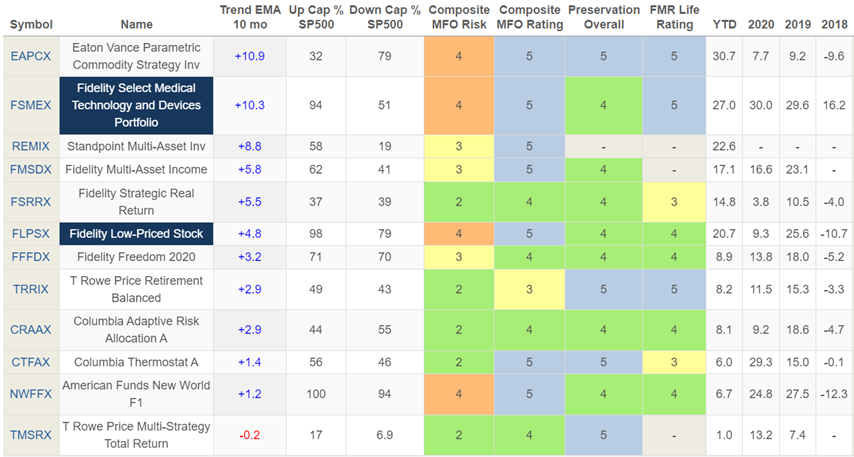
Source: Created by the Author Using Mutual Fund Observer
To be diversified, an investor needs to own, not just more funds, but funds that are not correlated. Table #5 shows that FMSDX, FFFDX, FSRRX, TRRIX, NWFFX and FLPSX are more correlated to one another while CTFAX, TMSRX, REMIX, FSMEX, CRAAX, and EAPCX are less so.
Table #5: Correlations – 1.8 Years
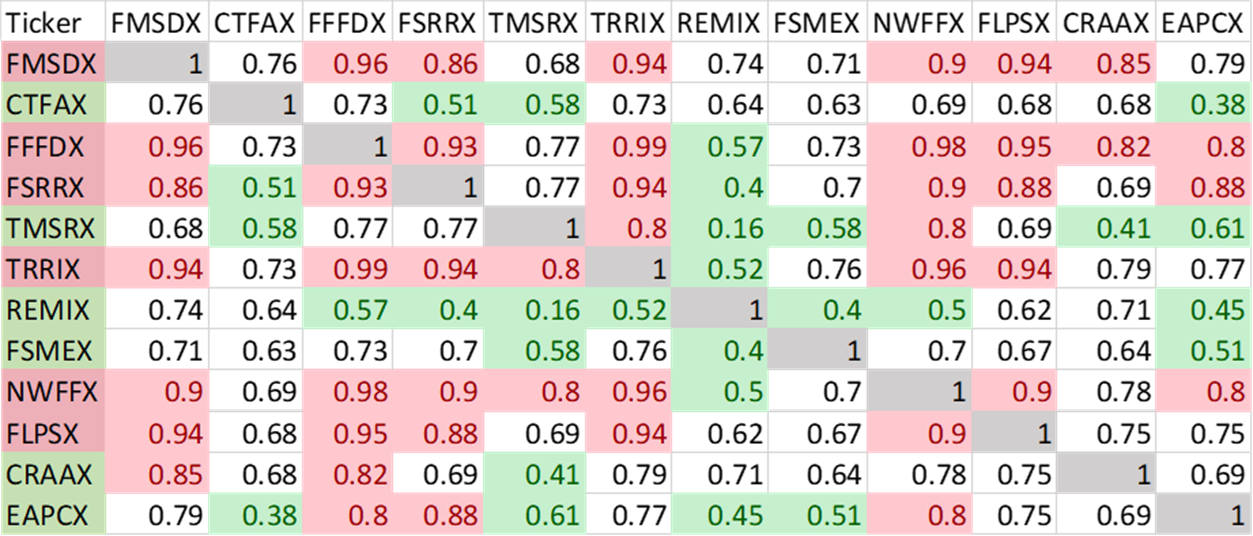
Source: Created by the Author using Portfolio Visualizer
5. Fidelity Traditional IRA
The Portfolio is 33% domestic stocks, 17% international stocks, 40% bonds, 6% short-term investments (cash), and 4% other (commodities). Columbia Thermostat (CTFAX) is currently 90% bonds and will increase allocations to stocks in a bear market. Fidelity Target Retirement 2020 will become more conservative over time.
I used Portfolio Visualizer to compare this portfolio to one that maximizes return at 10% volatility, one that maximizes the Sharpe Ratio, and Fidelity Asset Manager 60% stock. In general, the Portfolios have lower drawdown and slightly higher returns than the Fidelity Asset Manager 60% Fund. The advantage is that there are funds that will have lower drawdowns during bear markets when I have to start taking required minimum distributions. Funds that have a large drawdown during the next few years represent an opportunity to convert to a Roth IRA. The link to Portfolio Visualizer is here. Note that this Portfolio is more aggressive than I would have held two years ago. At that time, with falling interest rates, I preferred bonds.
Figure #3: Portfolio Growth
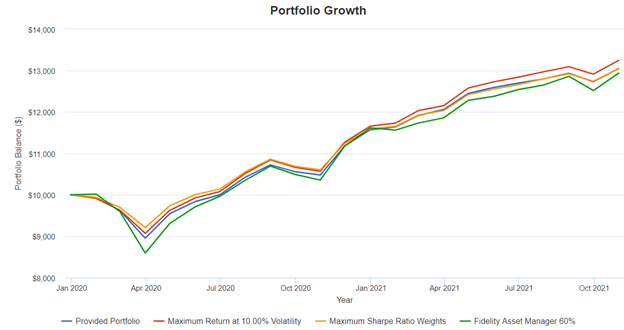
Source: Created by the Author using Portfolio Visualizer
Investors who want to be more aggressive than I am may choose to allocate more to those funds in the Maximum Return at 10% Volatility Portfolio, while those who want to be more conservative may choose allocations closer to the Maximize Sharpe Ratio Portfolio.
Table #6: Fidelity IRA Allocations and Performance Metrics
| Symbol | Name | Alloca-tion | Maximum Return at 10% Volatility | Maximum Sharpe Ratio Weights | Fidelity Asset Manager 60% |
| FMSDX | Fidelity Multi-Asset Income | 18% | 20% | 20% | |
| CTFAX | Columbia Thermostat A | 10% | 15% | 15% | |
| FFFDX | Fidelity Freedom 2020 | 10% | 15% | ||
| FSRRX | Fidelity Strategic Real Return | 10% | |||
| TMSRX | T. Rowe Price Multi-Strtgy Ttl Ret | 11% | 15% | 15% | |
| TRRIX | T. Rowe Price Retirement Balanced | 10% | 15% | ||
| REMIX | Standpoint Multi-Asset Investor | 9% | 10% | 10% | |
| FSMEX | Fidelity Medical Tech and Devcs | 5% | 5% | 5% | |
| NWFFX | American Funds New World F1 | 5% | 5% | ||
| FLPSX | Fidelity Low-Priced Stock | 5% | |||
| CRAAX | Columbia Adaptive Risk Allocation | 4% | 5% | 10% | |
| EAPCX | Parametric Commodity Strategy Investor | 3% | 10% | 10% | |
| RETURNS | |||||
| 3 Month | 0.3% | 0.4% | 0.7% | -0.2% | |
| YTD | 10.0% | 10.3% | 10.3% | 7.8% | |
| 1 year | 20.6% | 20.8% | 19.7% | 19.3% | |
| Annualized Return (CAGR) | 15.6% | 16.8% | 16.0% | 15.1% | |
| METRICS | |||||
| Standard Deviation | 10.6% | 10.0% | 9.1% | 13.9% | |
| Max. Drawdown | -10.5% | -9.1% | -8.0% | -14.2% | |
| Sharpe Ratio | 1.4 | 1.6 | 1.7 | 1.1 | |
| Sortino Ratio | 2.5 | 3.1 | 3.3 | 1.7 | |
Source: Created by the Author using Portfolio Visualizer
6. Closing
I have simplified my Vanguard Traditional IRA with a “buy and hold” strategy with a few funds for rotation with the business cycle. The Fidelity Traditional IRA described in this article consists of funds that are managed more tactically to let the fund managers do the heavy lifting for me. I can download the Fidelity Watchlist of one hundred funds from Mutual Fund Observer and rank them in a matter of minutes.
Laissez les bons temps rouler!
Let the Good Times Roll!
7. Additional Information Resources
The following table contains articles describing the funds in the Fidelity Traditional IRA Portfolio. The funds were selected based on my belief that they will perform well going forward.
Table #7: Articles about Funds
Source: Created by the Author