


Correlation measures the relationship between two assets such as stocks and bonds and has a value of +1.0 for two assets that are perfectly correlated and -1.0 for two assets that move in the opposite direction. The most common example of correlation is that the S&P 500 has a correlation of about zero to US Bonds. The balanced 60 stock and 40 bond portfolio is familiar to investors as a way of building a portfolio of these two uncorrelated assets. In this article, I search for uncorrelated funds with good performance over time that can be used to reduce the risk in a portfolio.
1. Correlation of Asset Classes and Selected Funds
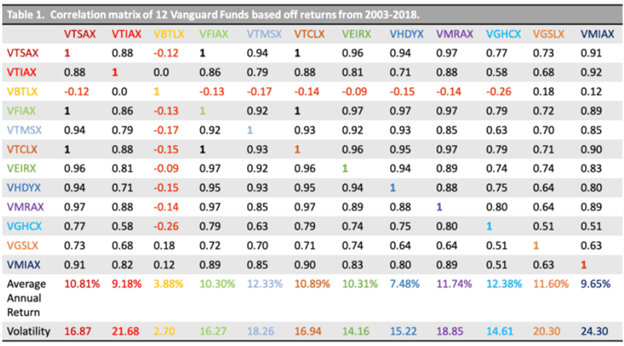
In researching correlation for this article, I ran across an interesting blog called Keep Investing $Imple, $Tupid (Ki$$) by Dan who is a US Army Officer and Physical Therapist. It shows the Correlation Matrix of selected Vanguard Funds. Note that most funds are highly correlated to the S&P 500 and each other with the exception of Bonds, and to a lesser extent Real Estate and Health Care.
Table #1: Correlation Matrix of 12 Vanguard Funds
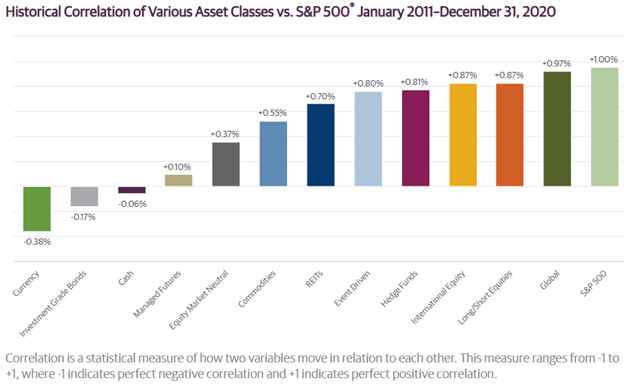
This Asset Class Correlation Map by Guggenheim shows funds that are not correlated to the S&P 500 more clearly. Currency, Cash, Managed Futures, Market Neutral and Commodity funds can be added to the list of funds that are uncorrelated to the S&P 500.
Figure #1: Uncorrelated Asset Classes
2. Uncorrelated Funds with Consistent Performance
For this article, I filtered the thousand funds that I track each month to find those that have a correlation of 0.85 or less to both the S&P 500 and US Bonds. This alone filters out most of the funds. I reduced the list further based on Consistency, Capital Preservation, MFO Risk Rating, and MFO Rank, among others. I also used a minimum three-year return of 5%. I added Columbia Adaptive Risk (CRAZX, CRAAX) because it is one of the funds that I am interested in as a potential purchase.
Table #2 shows the final list of funds that have performed consistently well with low correlations to the S&P 500 and bonds. They are sorted from least risky, as measured by the Ulcer Index to the riskiest. Those with an Ulcer Index shaded green are the least risky while those shaded red have an Ulcer Index equal to or higher than the S&P 500. The Martin Ratio measures the return for the level of risk taken. The funds with the lowest Ulcer Index generally tend to have higher Martin Ratios, meaning that they have higher risk-adjusted-performance. The notable exception is Pacer Trendpilot 100 (PTNQ) which has an Ulcer Index similar to the S&P 500, but higher risk-adjusted return. Six of the funds have Mutual Fund Observer designations of being a “Great Owl” which means that the fund has been in the top 20% of its category for risk-adjusted returns for the past three years. Almost all of the funds are in the top two quintiles of the MFO Rank for risk-adjusted performance for the category.
Table #2: Least Correlated Funds with Consistent Performance
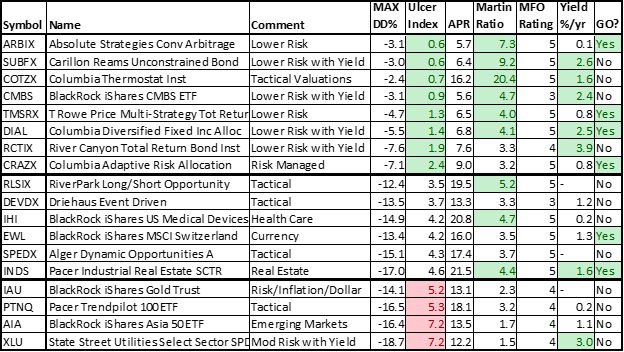
Source: Author Using Mutual Fund Observer
The Funds are limited to those available at Fidelity. RiverPark Long/Short Opportunity (RLSIX, RLSFX), Carillon Reams Unconstrained Bond I (SUBFX, SUBYX), Columbia Thermostat Inst (COTZX, CTFAX), and Columbia Adaptive Risk Allocation Inst (CRAZX, CRAAX) are available at Fidelity as the second share class shown in the parenthesis. River Canyon Total Return Bond (RCTIX), Absolute Strategies Convertible Arbitrage Inst (ARBIX), and Natixis Loomis Sayles Strategic Alpha Y (LASYX) have transaction fees.
The next table shows the correlation to the S&P 500 over the past 3, 5, 10, and 15 years sorted from highest to lowest. The correlation has remained consistent over longer time periods. The Columbia Adaptive Risk Allocation Fund (CRAZX, CRAAX) has a low Ulcer Index, but the highest correlation to the S&P 500. This means that that it will move in the same direction as the S&P 500, but generally will suffer less than half of the drawdown. The T. Rowe Price Multi-Strategy Total Return Fund has had an even lower Ulcer Index of 1.3 and a much lower correlation to the S&P 500.
Table #3: Funds Over Different Time Periods
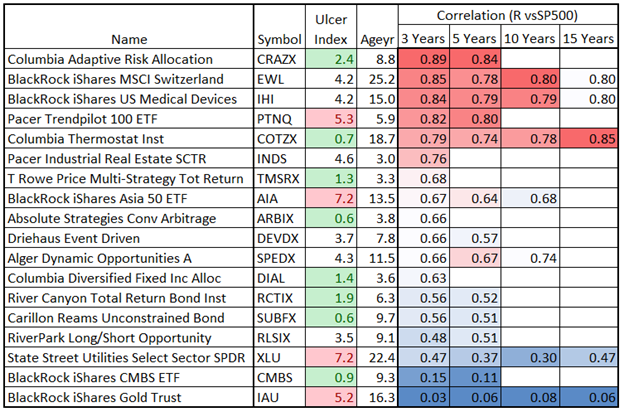
Source: Author Using Mutual Fund Observer
Below is the correlation matrix which compares the correlation for three years of each of the funds to each of the others. The table is broken into S&P 500 and Bond Baseline funds at the bottom, and low, medium, and high-risk funds. Pairs of funds that are the least correlated will tend to reduce the volatility in a portfolio. These are shaded red and yellow.
Table #4: Correlation Matrix of Funds with Low Correlation to the S&P 500
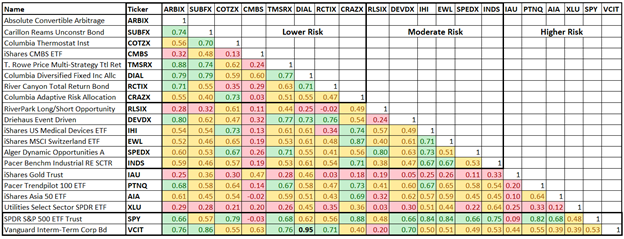
Source: Author Using Portfolio Visualizer
3. Portfolios with Uncorrelated Funds
Suppose that you want to own Janus Balanced (JABAX), T. Rowe Price Spectrum Conservative Allocation (PRSIX), Columbia Thermostat (COTZX, CTFAX) which were profiled in One Stop Shop Mutual Fund Options With Good Multi-Year Metrics along with the SPDR S&P 500 ETF (SPY) and Vanguard Intermediate Term Corporate Bond Fund (VCIT), and are interested in adding one or more uncorrelated funds to reduce volatility. I used Portfolio Visualizer to build a moderate and conservative portfolio as shown below. The link to Portfolio Visualizer is provided here. Interested Readers may change the constraints to suit their own preferences.
Figure #2: Moderate (14% Volatility) and Conservative (Maximum Sharpe Ratio) Portfolios
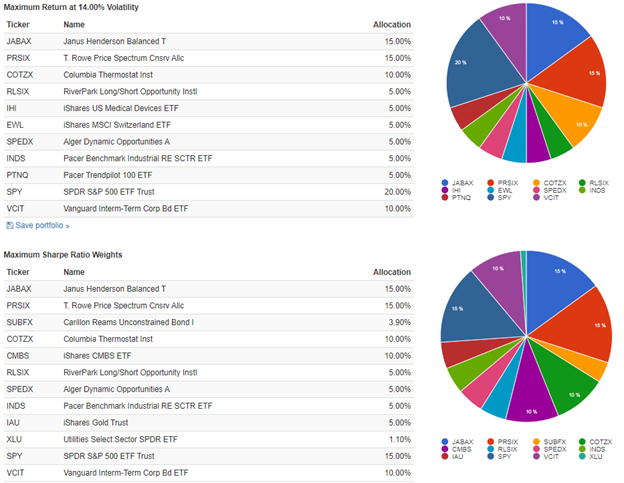
Source: Author Using Portfolio Visualizer
The metrics of the Conservative and Moderate Portfolios are compared to the Fidelity Balanced Fund (FBALX) in Table #5 and the growth of $10,000 is shown in Figure #3. Note that the Moderate Portfolio (Maximum Return at 14% Volatility) only has a standard deviation of 11% compared to 14% for FBALX, but has comparable returns.
Table #5: Moderate (14% Volatility) and Conservative (Maximum Sharpe Ratio) Portfolios
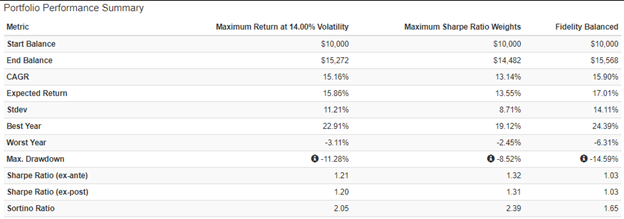
Source: Author Using Portfolio Visualizer
Figure #3: Moderate (14% Volatility) and Conservative (Maximum Sharpe Ratio) Portfolios
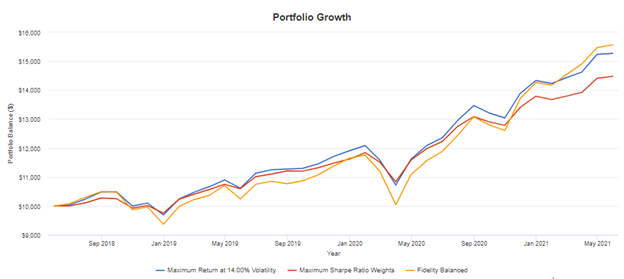
Source: Author Using Portfolio Visualizer
4. Additional Information About Funds
The following sources of information are available for those interested in learning more about some of these funds:
Your 2019 funds watchlist: Draft #1 (RLSIX) by David Snowball
Reviewing Your Portfolio Hedges (RLSIX) by David Snowball
T. Rowe Price Multi-Strategy Total Return (TMSRX) by David Snowball
The Long (and Short) of It: Top-Tier Long-Short Options (RLSIX) by David Snowball
Getting What You Paid For: High capture ratio funds (RLSIX) by David Snowball
Alternative and Global Funds during a Global Recession by Lynn Bolin
Carillon Reams Unconstrained Bond Fund (SUBFX)
Columbia Thermostat Fund (COTZX/CTFAX)
Columbia Adaptive Risk Allocation Fund (CRAZX)
Pacer Benchmark Industrial Real Estate SCTR ETF (INDS)
Pacer Funds Trust – Pacer Trendpilot 100 ETF (PTNQ)
River Canyon Total Return Bond Fund Institutional Class (RCTIX)
5. Closing
As I near retirement, I continue to build a low-risk portfolio of mixed-asset funds as the core “buy and hold” funds. The best funds are described in One Stop Shop Mutual Fund Options With Good Multi-Year Metrics. I have added a Tactical Sleeve as described in Tactical Sleeve for the Conservative Minded.
The third focus of my portfolios is an uncorrelated portion as described in this article. Three of the Funds that I own make the list of “Best Uncorrelated Funds”. These are Absolute Strategies Convertible Arbitrage (ARBIX), T Rowe Price Multi-Strategy Total Return (TMSRX), and Columbia Thermostat (COTZX, CTFAX). I use Watchlists on Mutual Fund Observer Multi-Search to track the performance of these funds each month. The funds can also found in the Portfolios in the Author’s Profile when I write an article on Seeking Alpha such as The Best Mixed-Asset Funds.
Best Wishes and Stay Safe!