Dear friends,
As you read this, I’ll be wading through a drift of candy wrappers, wondering if my son’s room is still under there somewhere. Weeks ago my local retailers got into the Halloween spirit by setting up their Christmas displays and now I live in terror of the first notes of that first Christmas carol inflicted over storewide and mall-wide sound systems.
But between the two, I pause for thanksgiving and Thanksgiving. I’m thankful for all the things I don’t have: they’re mostly delusion and clutter. I’m thankful for the stores not open on Black Friday (REI most recently) just as I’m thankful for the ones not open on Sundays (Fareway grocery stores, locally); we’ve got to get past the panic and resentment that arises if there’s a whole day without shopping. I’m grateful for those who conspire to keep me young, if only through their contagious craziness.  I’m grateful for gravy, for the sweet warmth of a friend hugged close, for my son’s stunning ability to sing and for all the time my phone is turned off.
And I’m grateful, most continually, for the chance to serve you. It’s a rare honor.
Had I mentioned apple pie with remarkably thick and flaky crust? If not, that’s way up on the list too.
There’s a break in the rain. Get up on the roof!
… a bear market is not the base case for most of Wall Street. Adam Shell, 9/29/15
Duh. Cheerleaders lead cheers.
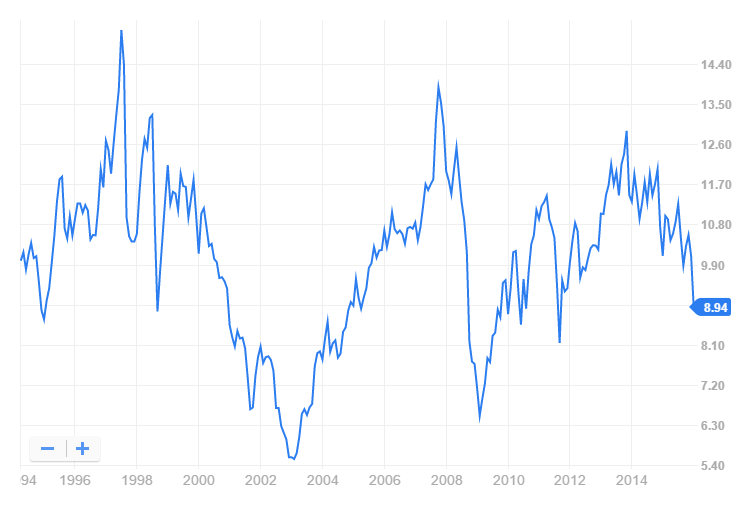
Good news: the sun is out. The Total Stock Market Index (VTSMX) soared 7.84% in October, offsetting a 7.29% decline in the third quarter. It’s now above water for the year, through Halloween, with a return of 1.8%. Optimists note that we’re now in the best six months of the year for stocks, and they anticipate healthy gains.
Bad news: none of the problems underlying the third quarter decline have changed.
We have no idea of whether the market will soar, stagger or crash over the next six months. Any of those outcomes are possible, none are predictable. Morningstar’s John Rekenthaler argues that the market isn’t priced for an imminent crash (“Are US stocks overripe?” 10/30/2015). BlackRock’s chief strategist agrees. The Leuthold Group says it’s “a bear until proven otherwise” but does allow for the prospect of a nice, tradable bounce (10/7/2015).
A lot of fairly serious adults are making the same argument: crash or not, the U.S. stock market is priced for futility.
GMO estimates (as of 10/14/2015) US real returns close to zero over the next 5-7 years. They estimate that high quality stocks might make 1% a year, small caps will be flat and large caps in general will lose nearly 1% a year. Those estimates assume simple reversions to long-term average profit margins and stock prices, both of which have been goofed by the Fed’s ongoing zero rate policy.
Jack Bogle (10/14/2015, warning: another auto-launch video) likewise thinks you’ll make about zero. His calculation is a rougher version of GMO’s. Investment gains are dividends plus earnings growth. An optimist would say 2% and 6%, respectively. Bogle thinks the 6% is too optimistic and pencils-in 5%. You then inflate or deflate the investment returns by changes in valuations. He notes that a P/E of 15 is about normal, so if you buy when the P/E is below 15 you get a boost. If you buy when the P/E is above 15, you get a penalty. By his calculations, the market P/E is about 20.
So you start with a 7% investment return (2% + 5%) and begin making deductions:
- P/E contraction would cost 3% then
- inflation might easily cost 2%, and of course
- fund fees and expenses cost 1%, after which
- stupid investor behavior eats 1.5%.
That leaves you with a “real” return of about zero (which at least cuts into your tax bill).
Henry Blodget was the poster child for the abuses of the financial markets in the 1990s. He went on to launch Business Insider, which became the web most popular business news site. It (well, 88% of it) was just sold to the German publisher Axel Springer for $340 million.
Blodget published an essay (10/4/2015) which concluded that we should anticipate “weak” or “crappy” returns for the next decade. The argument is simple and familiar to folks here: stocks are “fantastically expensive relative to most of recorded history.” Vigorous government intervention prevented the phenomenal collapse that would have returned market valuations to typical bear market lows, building the base for a decades-long bull. Zero interest rates and financial engineering conspired to keep stocks from becoming appropriately loathed (though it is clear that many institutional investors are, for better or worse, making structural changes in their endowment portfolios which brings their direct equity exposure down into the single digits).
Adding fuel to the fire, Rob Arnott’s group – Research Affiliates – has entered the debate. They are, mildly put, not optimistic about US stocks. Like Leuthold and unlike Blodget, they’re actually charged with finding way to invest billions ($174 billion, in RA’s case) profitably.
Key points from their latest essay:
- “High stock prices, just like high house prices, are harbingers of low returns.
- Investing in price-depressed residential rental property in Atlanta is like investing in EM equities today-the future expected long-term yield is much superior to their respective high-priced alternatives.
- Many parallels exist between the political/economic environment and the relative valuation of U.S. and EM equities in the periods from 1994 to 2002 and 2008 to 2015.
- Our forecast of the 10-year real return for U.S. equities is 1% compared to that of EM equities at 8%, now valued at less than half the U.S. C A P E.”
 Bottom line: Leuthold – bear’s at the door. GMO – pretty much zero, real, with the prospect of real ugliness after the US election. Bogle – maybe 2% real. Blodget – “crap.” Research Affiliates – 1%.
For most of us, that’s the hole in the roof.
Recommendation One: fix it now, while the sun’s out and you’re feeling good about life. Start by looking at your Q3 losses and asking, “so, if I lost twice that much in the next year and didn’t get it back until the middle of President Trump’s second term, how much would that affect my life plans?” If you lost 3%, imagine an additional 6% and shrug, then fine. If you lost 17%, deduct another 34% from your portfolio and feel ill, get up on the roof now! In general, simplify both your life and your portfolio, cut expenses when you can, spend a bit less, save a bit more. As you look at your portfolio, ask yourself the simple questions: what was I thinking? Why do I need that there? Glance at the glidepaths for T. Rowe Price’s retirement date funds to see how really careful folks think you should be invested. If your allocation differs a lot from theirs, you need to know why. If you don’t know your allocation or don’t have one, now would be the time to learn.
Recommendation Two: reconsider the emerging markets. Emerging markets have been slammed by huge capital outflows as investors panic over the prospect that China is broken. Over a trillion dollars in capital has fled in fear. The “in fear” part is useful to you since it likely signals an overshoot. The International Monetary Fund believes that the fears of Chinese collapse are overblown. Josh Brown, writing as The Reformed Broker, raises the prospect of that emerging markets may well have bottomed. No one doubts that another market panic in the U.S. will drive the emerging markets down again.
That having been said, there’s also evidence that the emerging markets may hold the only assets offering decent returns over the remainder of the decade. GMO estimates that EM stocks (4.6% real/year) and bonds (2.8% real/year) will be the two highest-returning asset classes over the next five-to-seven years. Research Affiliates is more optimistic, suggesting that EM stocks are priced to return 7.9% a year with high volatility, about 1.1% in the US and 5.3% in the other developed markets. Leuthold finds their valuations very tempting. Bill Bernstein (auto-launch video, sorry), an endlessly remarkable soul, allows “They are cheap; they are not good and cheap … It’s important for small investors to realize that you can’t buy low unless you are willing to deal with bad news.”
Look for ways of decoupling from the herd, since the EM herd is a particularly volatile bunch. That means staying away from funds that focus on the largest, most liquid EM stocks since those are often commodity producers and exporters whose fate is controlled by China’s. That may point toward smaller companies, smaller markets and a domestic orientation. It certainly points toward experienced managers. We commend Driehaus Emerging Markets Small Cap Growth (DRESX), Seafarer Overseas Growth & Income (SFGIX and Matthews Asia Strategic Income (MAINX) to you.
A second approach is to consider a multi-asset or balanced fund targeting the emerging markets. We know of just a handful of such funds:
- AB Emerging Markets Multi-Asset Portfolio (ABAEX), AllianceBernstein.
- Capital Emerging Markets Total Opportunities Fund (ETOPX) – a boutique manager affiliated with the American Funds. Capital Guardian Trust Company
- Dreyfus Total Emerging Markets (DTMAX)
- Fidelity Total Emerging Markets (FTEMX)
- Lazard Emerging Markets Multi-Asset (EMMIX)
- PIMCO Emerging Multi Asset (PEAWX) The fund was liquidated on 14 July 2015.
- TCW Emerging Markets Multi-Asset Opportunities (TGMEX)
- First Trust Aberdeen Emerging Opportunities (FEO), a closed-end fund.
Of the options available, Fidelity makes a surprisingly strong showing. We’ll look into it further for you.
| Adviser |
Fund |
Q3 |
1-year |
3-year |
10-year |
| Fidelity |
FTEMX |
(11.1) |
(6.8) |
0.0 |
|
| AllianceBernstein |
ABAEX |
(10.2) |
(3.3) |
(1.7) |
|
| Capital Group |
ETOPX |
(10.2) |
(8.9) |
(3.2) |
|
| Dreyfus |
DTMAX |
(13.4) |
(12.3) |
(2.7) |
|
| First Trust/ Aberdeen |
FEO @NAV |
(11.7) |
(11.2) |
(4.1) |
|
| Lazard |
EMMIX |
(13.1) |
(13.0) |
(4.6) |
|
| TCW |
TGMEX |
(10.3) |
(7.2) |
n/a |
|
| |
|
|
|
|
|
| Benchmarks |
EM Bonds |
(6.3) |
(7.8) |
(3.7) |
6.8 |
| |
EM Equity |
(15.9) |
(12.2) |
(2.2) |
5.2 |
| |
60/40 EM |
(12.1) |
(10.4) |
(2.8) |
5.8 |
| |
60/40 US |
(5.6) |
1.6 |
7.5 |
5.7 |
Sequoia: “Has anybody seen our wheels? They seem to have fallen off.”
The most famous active fund seems in the midst of the worst screw-up in its history. The fund invested over 30% of its portfolio in a single stock, Valeant Pharmaceuticals (VRX). Valeant made money by buying other pharmaceutical firms, slashing their overhead and jacking up the prices of the drugs they produced. The day after buying to rights to heart medications Nitropress or Isuprel, Valeant increased their prices by six-fold and three-fold, respectively. Hedge funds, and Sequoia, loved it! Everyone else – including two contenders for the Democratic presidential nomination – despised it.
Against the charge that Valeant’s actions are unethical (they put people’s lives at risk in order to reap a windfall profit that they didn’t earn), Sequoia obliquely promises, “When ethical concerns arise, management tends to address them forthrightly, but in the moment.” I have no idea of what “but in the moment” means.
Then, in October, after months of bleeding value, Valeant’s stock did this:
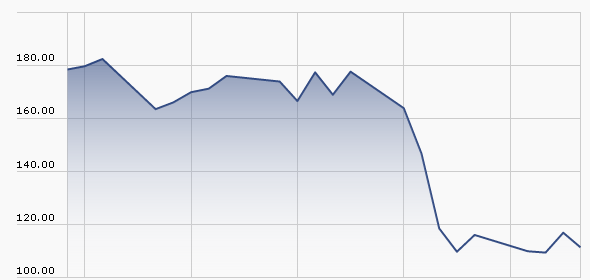
That collapse, which cost Sequoia shareholders about 6% in a single day, was pursuant to a research report suggesting that Valeant was faking sales through a “phantom pharmacy” it owned. Separately, Federal prosecutors subpoenaed documents related to Valeant’s drug pricing.
Three things stand out:
There’s a serious question about whether Sequoia management drank the Kool-Aid. One intriguing signal that they weren’t maintaining an appropriate distance from Valeant is a tendency, noted by Lewis Braham in a post to our discussion board, for the Sequoia managers to call Valeant CEO Michael D. Pearson, “Mike.” From a call transcript he pointed to:
Mike does not like to issue equity.
… not that Mike would shy away from taking a price increase.
… early on in Mike’s reign …
I think Mike said the company was going to …
We met with Mike a few weeks ago and he was telling us how with $300 million, you can get an awful lot done.
Mike can get a lot done with very little.
Mike is making a big bet.
On whole, he was “Mike” about three times more often than “Mike Pearson.” He was never “Mr. Pearson” or “the CEO.” There was no other CEO given comparable acknowledgement; in the case of their other investments, it was “Google” or “MasterCard.”
Sequoia’s research sounds a lot like Valeant’s press releases. The most serious accusation against Valeant, Sequoia insists in its opening paragraph, “is false.” That confidence rests on a single judgment: that changes in sales and changes in inventory parallel each other, so there can’t be anything amiss. Ummm … Google “manipulate inventory reporting.” The number of tricks that the accountants report is pretty substantial. The federal criminal investigation of Valeant doesn’t get mentioned. There is no evidence that Sequoia heightened its vigilance as Valeant slowly lost two-thirds of its value. Instead, they merely assert that it’s a screaming buy “at seven times the consensus estimate of 2016 cash earnings.”
Two of their independent directors resigned shortly thereafter. Rather than announcing that fact, Sequoia filed a new Statement of Additional information that simply lists three independent trustees rather than five. According to press reports, Sequoia is not interested in explaining the sudden and simultaneous departure. One director refused to discuss it with reporters; the other simply would not answer calls or letters.
Sequoia vigorously defends both Valeant’s management (“honest and extremely driven”) and its numbers. A New York Times analysis by Gretchen Morgenson is caustic about the firm’s insistence on highlighting “adjusted earnings” which distort the picture of the firm’s health. They are, Morgenson argues, “fantasy numbers.”
Sequoia’s recent shareholder letter concludes by advising Valeant to start managing with “an eye on the company’s long-term corporate reputation.” It’s advice that we’d urge upon Sequoia’s managers as well.
The Price of Everything and the Value of Nothing
 By Edward Studzinski
“The pure and simple truth is rarely pure and never simple.”
Oscar Wilde
There are a number of things that I was thinking about writing, but given what has transpired recently at Sequoia Fund as a result of its investment in and concentration in Valeant Pharmaceuticals, I should offer some comments and thoughts to complement David’s. Mine are from the perspective of an investor (I have owned shares in Sequoia for more than thirty years), and also as a former competitor.
Sequoia Fund was started back in 1970. It came into its own when Warren Buffett, upon winding up his first investment partnership, was asked by a number of his investors, what they should do with their money since he was leaving the business for the time being. Buffett advised them to invest with the Sequoia Fund. The other part of this story of course is that Buffett had asked his friend Bill Ruane to start the Sequoia Fund so that there would be a place he could refer his investors to and have confidence in how they would be treated.
Bill Ruane was a successful value investor in his own right. He believed in concentrated portfolios, generally fewer than twenty stock positions. He also believed that you should watch those stock investments very carefully, so that the amount of due diligence and research that went into making an investment decision and then monitoring it, was considerable. The usual course of business was for Ruane, Dick Cunniff and almost the entire team of analysts to descend upon a company for a full day or more of meetings with management. And these were not the kind of meetings you find being conducted today, as a result of regulation FD, with company managements giving canned presentations and canned answers. These, according to my friend Tom Russo who started his career at Ruane, were truly get down into the weeds efforts, in terms of unit costs of raw materials, costs of manufacturing, and other variables, that could tell them the quality of a business. In terms of something like a cigarette, they understood what all the components and production costs were, and knew what that individual cigarette or pack of cigarettes, meant to a Philip Morris. And they went into plants to understand the manufacturing process where appropriate.
Fast forward to the year 2000, and yes, there is a succession plan in place at Ruane, with Bob Goldfarb and Carly Cunniff (daughter of Dick, but again, a formidable talent in her own right who would have been a super investor talent if her name had been Smith) in place as President and Executive Vice President of the firm respectively. The two of them represented a nice intellectual and personality balance, complementing or mellowing each other where appropriate, and at an equal level regardless of title.
Unfortunately, fate intervened as Ms. Cunniff was diagnosed with cancer in 2001, and passed away far too early in life, in 2005. Fate also intervened again that year, and Bill Ruane also passed away in 2005.
At that point, it became Bob Goldfarb’s firm effectively, and certainly Bob Goldfarb’s fund. At the end of 2000, according to the 12/31/2000 annual report, Sequoia had 11 individual stock positions, with Berkshire representing 35.6% and Progressive Insurance representing 6.4%. At the end of 2004, according to the 12/31/2004 annual report, Sequoia had 21 individual stock positions, with Berkshire representing 35.3% and Progressive Insurance representing 12.6% (notice a theme here). By the end of 2008, according to the 12/31/2008, Berkshire represented 22.8% of the fund, Progressive was gone totally from the portfolio, and there were 26 individual stock positions in the fund. By the end of 2014, according to the 12/31/2014 report, Sequoia had 41 individual stock positions, with Berkshire representing 12.9% and healthcare representing 21.4%.
So, clearly at this point, it is a different fund than it used to be, in terms of concentration as well as the types of businesses that it would invest in. In 2000 for instance, there was no healthcare and in 2004 it was de minimis. Which begs the question, has the number of high quality businesses expanded in recent years? The answer is probably not. Has the number of outstanding managements increased in recent years, in terms of the intelligence and integrity of those management teams? Again, that would not seem to be the case. What we can say however, is that this is a Goldfarb portfolio, or more aptly, a Goldfarb/Poppe portfolio, distinct from that of the founders.
Would Buffett, if asked today . . . still suggest Sequoia? My suspicion is he would not . . .
An interesting question is, given the fund’s present composition, would Buffett, if asked today for a recommendation as to where his investors should go down the road, still suggest Sequoia? My suspicion is he would not with how the fund is presently managed and, given his public comments advocating that his wife’s money after his demise should go to an S&P 500 index fund.
A fairer question is – why have I held on to my investment at Sequoia? Well, first of all, Bob Goldfarb is 70 and one would think by this point in time he has proved whatever it was that he felt he needed to prove (and perhaps a number of things he didn’t). But secondly, there is another great investor at Ruane, and that is Greg Alexander. Those who attend the Sequoia annual meetings see Greg, because he is regularly introduced, even though he is a separate profit center at Ruane and he and his team have nothing to do with Sequoia Fund. However, Bruce Greenwald of Columbia, in a Value Walk interview in June of 2010 said Buffett had indicated there were three people he would like to have manage his money after he died (this was before the index fund comment). One of them was Seth Klarman at Baupost. Li Lu who manages Charlie Munger’s money was a second, and Greg Alexander at Ruane was the third. Greg has been at Ruane since 1985 and his partnerships have been unique. In fact, Roger Lowenstein, a Sequoia director, is quoted as saying that he knows Greg and thinks Warren is right, but that was all he would say. So my hope is that the management of Ruane as well as the outside directors remaining at Sequoia, wake up and refocus the fund to return to its historic roots.
Why is the truth never pure and simple in and of itself. We have said that you need to watch the changes taking place at firms like Third Avenue and FPA. I must emphasize that one can never truly appreciate the dynamics inside an active management firm. Has a co-manager been named to serve as a Sancho Panza or alternatively to truly manage the portfolio while the lead manager is out of the picture for non-disclosed reasons? The index investor doesn’t have to worry about these things. He or she also doesn’t have to worry about whether an investment is being made or sold to prove a point. Is it being made because it is truly a top ten investment opportunity? But the real question you need to think about is, “Can an active manager be fired, and if so, by whom?” The index investor need not worry about such things, only whether he or she is investing in the right index. But the active investor – and that is why I will discuss this subject at length down the road.
Dancing amidst the elephants: Active large core funds that earn their keep
 By Leigh Walzer
Last month in these pages we reviewed actively managed utility funds. Sadly, we could not recommend any of those funds. Either they charged too much and looked too much like the cheaper index funds or they strayed far afield and failed to distinguish themselves.
We are not here to bury the actively managed fund industry. Trapezoid’s goal is to help investors and allocators identify portfolio managers who have predictable skill and evaluate whether the fees are reasonable. Fees are reasonable if investors can expect with 60% confidence a better return with an active fund than a comparable passive fund. (Without getting too technical, the comparable fund is a time-weighted replication portfolio which tries to match the investment characteristics at a low cost.)
An actively-managed fund’s fees are reasonable if you have at least a 60% prospect of outperforming a comparable passive fund
To demonstrate how this works, we review this month our largest fund category, large blend funds. (We sometimes categorize differently than Morningstar and Lipper. We categorize for investors’ convenience but our underlying ratings process does not rely on performance relative to a peer group.)
We found 324 unique actively-managed large blend funds where the lead manager was on the job at least 3 years.
We recently posted to the www.fundattribution.com website a skill rating for each of these funds. Our “grades” are forward-looking and represent the projected skill decile for each fund over the 12 months ending July 2016. “A” means top 10%; “J” is bottom 10%. In our back-testing, the average skill for funds rated A in the following year exceeded the skill for B-rated funds, and so on with the funds rated J ranking last. Table I presents the grades for some of the largest funds in the category. For  example, the Fidelity Puritan Fund is projected to demonstrate more skill in the coming year than 80-90% of its peer group.
MFO readers who want to see the full list can register for demo access at no cost. (The demo includes a few fund categories and limited functionality.) Demo users can also see backtesting results.
Table I
Skill Projections for Major US Large Blend Funds
| Funds |
AUM ($bn) |
Decile |
| American Funds Inv. Co. of America |
69 |
C |
| Amer. Funds Fundamental Investors Fund |
68 |
D |
| Dodge & Cox Stock Fund |
56 |
D |
| Vanguard Windsor II Fund |
44 |
H |
| Fidelity Advisor New Insights Fund |
26 |
A |
| Fidelity Puritan Fund |
24 |
B |
| Vanguard Dividend Growth Fund |
24 |
H |
| BlackRock Equity Dividend Fund |
22 |
J |
| Oakmark Fund |
17 |
B |
| Davis New York Venture Fund |
14 |
G |
| John Hancock Disciplined Value Fund |
13 |
E |
| Invesco Comstock Fund |
12 |
G |
| JPMorgan US Equity Fund |
12 |
D |
| Parnassus Core Equity Fund |
11 |
A |
| JPMorgan US Large-Cap Core Plus Fund |
11 |
A |
A few caveats:
- Our grades represent projected skill, not performance. Gross return reflects skill together with the manager’s positioning. Fund expenses are considered separately.
- The difference in skill level between an E and F tends to be small while at the extremes the difference between A and B or I and J is larger.
- Generally, deciles A through E have positive skill while F thru J are negative. The median fund may have skill which is slightly positive. This occurs because of survivorship bias: poorly managed funds are closed or merged out of existence
- We do not have a financial interest in any of these funds or their advisors
Of course, costs matter. So we ran 1900 large blend fund classes through our Orthogonal Attribution Engine (OAE) to get the probability the investment would outperform its replication portfolio by enough to cover expenses. The good news (for investors and the fund industry) is there are some attractive actively managed funds. Our analysis suggest the fund classes in Table II will outperform passive funds, despite their higher fees.
Table II
Highly-rated Large blend Fund Classes (based on skill through July 2015)
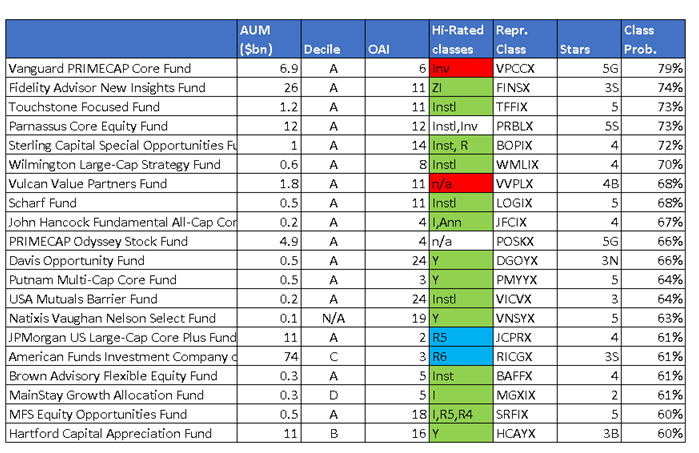
[a] Morningstar ratings as of 10/20/15. G means gold (e.g. 5G means 5stars and “Gold”), S is silver, B is bronze
[b] For those of you who like ActiveShare, OAI provides a measure of how active each fund is. A closet indexer should have an OAI near zero. If we can replicate the fund, even with more complicated techniques, it will also score low. Funds which are highly differentiated can score up to 100.
[c] Red funds are closed to new investors. Green are limited to institutional investors and retirement plans. Blue are limited to retirement plans
The bad news is that top-rated fund, Vanguard PrimeCap (VPCCX), is closed to new investors. So, too, is Vulcan Value Fund (VVPLX). Fortunately, the PRIMECAP Odyssey Stock Fund (POSKX) is open and accessible to most investors. Investors have 66% confidence this fund will generate excess return next year after considering costs. The Primecap funds have done well by overweighting pharma and tech over utilities and financials and have rotated effectively into and out of high-dividend stocks.
In many cases only the institutional or retirement classes are good deals for investors. For example, the Fidelity Advisor New Insights Fund classes I and Z offer 70% confidence; but a new investor who incurs the higher fees/load for classes A, B, C, and T would be less than 55% confident of success. Of course investors who already paid the load should stay the course.
While all these funds are worthy, we have space today to profile just a few funds.
Sterling Capital Special Opportunities Fund (BOPIX, BOPAX, etc.) is just under $1 billion. This fund was once known as BB&T Special Opportunities Equity Fund and was rated five-stars by Morningstar. The rating of the A class later fell to 3 stars and recently regained four-stars.
Table III
Return Attribution: Sterling Capital Special Opportunities Fund
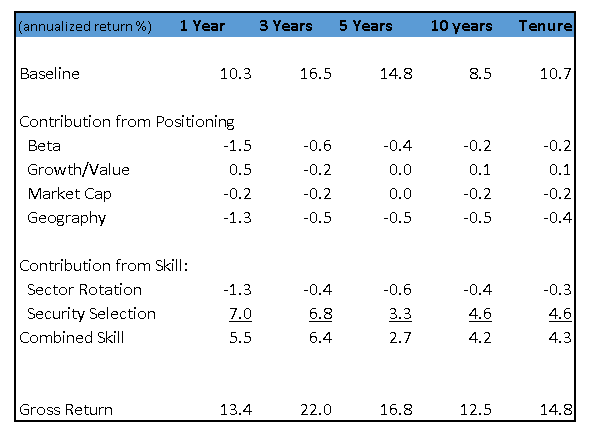
Special Opps’ gross return was 22% before expenses over the past 3 years. (Table III) Even after fees, returns trounced the S&P500 by over 300bps for the past 3 years and over the past 10 years. The one and 5 year comparisons are less favorable but still positive. Combined skill has been consistently positive over the twelve year history of the fund.
However, that doesn’t tell the whole story. Comparing this to the S&P500 (or the Russell 1000) is neither accurate nor fair. The replicating portfolio – i.e., the one the OAE chooses as the best comparison – is approximately 90% equities (mostly the S&P500 with a smattering of small cap and hedged international which has decreased over time) plus 25% fixed income. The fixed income component surprised us at first, because the portfolio includes no bonds and does not utilize leverage. But the manager likes to write covered calls to generate extra income. We observe he sells about 5% of the portfolio on average about 10 to 20% out of the money. In this way he probably generates premium income of 25bp/yr., which the fixed income component captures well. As always, the model evaluates the manager based on what he actually does, rather than against his stated benchmark (Russell 1000) or peer group.
Option writing helps explain why his beta is lower (We estimate .89, you will find other figures as low as .84.) In the eyes of the Orthogonal Attribution Engine, that makes his performance more remarkable. We are not quite so impressed to pay an upfront 5.75% load for BOPAX (Class A), but BOPIX rates well. BOPAX is available no-load and NTF through Schwab and several smaller brokerages.
We had an opportunity to speak to the manager, George Shipp. Table III shows his skill derives much more from stock selection than sector rotation, a view he shared. We can make a few observations. He has a team of experienced generalists and a lot of continuity. His operation in Virginia Beach is separate from the other Sterling/BB&T operations in North Carolina. He also manages Sterling Capital Equity Income (BAEIX), a much larger fund with zero historical overlap. The team follows a stable of companies, mainly industry leaders. They like to buy when the stock is dislocated and they see a catalyst. The investment process is deliberative. That sounds like a contrarian, value philosophy, but in fact they have an even balance of growth and value investments. We reviewed his portfolio from 5 years ago, several of the top holdings trounced the market. (The exceptions were energy stocks.) Shipp noted he had good timing buying Apple when it was pummeled. He doesn’t specifically target M&A situations, but his philosophy puts the fund in a position to capture positive event risk. It is not unusual for the fund to own the same company more than once.
We also had a chance to speak to the folks at Davis Opportunity Fund (RPEAX). What jumps out about this $530mm fund is their ability to grind out excess return of 1 to 1.25% /yr. for nearly twenty years. It is no great feat that DGOYX net returns just match the S&P500 for the past 5 years but they managed to do this despite two tailwinds: a 20% foreign allocation (partly hedged) and moderate cash balances. There is an old saw: “You can’t eat relative performance.” But when a fund shows positive relative performance for two decades with some consistency the Orthogonal model concludes the manager is skillful and some of that skill might carry over to the future. We are willing to pay an incremental 60bp for their institutional class compared with an index fund but we cannot recommend the other share classes. A new co-manager was named in 2013, we see no drop-off in performance since then. (As with Sterling, the team manages a $15bn fund called Davis NY Venture (NYVTX) which does not rate nearly as well; there is some performance correlation between the two funds.)
Their process is geared toward global industry leaders and is somewhat thematic. OAI of 24 indicates they run a very concentrated portfolio which cannot be easily replicated using passives. (We will talk more about OAI in the future.) Looking back at their portfolio from 5 years ago, their industry weightings were favorable and they did very well with CVS and Google but took hits from Sino Forest (ouch!) and Blount.
In general, the expected skill for a purely passive large blend fund will be close to zero and the probability will be around 50%. (There are exceptions including funds which don’t track well against our indices.) However, there are a number of quantitatively driven and rules-based funds competing in the large blend space which show skill and some make our list
Table IV
Highly-Rated Large Blend Quantitative Funds
| Fund |
Repr. Class |
Class Prob |
Hi-Rated Classes |
| American Century Legacy Large-Cap Fund |
ACGOX |
72% |
Instl Inv Adv |
| PowerShares Buyback Achievers Portfolio |
PKW |
64% |
|
| Wells Fargo Large-Cap Core Fund |
EGOIX |
63% |
I |
| Vanguard Structured Broad Market Fund |
VSBMX |
62% |
I |
| AMG FQ Tax-Managed US Equity Fund |
MFQTX |
62% |
Instl |
| Vanguard Structured Large-Cap Equity Fund |
VSLPX |
61% |
InstlPlus |
We are a little cautious in applying the model to quantitative funds. We know from backtesting that smart managers tend to stay smart, but there is a body of view that good quantitative strategies invite competition and have to be reinvented every few years. Nevertheless, here are the top-rated quant funds. All funds in Table IV carry five-star ratings from Morningstar except ACGOX is rated four-stars)
We had a chance to speak to the team managing American Century Legacy Large Cap (ACGOX), led by John Small and Stephen Pool in Kansas City. Their approach is to devise models which predict what stock characteristics will work in a given market environment and load up on those stocks. There is some latitude for the managers to override the algorithms. Note this fund is rather small at $23 mm. The fund was evaluated based on data since management started in 2007. However, the model was overhauled from 2010-2012 and has been tweaked periodically since then as market conditions change. The same team manages three other funds (Legacy Multicap, Legacy Focused, and Veedot); since 2012 they have used the same process, except they apply it to different market sectors.
Bottom Line:
If you are ready to throw in the towel on active funds, you are only 94% right. There are a few managers who offer investors a decent value proposition. Mostly these managers have sustained good records over long periods with moderate expense levels. Our thinking on quant funds will evolve over time. Based on our look at American Century Legacy, we suggest investors evaluate these managers based on the ability to react and adapt their quant models rather and not focus too much on the current version of the black box. Remember to check out our fearless predictions for the entire large blend category at www.fundattribution.com (registration required)
If you have any questions, drop me a line at [email protected]
Five great overlooked little funds
Barron’s recently featured an article by journalist Lewis Braham, entitled “Five great overlooked little funds” (10/17/2015). Lewis, a frequent contributor of the Observer’s discussion board, started by screening for small (>$100 milllion), excellent (top 20% performance over five years) funds, of which he found 173. He then started doing what good journalists do: he dug around to understand when and why size matters, then started talking with analysts and managers. His final list of worthies is:
- SSgA Dynamic Small Cap(SSSDX) which has been added to Morningstar’s watchlist. A change of management in 2010 turned a perennial mutt into a greyhound. It’s beaten 99% of its peers and charged below average expenses.
- Hood River Small-Cap Growth(HRSRX) has $97 million but “its 14.1% annualized five-year return beats its peers by 2.3 percentage points a year.” The boutique fund remains small because, the manager avers, “We’re stockpickers, not marketers.”
- ClearBridge International Small Cap(LCOAX), sibling to a huge domestic growth fund, has a five-year annualized return of 8.5%, which beats 95% of its peers. It has $131 million in assets, 1% of what ClearBridge Aggressive Growth (SHRAX) holds.
- LKCM Balanced (LKBAX) holds an inexpensive, low-turnover portfolio of blue-chip stocks and high-grade bonds. It’s managed to beat 99% of its peers over the past decade while still attracting just $37 million.
- Sarofim Equity (SRFMX) is a virtual clone of Dreyfus Appreciation (DGAGX). Both buy ultra-large companies and hold them forever; in some periods, the turnover is 2%. It has a great long-term record and a sucky short-term one.
 Lewis is also the author of The House that Bogle Built: How John Bogle and Vanguard Reinvented the Mutual Fund Industry(2011), which has earned a slew of positive, detailed reviews on Amazon. He is a graceful writer and lives in Pittsburgh; I’m jealous of both. Then, too, when I Googled his name in search of a small photo for the story I came up with
To which I can only say, “wow.”
Here Mr. Herro, have a smoke and a smile!
After all, science has never been able to prove that smoking is bad for you. Maureen O’Hara, for example, enjoyed the pure pleasure of a Camel:

And she passed away just a week ago (24 October 2015), cancer-free, at age 95. And the industry’s own scientists confirm that there are “no adverse effects.”

And, really, who’d be in a better position to know? Nonetheless, the Association of National Advertisers warns, this “legal product in this country for over two centuries, manufactured by private enterprise in our free market system” has faced “a fifty-year conspiracy” to challenge the very place of cigarettes in the free enterprise system. The debate has “lost all sense of rationality.”
It’s curious that the industry’s defense so closely mirrors the federal court’s finding against them. Judge Marion Kessler, in a 1700 page finding, concluded that “the tobacco industry has engaged in a conspiracy for decades to defraud or deceive the public … over the course of more than 50 years, defendants lied, misrepresented and deceived the American public … suppress[ed] research, destroyed documents, destroyed the truth and abused the legal system.”
David Herro is the famously successful manager of Oakmark International (OAKIX), as well as 13 other funds for US or European investors. Two of Mr. Herro’s recent statements give me pause.
On climate change: “pop science” and “environmental extremism”
In an interview with the Financial Times, Mr. Herro denounced the 81 corporate leaders, whose firms have a combined $5 trillion market cap, who’d signed on to the White House Climate Pledge (“Fund manager David Herro criticizes corporate ‘climate appeasers,’” 10/21/15). The pledge itself has an entirely uncontroversial premise:
…delaying action on climate change will be costly in economic and human terms, while accelerating the transition to a low-carbon economy will produce multiple benefits with regard to sustainable economic growth, public health, resilience to natural disasters, and the health of the global environment.
As part of the pledge, firms set individual goals for themselves. Coke wants to reduce its carbon footprint by 25%. Facebook promises to power its servers with power from renewables. Bloomberg would like to reduce its energy use by half while achieving an internal rate of return of 20% or more on its energy investments.
To which Mr. Herro roars: “climate appeasers!” They had decided, he charged, to “cave in to pop science and emotion.” Shareholders “should seriously question executives who appease such environmental extremism and zealotry.”
Like others on his island, he engages in a fair amount of arm-flapping. Climate change, he claims, “is not proven by the data.” The Grist.org project, “How to Talk to Climate Deniers” explains the problem of “proof” quite clearly:
There is no “proof” in science — that is a property of mathematics. In science, what matters is the balance of evidence, and theories that can explain that evidence. Where possible, scientists make predictions and design experiments to confirm, modify, or contradict their theories, and must modify these theories as new information comes in.
In the case of anthropogenic global warming, there is a theory (first conceived over 100 years ago) based on well-established laws of physics. It is consistent with mountains of observation and data, both contemporary and historical. It is supported by sophisticated, refined global climate models that can successfully reproduce the climate’s behavior over the last century.
Given the lack of any extra planet Earths and a few really large time machines, it is simply impossible to do any better than this.
But Mr. Herro has a reply at hand: “Their answer is … per cent of scientists and Big Oil. My answer is data, data, data.”
What does that even mean, other than the fact that the undergrad science requirement for business majors at Mr. Herro’s alma mater (lovely UW-Platteville) ought to be strengthened? Is he saying that he’s competent to assess climatological data? That he can’t find any data? (If so, check NASA’s “evidence” page here, sir.) That the data’s not perfect? Duh. That you’ve found the data, data, data straight from the source: talk radio and self-published newsletters? Or that there’s some additional bit not provided by the roughly 14,000 peer-reviewed studies that have corroborated the science behind global warming?
Can you imagine what would happen if you used to same criteria for assessing evidence about investments?
None of which I’d mention except for the fact that Herro decided to expand on the subject in his Financial Times interview which moves the quality of his analysis from the realm of the personal to the professional.
 In my endless poking around, I came upon a clear, thoughtful, entertaining explanation of global warming that even those who aren’t big into science or the news could read, enjoy and learn from. The site is Wait But Why and it attempts to actually explain things (including sad millennials and procrastination) using, well, facts and humor.
Climate Change is a Thing
Let’s ignore all the politicians and professors and CEOs and filmmakers and look at three facts.
- Burning Fossil Fuels Makes Atmospheric CO2 Levels Rise
- Where Atmospheric CO2 Levels Go, Temperatures Follow
- The Temperature Doesn’t Need to Change Very Much to Make Everything Shitty
In between our essays, you should go peek at the site. If you can understand the designs on the stuff in their gift shop, you really should drop me a note and explain it.
On emerging markets: “never again”
In an interview with the Associated Press (“answers have been edited for clarity”), Mr. Herro makes a statement that’s particularly troubling for the future of the Oakmark funds. The article, “Fund manager touts emerging-market stocks” (10/25/15), explains that much of the success of Oakmark International (OAKIX) was driven by Mr. Herro’s prescient and substantial investment in emerging markets:
If we back up to 1998 or 1999, during the Asian financial crisis, we had 25 or 26% of the portfolio in emerging markets. We built up a huge position and we benefited greatly from that the whole next decade. It was the gift that kept giving.
The position was eventually reduced as he harvested gains and valuations in the emerging markets were less attractive. The logical question is, would the fund be bold enough to repeat the decision that “benefited [them] greatly” for an entire decade. Would he ever go back to 25%.
No, no, no. It could come up to 10 or 15% … but we’ll try to cap it there because, nowadays, people use managers (who are dedicated to emerging markets). And we don’t bill ourselves as an emerging-market manager.
This is to say, his decisions are now being driven by the demands of asset gathering and retention, not by the investment rationale. He’ll cap his exposure at perhaps half its previous peak because “people” (read: large investment advisers) want their investments handled by specialists. Having OAKIX greatly overweighted in EMs, even if they were the best values available, would make the fund harder to sell. And so they won’t do it.
Letting marketability drive the portfolio is a common decision, but hardly an admirable one.
A picture for the Ultimus Client Conference folks
At the beginning of September, I had the opportunity to irritate a lot of nice people who’d gathered for the annual client conference hosted by Ultimus Fund Services. My argument about the fund industry was two-fold:
- You’re in deep, deep trouble but
- There are strategies that have the prospect of reversing your fortunes.
Sometimes the stuff we publish takes three or four months to come together. Our premium site has a feature called “Works in Progress.” It’s the place that we’ll share stuff that’s not ready for publication here. Between now and year’s end, we’ll be posting pieces of the “how to save yourself” essay bit-by-bit.
But that’s not what most folks at the conference wanted to talk about. No, for 12 hours after my talk, the corporate managers at various fund companies and advisers brought up the same topic: I have no idea of how to work with the Millennials in my office. They have no sense of time, urgency, deadlines or focus. What’s going on with these people? All of that was occasioned by a single, off-hand comment I’d made about the peculiar decisions made by a student of mine.
We talked through the evidence on evolving cultural norms and workplace explanations, and I promised to try to help folks find some useful guidance. I found a great explanation of why yuppies are unhappy in an essay at WaitButWhy, the folks above. After explaining why young folks are delusional, they illustrated the average Millennial’s view of their career trajectory:

If you’ve been banging your head on the desk for a while now, you should read it. You’ll feel better. Pwc, formerly Price, Waterhouse, Cooper, published an intricate analysis (Millennials at work 2015) of Millennial expectations and strategies for helping them be the best they can be. They also published a short version of their recommendations as How to manage the millennials (2015). Scholars at Harvard and the Wharton School of Business are rather more skeptical, taking the counter-intuitive position that there are few real generational differences. Their sources seem intrigued by the notion of work teams that combine people of different generations, who contrasting styles might complement and strengthen one another.
It’s worth considering.
Jack and John, Grumpy Old Men II
Occasionally you encounter essays that make you think, “Jeez, and I thought I was old and grouchy.” I read two in quick, discouraging succession.
 Jack Bogle grouched, “I don’t do international.” As far as I can tell, Mr. Bogle’s argument is “the world’s a scary place, so I’m not going there.” At 86 and rich, that’s an easy and sensible personal choice. For someone at 26 or 36 or 46, it seems incredibly short-sighted. While he’s certainly right that “Outside of the U.S., you can be very disappointed,” that’s also true inside the United States. In an oddly ahistoric claim, Bogle extols our 250 year tradition of protecting shareholders rights; that’s something that folks familiar with the world before the Securities Act of 1934 would find freakishly ill-informed.
A generation Mr. Bogle’s junior, the estimable John Rekenthaler surveyed the debate concerning socially responsible investing (alternately, “sustainable” or “ESG”) and grumped, “The debate about the merits of the genre is pointless.” Why? Because, he concludes, there’s no clear evidence that ESG funds perform differently than any other fund. Exactly! We reviewed a lot of research in “It’s finally eas y being green” (July 2015). The overwhelming weight of evidence shows that there is no downside to ESG investing. You lose nothing by way of performance. As a result, you can express your personal values without compromising your personal rate of return. If you’re disgusted at the thought that your retirement is dependent on addicting third world children to cigarettes or on clearing tropical forests, you can simply say “no.” We profiled clear, palatable investment choices, the number of which is rising.
The freak show behind the curtain: 25,000 funds that you didn’t even know existed
Whatever their flaws (see above), mutual funds are relatively stable vehicles that produce reasonable returns. Large cap funds, on average and after expenses, have returned 7.1% over the past 15 years which puts them 70 bps behind the S&P 500 for the same period.
But those other 25,000 funds …
Which others? ETFs? Nope. There are just about 1,800 of them – with a new, much-needed Social Media Sentiment Index ETF on the way (whew!) – controlling only $3 trillion. You already know about the 7,700 ’40 Act funds and the few hundred remaining CEFs are hardly a blip (with apologies to RiverNorth, to whom they’re a central opportunity).
No, I mean the other 24,725 private funds, the existence of which is revealed in unintelligible detail in a recent SEC staff report entitled Private Fund Statistics, 4th Quarter 2014 (October 2015). That roster includes:
- 8,625 hedge funds, up by 1100 since the start of 2013
- 8,407 private equity funds, up by 1400 in that same period
- 4,058 “other” private funds
- 2,386 Section 4 private equity funds
- 1,789 real estate funds
- 1,541 qualifying hedge funds
- 1,327 securitized asset funds
- 504 venture capital funds
- 69 liquidity funds
- 49 Section 3 liquidity funds, these latter two being the only categories in decline
The number of private funds was up by 4,200 between Q1/2013 and Q4/2014 with about 200 new advisers entering the market. They have $10 trillion in gross assets and $6.7 trillion in net assets. (Nope, I don’t know what gross assets are.) SEC-registered funds own about 1% of the shares of those private funds.
If Table 20 of the SEC report is to be credited, almost no hedge ever uses a high-frequency trading strategy. (You’ll have to imagine me at my desk, nodding appreciatively.)
Sadly, the report explains nothing. You get tables of technical detail with nary a definition nor an explanation in sight. “Asset Weighted-Average Qualifying Hedge Fund Investor and Portfolio Liquidity” assures that that fund liquidity at seven days is about 58% while investor liquidity in that same period is about 15%. Not a word anywhere  about what that means. An appendix defines about 10 terms, no one of which is related to their data reports.
A recent report in The Wall Street Journal does share one crucial bit of information: equity hedge funds don’t actually make money for their investors. The HRFX Equity Hedge Fund Index is, they report, underwater over the past decade. That is, “if you have invested … in this type of fund 10 years ago, you would have less than you started with.” An investment in the S&P 500 would have doubled (“Funds wrong-footed as Glencore, others gain,” 10/31/2015).
About a third of hedge funds fold within three years of launch; the average lifespan is just five years. Unlike the case of mutual funds, size seems no guardian against liquidation. Fortress Investment Group is closing its flagship macro fund by year’s end as major domo Michael Novogratz leaves. Renaissance Capital is closing their $1.3 billion futures fund. Bain Capital is liquidating their Absolute Return Capital fund. Many funds, including staunch investors in Valeant such as William Ackman of Pershing Square, are having their worst year since the financial crisis. As a group, they’re underwater for 2015.
Hedge Fund, n. Expensive and exclusive funds numbering in the thousands, of which only about a hundred might be run by managers talented enough to beat the market with consistency and low risk. “The rest,” says the financial journalist Morgan Housel, “charge ten times the fees of mutual funds for half the performance of index funds, pay half the income-tax rates of taxi drivers, and have triple the ego of rock stars. Jason Zweig, The Devil’s Financial Dictionary (2015)
Matching your funds and your time horizon
The Observer has profiled, and praised, the two RiverPark funds managed by David Sherman of Cohanzick. The more conservative, RiverPark Short Term High Yield (RPHYX/RPHIX, closed), usually makes 300-400 bps over a money market fund with scarcely more volatility. Year-to-date, through Halloween, the fund has returned a bit over 1% in a difficult market. The slightly more aggressive, RiverPark Strategic Income (RSIVX/RSIIX) might be expected to about double its sibling’s return with modest volatility, a feat that it has managed regularly. Strategic has had a performance hiccup lately; leading some of the folks on our discussion board to let us know that they’d headed for the exits.
For me, the questions are (1) is there a systemic problem with the fund? And (2) what’s the appropriate time-frame for assessing the fund’s performance? I don’t see evidence of the former, though we’re scheduled to meet Mr. Sherman in November and will talk more.
On the latter, the Observer’s fund-screener tracks “recovery times” for every fund over 20 time periods. Carl Bacon, in the book, Practical Risk Advanced Performance Measurements (2012), defines recovery time, or drawdown duration, as the time taken to recover from an individual or maximum drawdown to the original level. Recovery time helps investors approximate reasonable holding periods and also assessment periods. If funds of a particular type have recovery times of, say, 18-24 months, then (1) it would be foolish to use them for assets you might need in less than 18-24 months and (2) it would be foolish to panic if it takes them 18-24 months to recover.
Below, for comparison, are the maximum recovery times for the flexible bond funds that Morningstar considers to be the best.
Gold- and Silver-rated Flexible bond funds
|
Name
|
Analyst Rating
|
Recovery Period, in months
|
2015 returns, through 10/30
|
|
Loomis Sayles Bond (LSBDX)
|
Gold
|
17
|
(3.59)
|
|
Fidelity Strategic Income (FSICX)
|
Silver
|
14
|
0.78
|
|
Loomis Sayles Strategic Income (NEZYX)
|
Silver
|
23
|
(3.98)
|
|
PIMCO Diversified Income (PDIIX)
|
Silver
|
15
|
3.17
|
|
PIMCO Income (PIMIX)
|
Silver
|
18
|
3.49
|
|
Osterweis Strategic Income (OSTIX)
|
Silver
|
9
|
1.65
|
The Observer has decided to license data for our fund screener from Lipper rather than Morningstar; dealing with the sales rep from Morningstar kept making my systolic soar. Within about a week the transition will be complete. The difference you’ll notice is a new set of fund categories and new peer groups for many funds. Here are the recovery times for the top “flexible income” and “multi-sector” income funds, measured by Sharpe ratio over the current full market cycle (11/2007 – present). This screens out any fund that hasn’t been around for at least eight years.
|
Name
|
Category
|
Recovery Period, in months
|
Full cycle Sharpe ratio
|
|
PIMCO Income (PIMIX, a Great Owl)
|
Multi-sector
|
18
|
1.80
|
|
Osterweis Strategic Income (OSTIX)
|
Multi-sector
|
9
|
1.35
|
|
Schwab Intermediate Bond (SWIIX)
|
Multi-sector
|
16
|
1.25
|
|
Neuberger Berman Strategic Income (NSTLX)
|
Multi-sector
|
8
|
1.14
|
|
Cutler Fixed Income (CALFX)
|
Flexible income
|
15
|
1.02
|
|
FundX Flexible Income (INCMX)
|
Multi-sector
|
18
|
1.00
|
Bottom line: Before you succumb to the entirely understandable urge to do something in the face of an unexpected development, it’s essential to ask “am I being hasty?” Measures such as Recovery Time help, both in selecting an investment appropriate to your time horizon and in having reasonable criteria against which to assess the fund’s behavior.
Last fall we were delighted to welcome Mark Wilson, Chief Investment Officer for The Tarbox Group which is headquartered in Newport Beach, California. As founder and chief valet for the website CapGainsValet, Mark provided a remarkable service: free access to both thoughtful commentaries on what proved to be a horror of a tax season and timely data on hundreds of distributions. We’re more delighted that he agreed to join us again for the next few months.
Alive and kicking: The return of Cap Gains Valet
 By Mark Wilson, APA, CFP®, Chief Valet
CapGainsValet.com is up and running again (and still free). CGV is designed to be the place for you to easily find mutual fund capital gains distribution information. If this concept is new to you, have a look at the Articles section of the CGV website where you’ll find educational pieces ranging from beginner concepts to more advanced tax saving strategies.
It’s quite early in the reporting season, but here are some of my initial impressions:
- Many firms have already posted 2015 estimates. The site already has over 75 firms’ estimates posted so there is already some good information available. This season I’m expecting to post estimates for over 190 fund firms. I’ll continue to cycle through missing firms and update the fund database as new information becomes available. Keep checking in.
- This year might feel more painful than last year. Based on estimates I’ve found to-date, I’m expecting total distributions to be lower than last year’s numbers. However, if fund performance ends the year near today’s (flat to down) numbers, investors can get a substantial tax bill without accompanying investment gains.
- It’s already an unusual year. My annual “In the Doghouse” list compiles funds with estimated (or actual) distributions over 20% of NAV. The list will continue to grow as fund firms post information. Already on the list is a fund that distributed over 80%, an index fund and a “tax-managed” fund – oddball stuff!
- Selling/swapping a distributing fund could save some tax dollars. If you bought almost any fund this year in a taxable account, you should consider selling those shares if the fund is going to have a substantial distribution. (No, fund companies do not want to hear this.) Tax wise, running some quick calculations can help you decide a good strategy. Be careful not to run afoul of the “wash sale” rules.
Of course, the MFO Discussion board (led by TheShadow) puts together its own list of capital gains distribution links. Be sure to check their work out as that list may have some firms that are not included on CGV due to their smaller asset base. Between the two resources, you should be well covered.
I value the input of the MFO community, so if you have any comments to share about CapGainsValet.com, feel free to contact me.
Top developments in fund industry litigation
 Fundfox, launched in 2012, is the mutual fund industry’s only litigation intelligence service, delivering exclusive litigation information and real-time case documents neatly organized, searchable, and filtered as never before. For the complete list of developments last month, and for information and court documents in any case, log in at www.fundfox.com and navigate to Fundfox Insider.
Orders & Decisions
- A U.S. Magistrate Judge recommended that the court deny First Eagle‘s motion to dismiss fee litigation regarding two of its international equity funds. (Lynn M. Kennis Trust v. First Eagle Inv. Mgmt., LLC)
- In Jones v. Harris Associates—the fee litigation regarding Oakmark funds in which the U.S. Supreme Court set the legal standard for liability under section 36(b)—the Seventh Circuit denied the plaintiffs’ petition for rehearing en banc in their unsuccessful appeal of the district court’s summary judgment in favor of Harris Associates.
- J.P. Morgan Investment Management was among six firms named in SEC enforcement actions for short selling violations in advance of stock offerings. J.P. Morgan agreed to pay $1.08 million to settle the charges.
- Further extending the fund industry’s dismal losing record on motions to dismiss section 36(b) fee litigation, the court denied New York Life‘s motion to dismiss a lawsuit regarding four of its MainStay funds. The court viewed allegations that New York Life delegated “substantially all” of its responsibilities as weighing in favor of the plaintiff’s claim. (Redus-Tarchis v. N.Y. Life Inv. Mgmt., LLC.)
- After the Tenth Circuit reversed a class certification order in a prospectus disclosure case regarding Oppenheimer‘s California Municipal Bond Fund, the district court reaffirmed the order such that the litigation is once again proceeding as a certified class action. Defendants include independent directors. (In re Cal. Mun. Fund.)
- Denying Schwab defendants’ petition for certiorari, the U.S. Supreme Court declined to review the controversial Ninth Circuit decision that allowed multiple state common-law claims to proceed with respect to Schwab’s Total Bond Market Fund. Defendants include independent directors. (Northstar Fin. Advisors, Inc. v. Schwab Invs.)
- In the same lawsuit, the district court partly denied Schwab‘s motion to dismiss, holding (among other things) that defendants had abandoned their SLUSA preclusion arguments with respect to Northstar’s breach of fiduciary duty claims. (Northstar Fin. Advisors, Inc. v. Schwab Invs.)
- Two UBS advisory firms agreed to pay $17.5 million to settle SEC charges arising from their purported roles in failing to disclose a change in investment strategy by a closed-end fund they advised.
- By order of the court, the securities fraud class action regarding four Virtus funds transferred from C.D. Cal. to S.D.N.Y. (Youngers v. Virtus Inv. Partners, Inc.)
New Lawsuits
- Allianz Global Investors and PIMCO are targets of a new ERISA class action that challenges the selection of proprietary mutual funds for the Allianz 401(k) plan. Complaint: “the Fiduciary Defendants treat the Plan as an opportunity to promote the Allianz Family’s mutual fund business and maximize profits at the expense of the Plan and its participants.” (Urakhchin v. Allianz Asset Mgmt. of Am., L.P.)
- J.P. Morgan is the target of a new section 36(b) excessive fee lawsuit regarding five of its funds. The plaintiffs rely on comparisons to purportedly lower fees that J.P. Morgan charges to other clients. (Campbell Family Trust v. J.P. Morgan Inv. Mgmt., Inc.)
- Metropolitan West‘s Total Return Bond Fund is the subject of a new section 36(b) excessive fee lawsuit. The plaintiff relies on comparisons to purportedly lower fees that Metroplitan West charges to other clients. (Kennis v. Metro. W. Asset Mgmt., LLC.)
The Alt Perspective: Commentary and news from DailyAlts.
 October proved to be less than spooky for the equity market as the S&P 500 Index rose 8.44% over the month, leading major asset classes and alternative investment categories. While bonds and commodities were relatively flat, long/short equity funds topped the list of alternative funds and returned an average of 2.88%, while bear market funds shed 11.30% over the month as stocks rallied. Managed futures funds gave back gains they had made earlier in the year with a loss of 1.82% on average, according to Morningstar, while multi-alternative funds posted gains of 1.33%. All in all, a mixed bag for nearly everything but long-only equity.
Asset Flows
September turned out to be a month when investors decided that it was time to pull money from actively managed mutual funds and ETFs, regardless of asset class, style or strategy – except for alternatives. Every actively managed category, as reported by Morningstar saw outflows other than alternatives, which had net inflows of $719 million to actively managed funds and another $884 million to passively managed alternative mutual funds and ETFs.
As you will recall, volatility started to spike in August when the Chinese devaluated the Yuan, and the turmoil carried into September. But not all alternative categories saw positive inflows in September – in fact few did. Were it not for trading strategy funds, such as inverse funds, the overall alternatives category would be negative:
- Trading strategies, such as inverse equity funds, added $1.5 billion
- Multi-alternative funds picked up $998 million
- Managed futures funds added $744 million
- Non-traditional bond funds shed $1.3 billion
- Volatility based funds lost $551 million
New Fund Filings
AlphaCentric and Catalyst both teamed up with third parties to invest in managed futures or related strategies. AlphaCentric partnered with Integrated Managed Futures Corp for a more traditional, single manager managed futures fund while Catalyst is looking to Millburn Ridgefield Corporation to run a managed futures overlay on an equity portfolio – very institutional like!
Another interesting filing was that from a new company called Castlemaine who plans to launch five new alternative mutual funds – all managed by one individual. That’s just hard to do! Hard to criticize that this point, but we will keep an eye on the firm as they come out with new products later this year.
Research
Finally, there were a couple pieces of interesting research that we uncovered this past month, as follows:
Have a wonderful November, and Happy Thanksgiving to all.
Observer Fund Profiles: RNCOX
Each month the Observer provides in-depth profiles of between two and four funds. Our “Most Intriguing New Funds” are funds launched within the past couple years that most frequently feature experienced managers leading innovative newer funds. “Stars in the Shadows” are older funds that have attracted far less attention than they deserve.
RiverNorth Core Opportunity (RNCOX). RiverNorth turns the typical balanced strategy (boring investments, low costs) on its head. At the price of higher pass-through costs, the fund attempts to exploit the occasionally-irrational pricing of the closed-end fund market to add a market-neutral layer of returns to a flexible underlying allocation. That’s work well far more often than it hasn’t.
Launch Alert: T. Rowe Price Emerging Markets Value (PRIJX)
Price launched its Emerging Markets Value fund at the end of September. The manager is Ernest C. Yeung. He started at Price in 2003 as an analyst covering E.M. telecommunication stocks. In 2009 he became a co-manager of the International Small Cap Equity strategy (manifested in the U.S. as Price International Discovery PRIDX), where he was the lead guy on Asian stock selection. Nick Beecroft in Price’s Hong Kong office reports that at the end of 2014, “he began to manage a paper portfolio for the new T. Rowe Price Emerging Markets Value Stock Fund, which he then ran until the fund was launched publicly in September 2015. So Ernest [has] been part of our emerging markets team at T. Rowe for over 12 years.”
The fund will target 50-80 stocks and stock selection will drive both country and sector exposure. Characteristics he’ll look for:
- low valuation on various earnings, book value, sales, and cash flow metrics, in absolute terms and/or relative to the company’s peers or its own historical norm;
- low valuation relative to a company’s fundamentals;
- companies that may benefit from restructuring activity or other turnaround opportunities;
- a sound balance sheet and other positive financial characteristics;
- strong or improving position in an overlooked industry or country; and
- above-average dividend yield and/or the potential to grow dividends.
As Andrew Foster and others have pointed out, value investing has worked poorly in emerging markets. Their argument is that many EM markets, especially Asian ones, have powerful structural impediments to unlocking value. Those include interlocking directorships, control residing in founding families rather than in the corporate management, cross-ownership and a general legal disregard for the rights of minority shareholders. I asked the folks at Price what they thought had changed. Mr. Beecroft replied:
We agree that traditional, fundamental value investing can be challenging in emerging markets. Companies can destroy value for years for all the reasons that you mention. Value traps are prevalent as a result. Our approach deliberately differs from the more traditional fundamental value approach. We take a contrarian approach and actively seek stocks that are out of favour with investors or which have been “forgotten” by the market. We also look for them to have a valuation anchor in the form of a secure dividend yield or book value support. These stocks typically offer attractive valuations and with limited downside risk.
But in emerging markets, just being cheap is not enough. So, we look for a re-rating catalyst. This is where our research team comes in. Re-rating catalysts might be external to the company (e.g., industry structure change, or an improving macro environment) or internal (ROE/ROIC improvement, change in management, improved capital allocation policy, restructuring, etc.). Such change can drive a significant re-rating on the stock.
The emerging markets universe is wide and deep. We are able to find attractive upside potential in stocks that other investors are not always focused on.
The fund currently reports about a quarter million in its portfolio. The initial expense ratio, after waivers, is 1.5%. The minimum initial investment is just $1,000.
Funds in Registration
There are fifteen or so new funds in registration this month. Funds in registration with the SEC are not available for sale to the public and the advisors are not permitted to talk about them, but a careful reading of the filed prospectuses gives you a good idea of what interesting (and occasionally appalling) options are in the pipeline. The funds in registration now have a good chance of launching on December 31, which is critical to allowing them to report full-year results for 2016.
There are some interesting possibilities. Joe Huber is launching a mid-cap fund. ASTON will have an Asia dividend one. And Homestead is launching their International II fund, sub-advised by Harding Loevner.
Manager Changes
Chip tracked down 63 manager changes this month, a fairly typical tally. This month continues the trend of many more women being removed from management teams (9) than added to them (1). There were a few notable changes. The outstanding Boston Partners Long/Short Equity Fund (BPLEX) lost one of its two co-managers. Zac Wydra left Beck Mack & Oliver Partners Fund (BMPEX) to become CIO of First Manhattan Corporation. In an unusual flurry, Kevin Boone left Marsico Capital, then Marsico Capital got booted from the Marsico Growth FDP Fund (MDDDX) that Kevin co-managed, then the fund promptly became the FDP BlackRock Janus Growth Fund.
The Navigator: Fund research fast
 One of the coolest resources we offer is also one of the least-used: The Navigator. It’s located on the Resources tab at the top-right of each page. If you enter a fund’s name or ticker symbol in The Navigator, it will instantly search 27 sites for information on the fund:
If you click on any of those links, it takes you directly to the site’s profile of the fund. (Did you even know The Google had fund pages? They do.)
Updates: INNAX, liquidity debate
 In October we featured Capital Innovations Global Agri, Timber, Infrastructure Fund (INNAX) in our Elevator Talk. Energy-light portfolio, distinctive profile given their focus on “soft” resources like trees and cattle. Substantially above-average performance. They’d just passed their three year anniversary and seven days later they received their inaugural star rating from Morningstar. They’re now recognized as a four star fund within the natural resources group.
We’ve argued frequently that liquidity in the U.S. securities market, famously the most liquid in the world, might be drying up. The translation is: you might not be able to get a fair price for your security if you need to sell at the same time lots of other people are. The SEC is propounding rules to force funds to account for the liquidity of their holdings and to maintain a core of highly-liquid securities that would be sufficient to cover several days’ worth of panicked redemptions. The Wall Street Journal provided a nice snapshot of the potential extent of such problems even in large, conservative fixed-income funds. Using the ability to sell a security within seven days, the article “Bond funds push limits” (9/22/2015) estimates the extent of illiquid assets in five funds:
|
Vanguard High-Yield Corporate
|
40%
|
|
American Funds American High-Income
|
39%
|
|
Vanguard Long-Term Investment Grade
|
39%
|
|
Dodge & Cox Income
|
31%
|
|
Lord Abbett Short Duration Income
|
29%
|
Between them, those funds hold $130 billion. The Investment Company Institute, the industry’s mouthpiece, immediately denounced the story.
It’s not quite The Satanic Verses, but ….
 In October, Jason Zweig published his The Devil’s Financial Dictionary
 . The title, of course, draws from Ambrose Bierce’s classic The Devil’s Dictionary (1906). Critics of Wall Street still nod at entries like “Finance: the art or science of managing revenues or resources for the best advantage of the manager.”
With a combination of wit and a long career during which he incubates both insight and annoyance, Jason wrote what’s become a bedside companion for me. It’s full of short, snippy entries, each of which makes a point that bears making. I think you’d enjoy it, even if you’re the object of it.
Financial Journalist, n. Someone who is an expert at moving words about markets around on a page or screen until they sound impressive, regardless of whether they mean anything. Until the early 20th century, financial journalists knew exactly what they were doing, as many of them were paid overtly or covertly by market manipulators to promote or trash various investments … Nowadays, most financial journalists are honest, which is progress—and ignorant, which isn’t.
Another thing to be thankful for: New data and our impending launch
We’ll be writing to the 6,000 or so of you on our mailing list in the next week or so with updates about our database and other analytics, as well as word of the formal launch of the “MFO premium” site, which will give all of our contributors access to all of this stuff and more.
 Comparing Lipper Ratings

MFO recently started computing its risk and performance fund metrics and attendant fund ratings using the Lipper Data Feed Service for U.S. Open End funds. (See MFO Switches To Lipper Database.) These new data have now been fully incorporated on the MFO Premium beta site, and on the Great Owl, Fund Alarm, and Dashboard of Profiled Funds pages of our legacy Search Tools. (The Risk Profile and Miraculous Multi-Search pages will be updated shortly).
Last month we noted that the biggest difference MFO readers were likely to find was in the assigned classifications or categories, which are described in detail here. (Morningstar’s categories are described here, and Lipper nicely compares the two classification methodologies here.) Some examples differences:
- Lipper uses “Core” instead of “Blend.” So, you will find Large-Cap Growth, Large-Cap Core, and Large Cap Value.
- Lipper includes a “Multi-Cap” category, in addition to Large-Cap, Medium-Cap, and Small-Cap. “Funds that, by portfolio practice, invest in a variety of market capitalization ranges …” Examples are Vanguard Total Stock Market Index Inv (VTSMX), Auxier Focus Inv (AUXFX), and Bretton (BRTNX).
- Lipper does not designate an “Asset Allocation” category type, only “Equity” and “Fixed Income.” The traditional asset allocation funds, like James Balanced: Golden Rainbow Retail (GLRBX) and Vanguard Wellesley Income Inv (VWINX) can be found in the categories “Mixed-Asset Target Allocation Moderate” and “Mixed-Asset Target Allocation Conservative,” respectively.
- Lipper used “Core Bond” instead of say “Intermediate-Term Bond” to categorize funds like Dodge & Cox Income (DODIX).
- Lipper extends data back to January 1960 versus January 1962. Number of funds still here today that were here in January 1960? Answer: 72, including T Rowe Price Growth Stock (PRGFX).
A few other changes that readers may notice with latest update:
- Ratings for funds in all the commodities categories, like Commodities Agriculture, where previously we only included “Broad Basket.”
- Ratings for funds of leveraged and short bias categories, so-called “trading” funds.
- Ratings for 144 categories versus 96 previously. We continue to not rate money market funds or funds less than 3 months old.
- No ratings for funds designated as a “variable insurance product,” which typically cannot be purchased directly by investors. Examples are certain Voya, John Hancock, and Hartford funds.
- There may be a few differences in the so-called “Oldest Share Class (OSC)” funds. MFO has chosen to define OSC as share class with earliest First Public Offering (FPO) date. (If there is a tie, then fund with lowest expense ratio. And, if tied again, then fund with largest assets under management.)
Overall, the changes appear quite satisfactory.
Briefly Noted . . .
Columbia Acorn Emerging Markets (CAGAX) has lifted the cap on what constitutes “small- and mid-sized companies,” their target universe. It has been $5 billion. Effective January 1 their limit bumps to $10 billion. That keeps their investment universe roughly in line with their benchmark’s.
Goldman Sachs Fixed Income Macro Strategies Fund (GAAMX) is making “certain enhancements” to its investment strategies. Effective November 20, 2015, the Fund will use a long/short approach to invest in certain fixed income securities. The trail of the blue line certainly suggests that “certain enhancements” might well be in order.
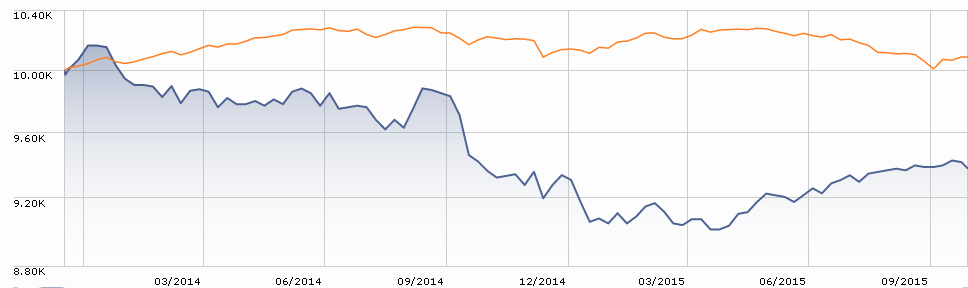
Here’s something I’ve not read before: “The shareholder of Leland Thomson Reuters Private Equity Index Fund (LDPAX) … approved changing the Fund’s classification from a diversified Fund to a non-diversified Fund under the Investment Company Act of 1940.”
SMALL WINS FOR INVESTORS
Not a lot to cheer for.
CLOSINGS (and related inconveniences)
The closure of the 361 Managed Futures Strategy Fund (AMFQX/ AMFZX) has been delayed “until certain administrative and other implementation matters have been completed.” The plan is to close by December 31, 2015.
The shareholders of Hennessy Cornerstone Large Growth Fund, the Hennessy Cornerstone Value Fund, and the Hennessy Large Value Fund bravely voted to screw themselves by adding 12(b)1 fees to their funds, beginning on November 1, 2015. The Hennessy folks note, in passing, that “This will increase the fees of the Investor Class shares of such Hennessy Funds.”
Invesco European Small Company Fund (ESMAX) will close to new investors on November 30, 2015. By pretty much all measures, it offers access to higher growth rates at lower valuations than the average European stock fund does. The question for most of us is whether such a geographically limited small cap fund ever makes sense.
Effective after November 13, 2015, the RiverNorth/DoubleLine Strategic Income Fund (RNDLX) is closed to new investors.
OLD WINE, NEW BOTTLES
On December 30, the microscopic and undististinguished Alger Analyst Fund (SPEAX) will become Alger Mid Cap Focus Fund. Usually when a fund highlights Analyst in its name, it’s run by … well, the firm’s analysts. “Research” often signals the same thing. In this case, the fund has been managed since inception by CEO/CIO Dan Chung. After the name change, the fund will be managed by Alex Goldman.
In one of those “I just want to slap someone” moves, the shareholders of City National Rochdale Socially Responsible Equity Fund (AHRAX) are voting on whether to become the Baywood SociallyResponsible Fund. The insistence of fund firms to turn two words into one word is silly but I could imagine some argument about the ability to trademark a name that’s one word (DoubleLine) that wouldn’t be available if it were two. But mashed-together with the second half officially italicized? Really, guys? The fact that the fund has trailed 97% of its peers over the past decade suggests the need to step back and ask questions more probing than this.
Effective December 31, 2015, Clearbridge Global Growth (LGGAX) becomes ClearBridge International Growth Fund.
Oppenheimer International Small Company Fund (OSMAX) becomes Oppenheimer International Small-Mid Company Fund on December 30, 2015. It’s a very solid fund except for the fact that, at $5.1 billion, is no longer targets small caps: 75% of the portfolio are mid- to large-cap stocks.
On January 11, 2016, the Rothschild U.S. Large-Cap Core Fund, U.S. Large-Cap Value, U.S. Small/Mid-Cap Core, U.S. Small-Cap Core, U.S. Small-Cap Value and U.S. Small-Cap Growth funds will become part of the Pacific Funds Series Trust. Rothschild expects that they’ll continue to manage the year-old funds with Pacific serving as the parent. The new fund names will be simpler than the old and will drop “U.S.”, though the statement of investment strategies retains U.S. as the focus. The funds will be Pacific Funds Large Cap, Large Cap Value, Small/Mid-Cap, Small-Cap, Small-Cap Value and Small-Cap Growth. It appears that the tickers will change.
On December 18, 2015, SSgA Emerging Markets Fund (SSELX) will become State Street Disciplined Emerging Markets Equity Fund, leading mayhap to speculation that it hadn’t been disciplined up until then. The fund will use quant screens “to select a portfolio that the Adviser believes will exhibit low volatility and provide competitive long-term returns relative to the Index.”
As part of a continuing series of fund adoptions, Sound Point Floating Rate Income Fund (SPRFX) will reorganize into the American Beacon Sound Point Floating Rate Income Fund.
Effective October 28, 2015, Victory Fund for Income became Victory INCORE Fund for Income. Presumably because the audience arose, applauding and calling “incore! incore!” Victory Investment Grade Convertible Fund was also rechristened Victory INCORE Investment Grade Convertible Fund.
And, too, Victory renamed all of its recently-acquired Compass EMP funds. The new names will all begin Victory CEMP. So, for example, in testing the hypothesis that no name is too long and obscure to be attractive, Compass EMP Ultra Short-Term Fixed Income Fund (COFAX) will become Victory CEMP Ultra Short Term Fixed Income Fund.
Voya Growth Opportunities Fund changed its name to Voya Large-Cap Growth Fund.
OFF TO THE DUSTBIN OF HISTORY
3D Printing, Robotics and Technology Fund (TDPNX) will liquidate on November 13, 2015. In less than two years, the managers lost 39% for their investors while the average tech fund rose 20%. The Board blamed “market conditions and economic factors” rather than taking responsibility for a fatally-flawed conception. Reaction on the Observer’s discussion board was limited to a single word: “surprised?”
Not to worry, 3D printing fans! The ETF industry has rushed in to fill the (non-existent) gap with the pending launch of the ARK 3D Printing ETF.
Acadian Emerging Markets Debt Fund (AEMDX) has closed and will liquidate on November 20, 2015. It’s a $36 million institutional fund that’s had one good year in five; otherwise, it trailed 70-98% of its peers. Performance seems to have entirely fallen off a cliff in 2015.
AllianzGI NFJ All-Cap Value Fund (PNFAX) is slated for liquidation on December 11, 2015. Their International Managed Volatility (PNIAX) and U.S. Managed Volatility (NGWAX) funds will follow on March 2, 2016. The theory says that managed volatility funds should be competitive with their benchmarks over the long term by limiting losses during downturns. The latter two funds suffered because they couldn’t consistently manage that feat.
Carne Hedged Equity Fund (CRNEX) was a small, decent long/short fund for four years. Then the recent past happened; the fund went from well above average through December 2013 to well below average since. Finally, the last week of October 2015 happened. Here’s the baffling picture:
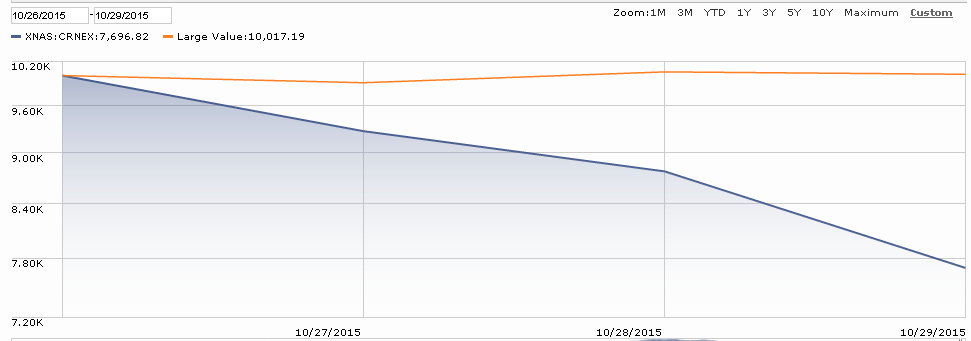
Right: 23% loss over four days in a flat market. No word on the cause, though the liquidation filing does refer to a large redemption and anticipated future redemptions. (Ya think?) So now it’s belatedly becoming “a former fund.” Graveside services will be conducted December 30, 2015.
Forward continues … in reverse? To take one step Forward and two back? Forward Global Dividend Fund (FFLRX) will liquidate on November 17th and the liquidation of Forward Select EM Dividend Fund will occur on December 15, 2015. Those appear to be Forward’s fifth and sixth liquidations in 2015, and the fourth since being acquired by Salient this summer.
In order “to optimize the Goldman Sachs Funds and eliminate overlap,” Goldman Sachs has (insightfully) decided to merge Goldman Sachs International Small Cap Fund (GISAX) into Goldman Sachs International Small Cap Insights Fund (GISAX). The target date is February, 2016. That’s a pretty clean win for shareholders. GISAX is, by far, the larger, stronger and cheaper option.
GuideMark® Global Real Return Fund has been liquidated and terminated and, for those of you who haven’t yet gotten the clue, “shares of the Fund are no longer available for purchase or exchange.”
JPMorgan U.S. Research Equity Plus Fund (JEPAX) liquidated after fairly short notice on October 28, 2015. It was a long/short fund of the 130/30 variety: it had a leveraged long position and a short portfolio which together equaled 100% long exposure. That’s an expensive proposition whose success relies on your ability to get three or four things (extent of leverage, target market exposure, long and short security selection) consistently and repeatedly right. Lipper helpfully classifies it as a “Lipper Alternative Active Extension Fund.” It had a few good years rather precisely offset by bad years; in the end, the fund charged a lot (2.32% despite a mystifying Morningstar report of 1.25%), churned the portfolio (178% per year) but provided nothing special (its returns exactly matched the average 100% long large cap fund).
Larkin Point Equity Preservation Fund (LPAUX), a two-year-old long/short fund of funds, will neither preserve or persevere much longer. It has closed and expects to liquidate on November 16, 2015.
On October 16, 2015, Market Vectors got out of the Quality business as they bumped off the MSCI International Quality, MSCI Emerging Markets Quality Dividend, MSCI International Quality Dividend and MSCI Emerging Markets Quality ETFs.
The Board of Trustees of The Royce Fund recently approved the fund reorganizations effective in the first half of 2016. In the first half of 2016, Royce International Premier (RIPN) will eat two of its siblings: European Small Cap (RESNX) and Global Value (RGVIX). Why does it make sense for a $9 million fund with no star rating to absorb its $22 million and $62 million siblings? Of course, Royce is burying a one-star fund that’s trailed 90% of its peers over the past five years. And, too, a one-star fund that’s trailed 100% in the same period. Yikes. Global Value averaged 0.8% annually over the past five years; its average peer pumped out ten times as much.
While they were at it, Royce’s Board of Trustees approved a plan of liquidation for Royce Micro-Cap Discovery Fund (RYDFX), to be effective on December 8, 2015. The $5 million fund is being liquidated “primarily because it has not attracted and maintained assets at a sufficient level for it to be viable.” That suggests that International Micro Cap (ROIMX) with lower returns, two stars and $6 million in assets might be next in line.
Salient MLP Fund (SAMCX) will liquidate on December 1, 2015. Investors will continue to be able to access the management team’s skills through Salient MLP & Energy Infrastructure Fund II (SMAPX) which has over a billion in assets. It’s not a particularly good fund, but it is better than SAMCX.
Schroder Global Multi-Cap Equity Fund (SQQJX) liquidated on October 27, 2015, just days short of its fifth anniversary.
Sirios Focus Fund (SFDIX) underwent “final liquidation” on Halloween, 2015. It’s another fund abandoned after two years of operation.
Tygh Capital Management has recommended the liquidation of its TCM Small-Mid Cap Growth Fund (TCMMX). That will occur just after Thanksgiving.
Touchstone Growth Allocation Fund (TGQAX) is getting absorbed by Touchstone Moderate Growth Allocation Fund (TSMAX) just before Thanksgiving. Both have pretty sad records, but Growth has the sadder of the two. At the same time, Moderate Growth brings in managers Nathan Palmer and Anthony Wicklund from Wilshire Associates. Wilshire replaces Ibbotson Associates (a Morningstar company) as the fund’s advisor. Both are funds-of-mostly-Touchstone funds. After the repositioning, Moderate Growth will offer 40% non-US exposure with 45-75% of its assets in equities. Currently Growth is entirely equities.
UBS Multi-Asset Income Fund (MAIAX) will liquidate on or about December 3, 2015.
The Virtus Disciplined Equity Style (VDEAX), Virtus Disciplined Select Bond (VDBAX) and Virtus Disciplined Select Country (VDCAX) funds will close on November 20th and will liquidate by December 2, 2015. They share about $7 million in assets and a record of consistent underperformance.
Virtus Dynamic Trend Fund (EMNAX) will merge into Virtus Equity Trend Fund (VAPAX), they’re hoping sometime in the first quarter of 2016. I have no idea of why, since EMNAX has $600 million and a better record than VAPAX.
In Closing . . .
In a good year, nearly 40% of our Amazon revenue is generated in November and December. That’s in part because I endlessly nag people about how ridiculously simple, painless and useful it is to bookmark our Amazon link or set it as one of your tabs that opens whenever you start your favorite browser.
Please don’t make me go find some cute nagging-related image to illustrate this point. Just bookmark our Amazon link or set it as an opening tab. That would help so me. Here’s the link http://www.amazon.com/?_encoding=UTF8&tag=mutufundobse-20. Alternatively, you can click on the banner.
A quick tip of the cap to folks who made tax-deductible contributions to the Observer this month: regular subscribers, Greg and Deb; PayPal contributors, Beatrice and David; and those who preferred to mail checks, Marjorie, Tom G. and the folks at Ultimus Fund Solutions. We’re grateful to all of you.
 The fund managers I’ve spoken with are nearly unanimous in their loathing of Schwab. Words like “arrogant, high-handed and extortionate” capture the spirit of their remarks. I hadn’t dealt with the folks at Schwab until now, so mostly I nodded sympathetically. I now nod more vigorously.
It’s likely that we’ll be in the vicinity of, but not at, the Schwab IMPACT conference in November. We requested press credentials and were ignored for a good while. Then after poking a couple more times, we were reminded of how rare and precious they were and were asked to submit examples of prior conference coverage. We did, on September 28th. That’s the last we heard from them so we’ll take that as a “we’re Schwab. Go away, little man.” Drop us a note if you’re going to be there and would like to chat at some nearby coffee shop.
We’ll look for you.


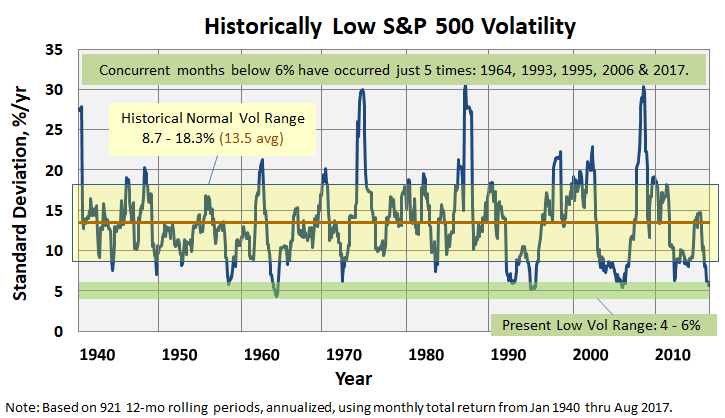
 For those of us who teach, August is a bittersweet month. Each year we approach summer like a gaggle of penitent drunks. This time, we promise, it’ll be different. We’ll do better. Trust us: we will revise all of our courses for fall. We will catch up on that mountain of books heaped beside the chair. We will finish that book manuscript (Miscommunication in the Workplace, 2d ed., in my case.). On top of which, we’ll see our children without the use of small electronic devices, we’ll be out there running at 6:00 each morning, we’ll get our roughage and


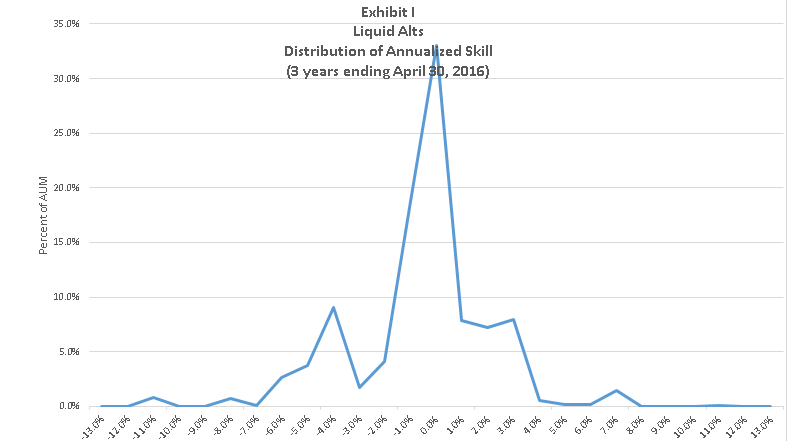
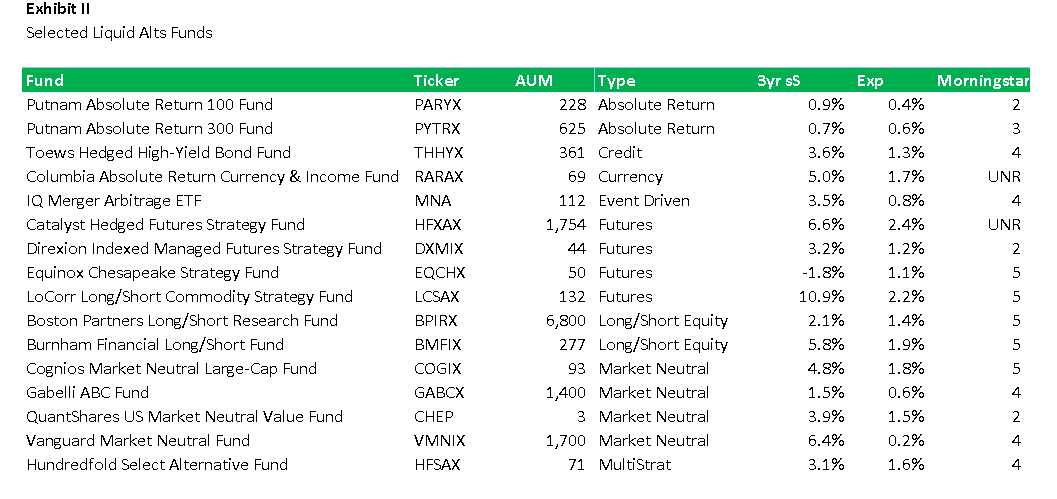
 What’s the Trapezoid story? Leigh Walzer has over 25 years of experience in the investment management industry as a portfolio manager and investment analyst. He’s worked with and for some frighteningly good folks. He holds an A.B. in Statistics from Princeton University and an M.B.A. from Harvard University. Leigh is the CEO and founder of Trapezoid, LLC, as well as the creator of the Orthogonal Attribution Engine. The Orthogonal Attribution Engine isolates the skill delivered by fund managers in excess of what is available through investable passive alternatives and other indices. The system aspires to, and already shows encouraging signs of, a fair degree of predictive validity.
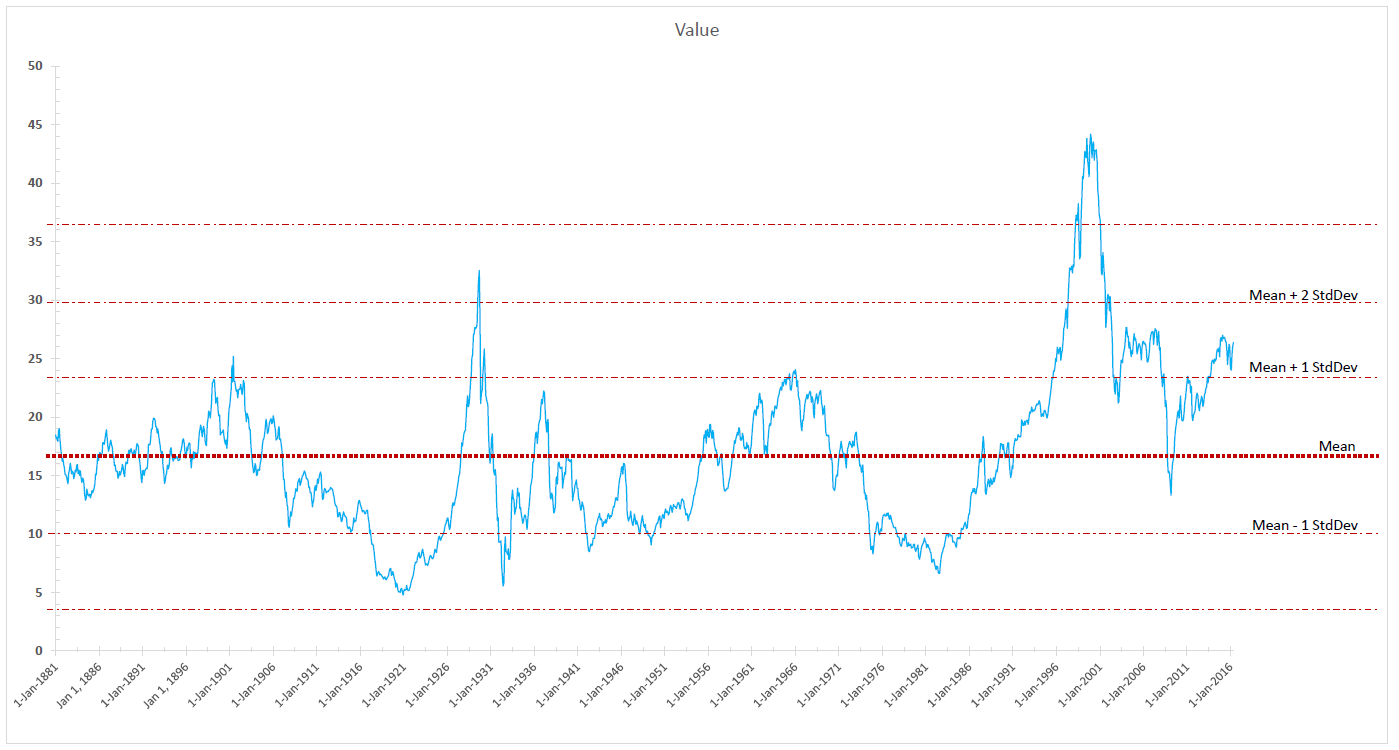
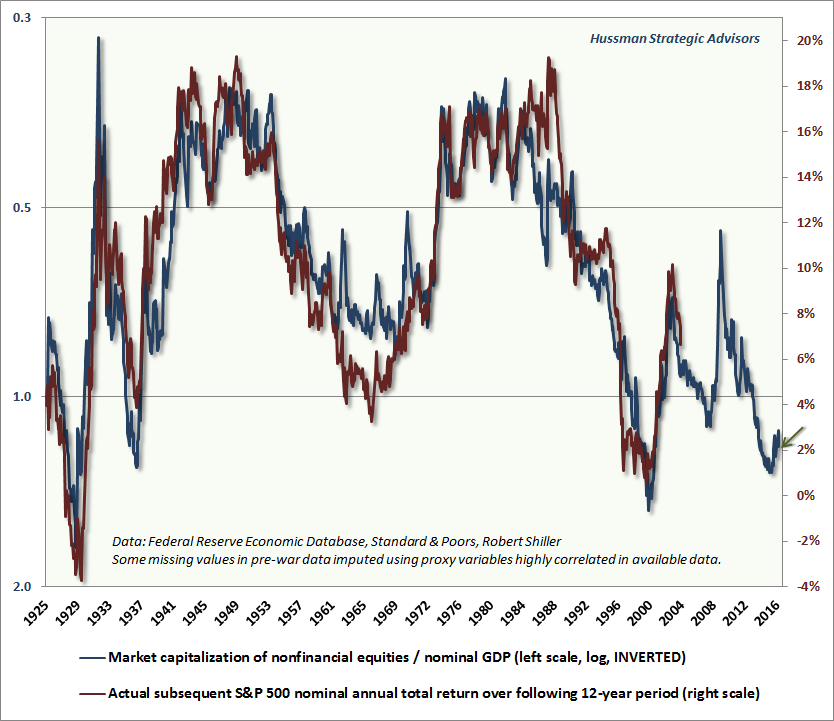
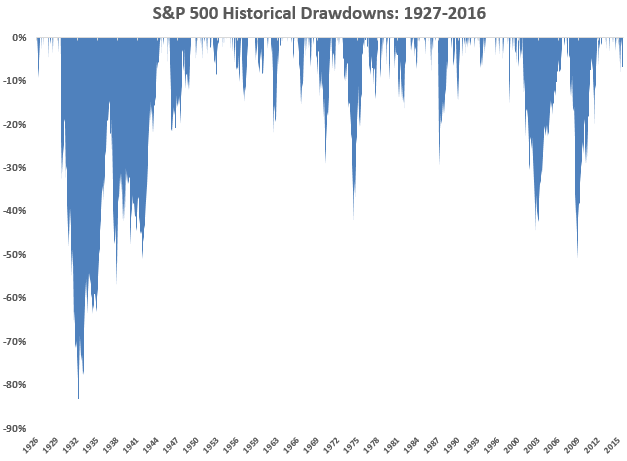 I think of this as “the icicle chart.” Ben Carlson, one of the Ritholtz managers, wrote a really thoughtful essay, rich in visuals, in April. He posted it on his Wealth of Commonsense blog under the name “
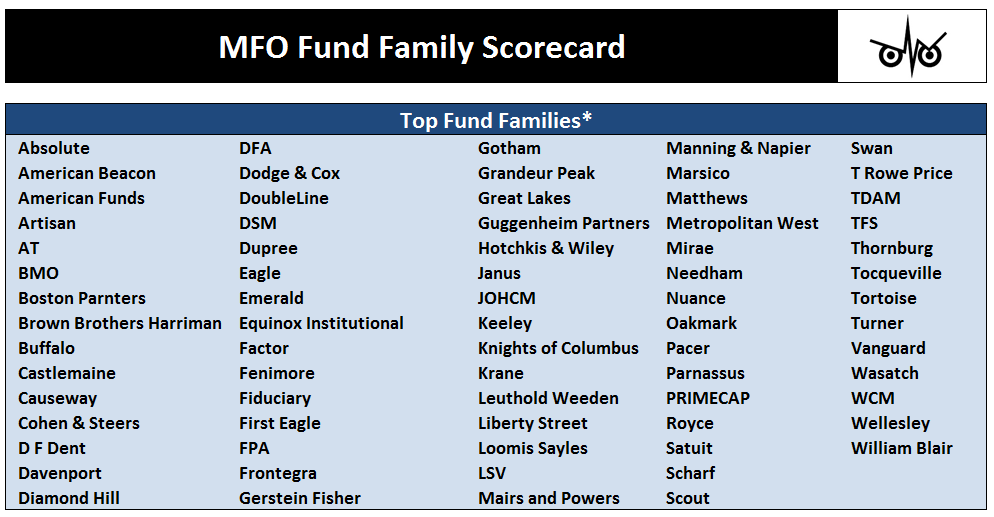
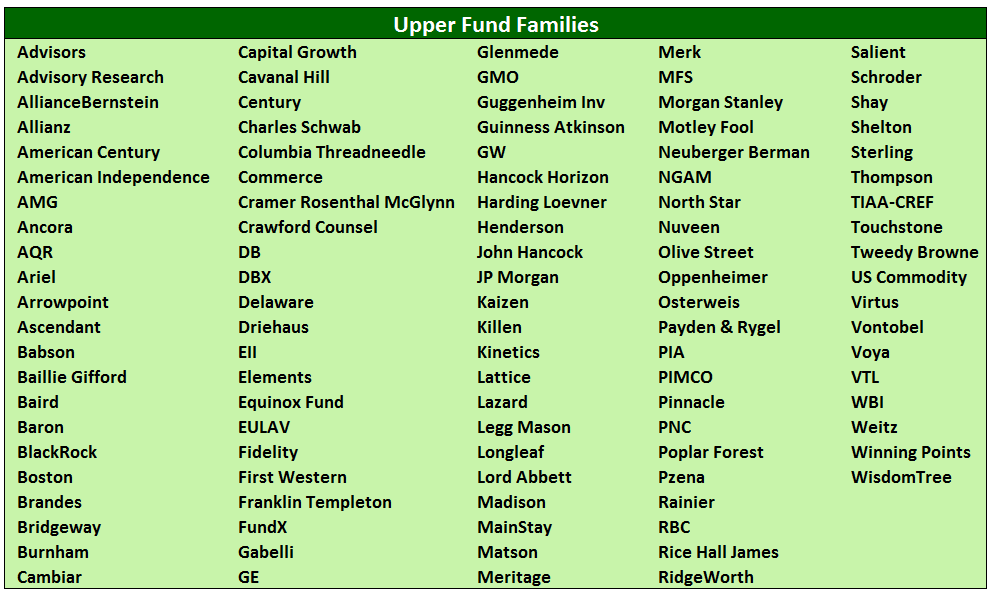
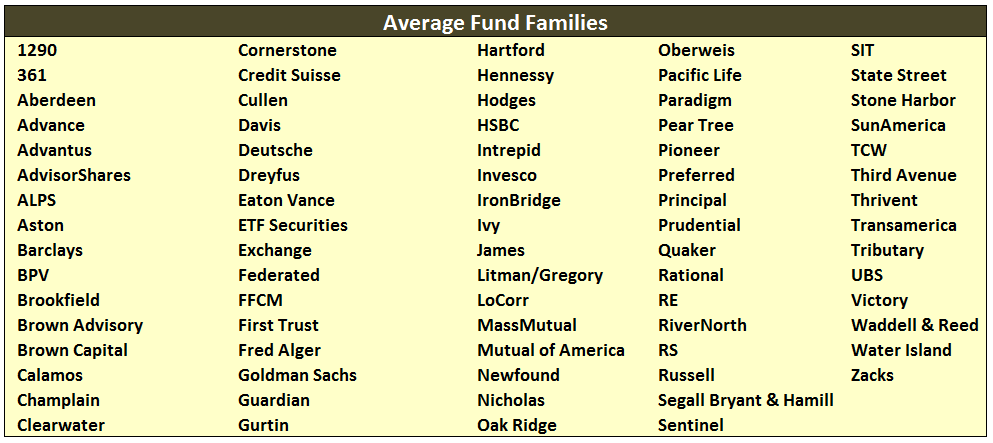
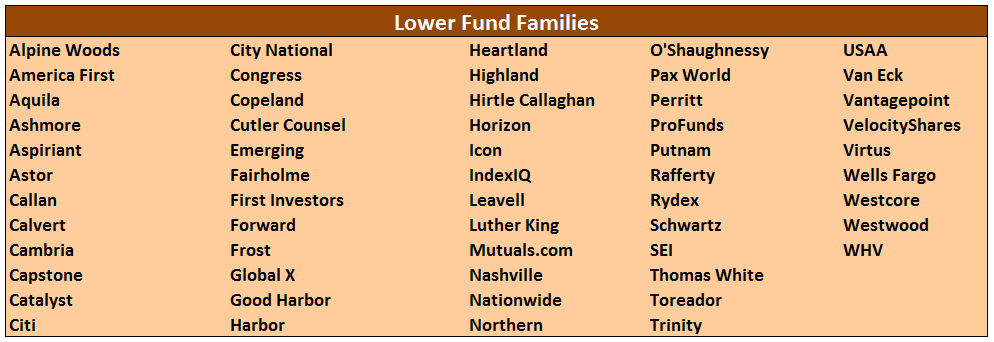
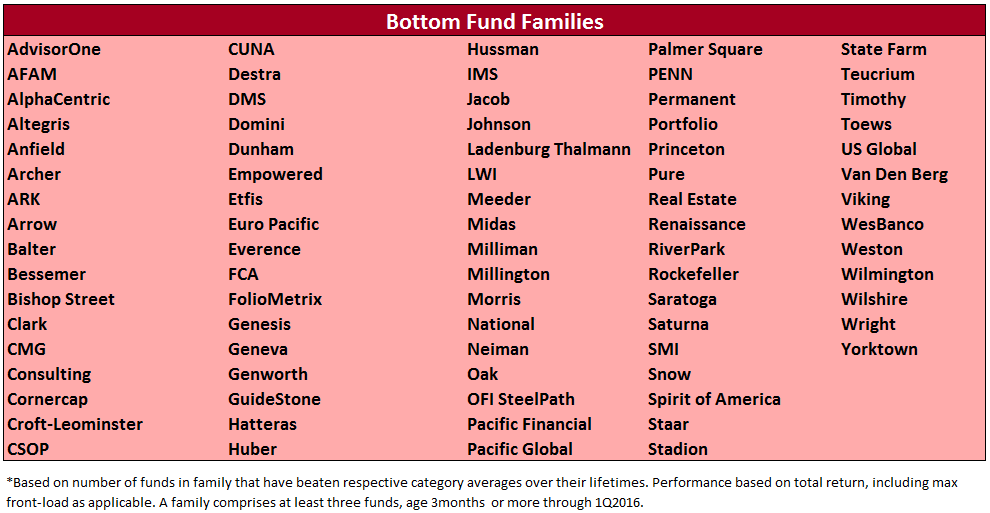

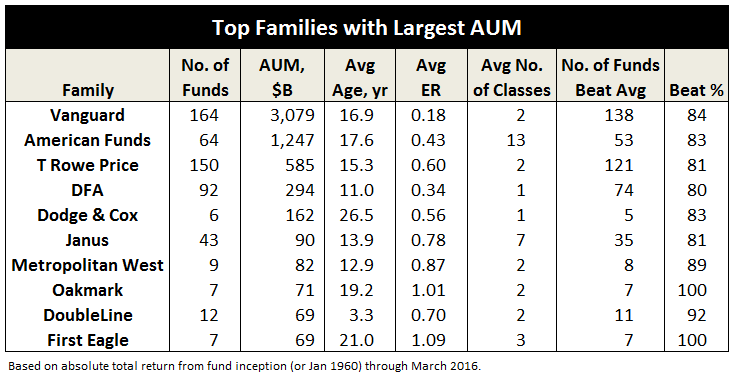
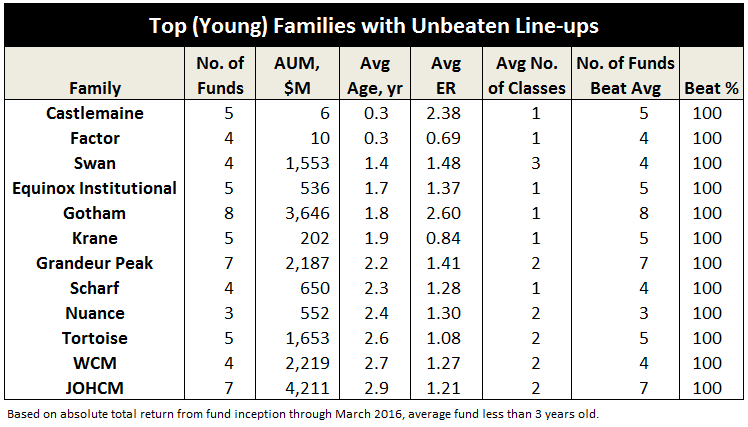
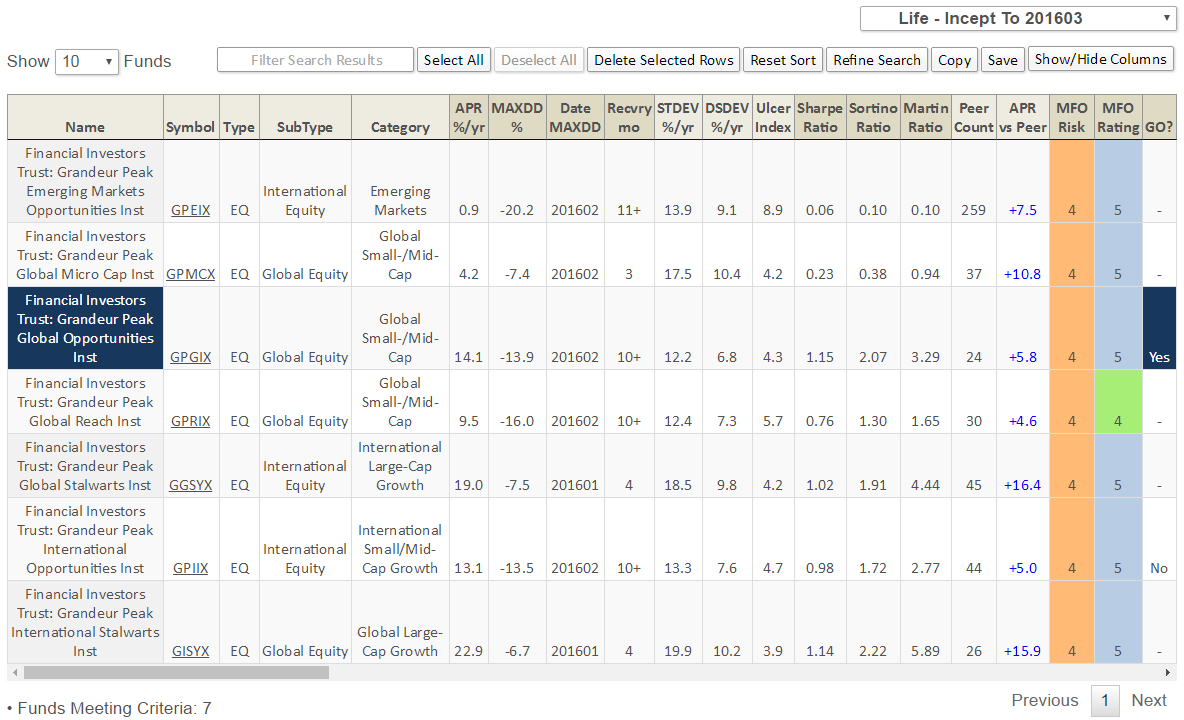
 The best performing asset class in this quarter has been – gold. Actually the best performing asset class has been the gold miners, with silver not too far behind. We have had gold with a mid-teen’s total return. And depending on which previous metals vehicle you have invested in, you may have seen as much as a 60%+ total return (looking at the germane Vanguard fund). Probably the second best area generically has been energy, but again, you had to choose your spots, and also distinguish between levered and unlevered investments, as well as proven reserves versus hopes and prayers.
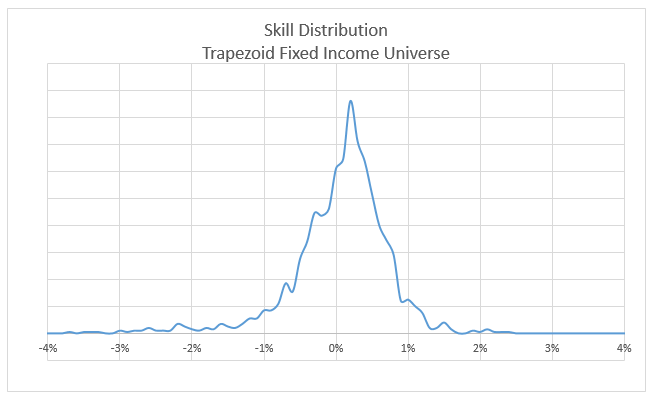
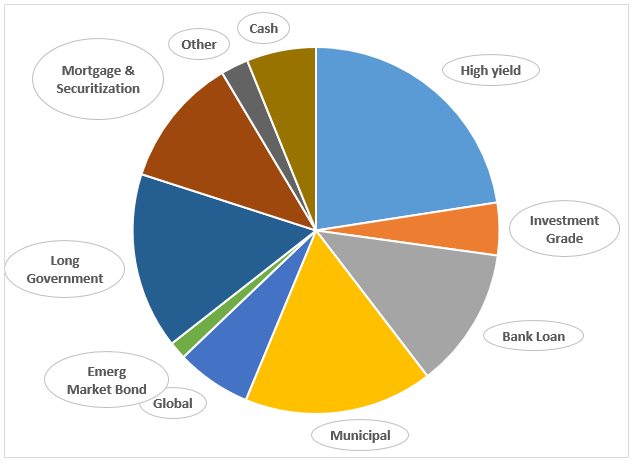
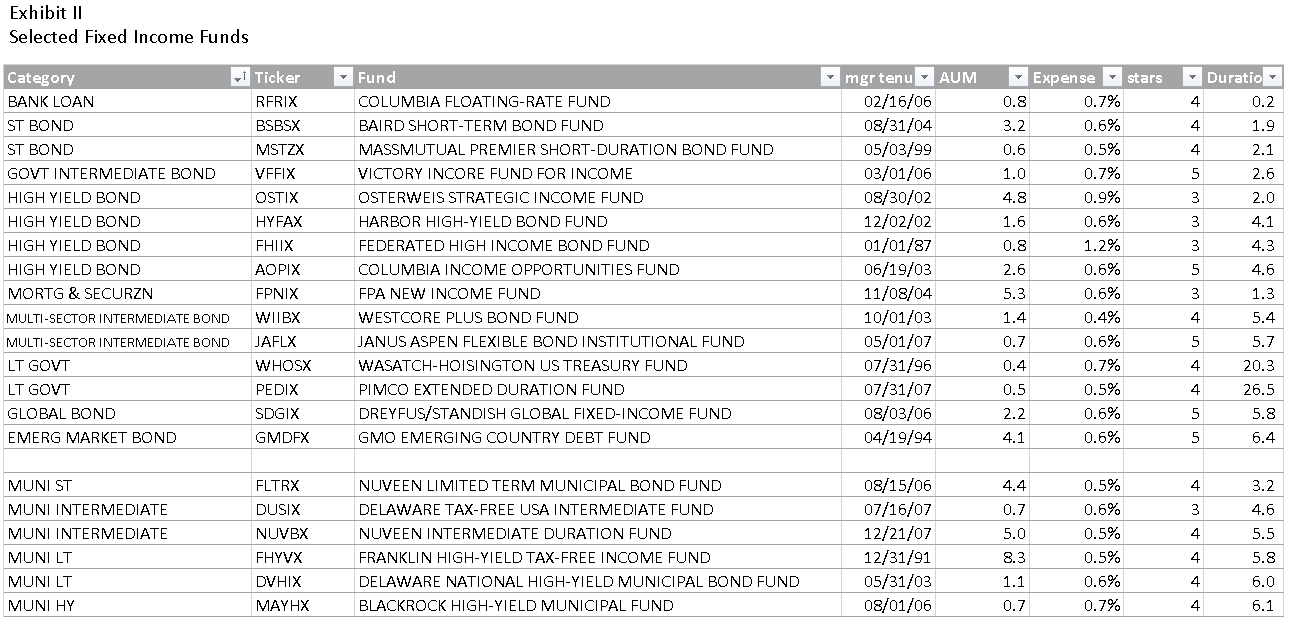
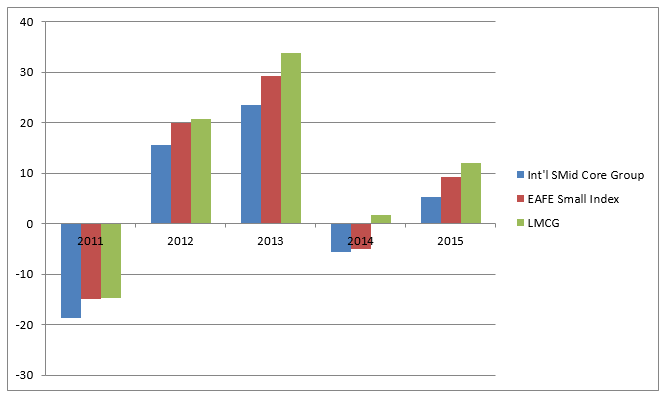
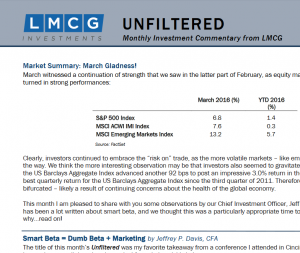 The
The  We’ve been following Bob’s posts for the past 10 or 15 years where, as BobC, he’s been one of the most respected, thoughtful and generous contributors to our discussion board and the FundAlarm’s before that. The Observer aspires to serve two communities: the small, independent managers who are willing to stray from the herd and who are passionate about what they do (rather than about how much they can make) and the individual investors who deserve better than the timid, marketing-driven pap they’re so often fed. As we begin our sixth year, we thought that finding someone who is both active in the industry and broad in mind and spirit would allow us to serve folks better.
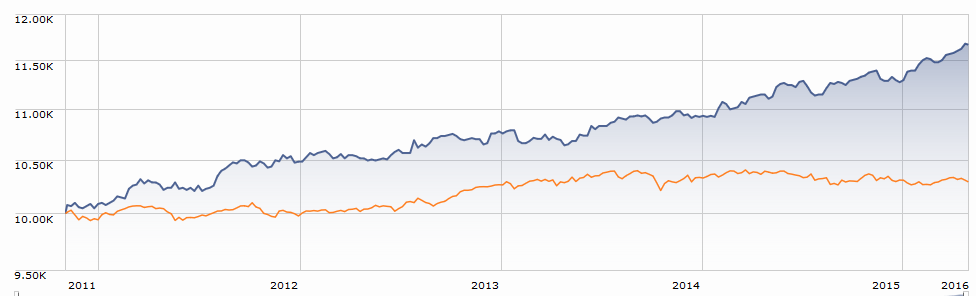
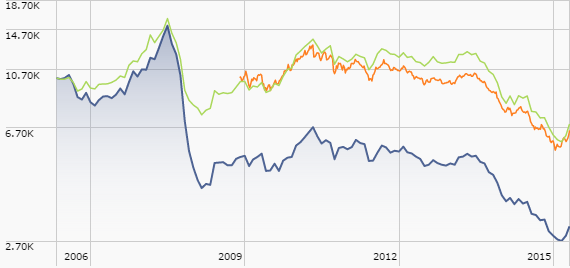
 A queer and wonderful ride. Bernie Klawans – an aerospace engineer – ran it for decades, from 1971-2011, likely out of his garage. One-page website, no 800-number, no reports or newsletters or commentaries. Also an incredibly blurry logo that might well have been run through a mimeograph machine once or twice. Mr. Klawans brought on a successor when he was in his late 80s, worked with him for a couple years, retired in April and passed away within about six months. Then his chosen successor, Craig Arnholt, died unexpectedly within a year. The Board of Trustees actually managed the fund for six months (quite successful – they beat both their LV peers and the S&P) before finding a manager who’d run the fund for a pittance. The new guy was doing fine then … kapow! He lost 22% in September and October of 2014, when the rest of the market was essentially flat. That was a combination of a big stake in Fannie and Freddie – adverse court ruling cut their market value by half in a month – and energy exposure. He’s been staggering toward the cliff ever since.


 Artisan has announced the liquidation of Artisan Small Cap Value (ARTVX), my oldest holding. My first fund, purchased when I was young and dumb, was AIM Constellation, then a very good mid-cap growth fund that carried a 5.5% load. After a bit, I learned that paying sales loads without any compensating benefit was stupid, so I stopped. I sold my shares and, shortly before it closed, invested the proceeds in Artisan Small Cap (ARTSX). Shortly after Artisan launched Small Cap Value in 1997, I moved my investment over from Small Cap. The $367 million fund, down from a peak of $3 billion in 2011, will be merged into Artisan Mid Cap Value (ARTQX) in May, 2016.
 My single largest non-retirement holding is FPA Crescent (FPACX), which has always struck me as the quintessence of active management. While other managers were constrained to invest in a single asset class or in a single country, or to remain fully invested or unhedged, manager Steve Romick declared himself to be “the free-range chicken” of the investing world. He’d look for firms that offered compelling advantages, would analyze their capital structure and then invest in whatever instrument – common stock, warrants, senior debt – offered the most compelling opportunities. If nothing was compelling, he sat on cash.
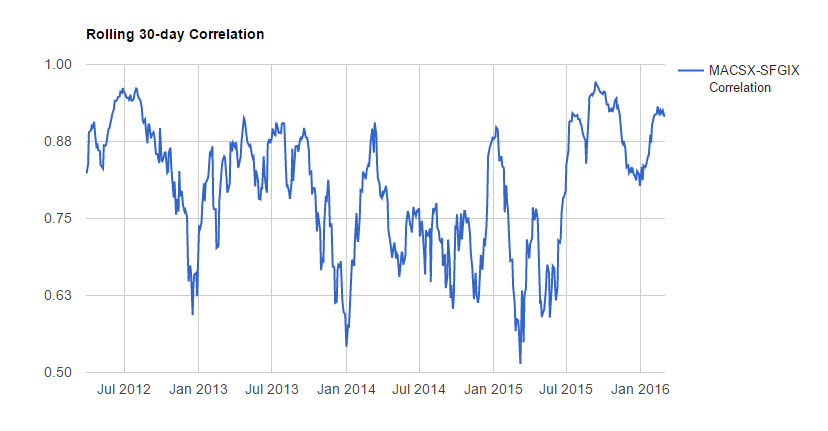
 “When we unleash the dogs of war, we must go where they take us.”
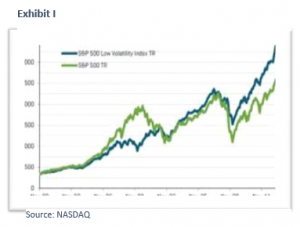 As Exhibit I illustrates low-volatility has been a successful investment strategy in recent years. A good argument can be made that historically, low-volatility stocks were mispriced. Players like Berkshire Hathaway and private equity capitalized on this by levering up these firms to deliver strong risk-adjusted returns. There is a heavy overlap between the low-volatility universe and the high-dividend universe. Many high-dividend stocks have dropped assets into REITs in recent years which have fueled better returns for this sector. Low volatility has outperformed the broad market meaningfully for the past two quarters, partly due its lower beta.
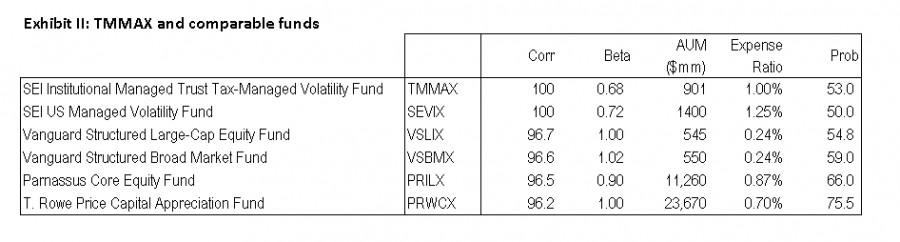
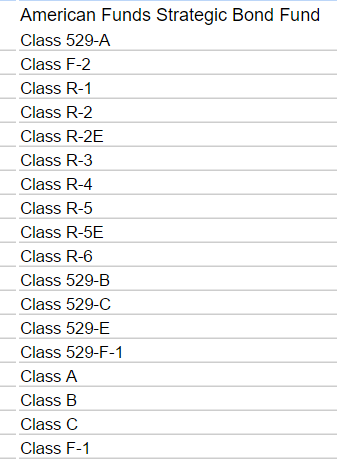
 When MFO
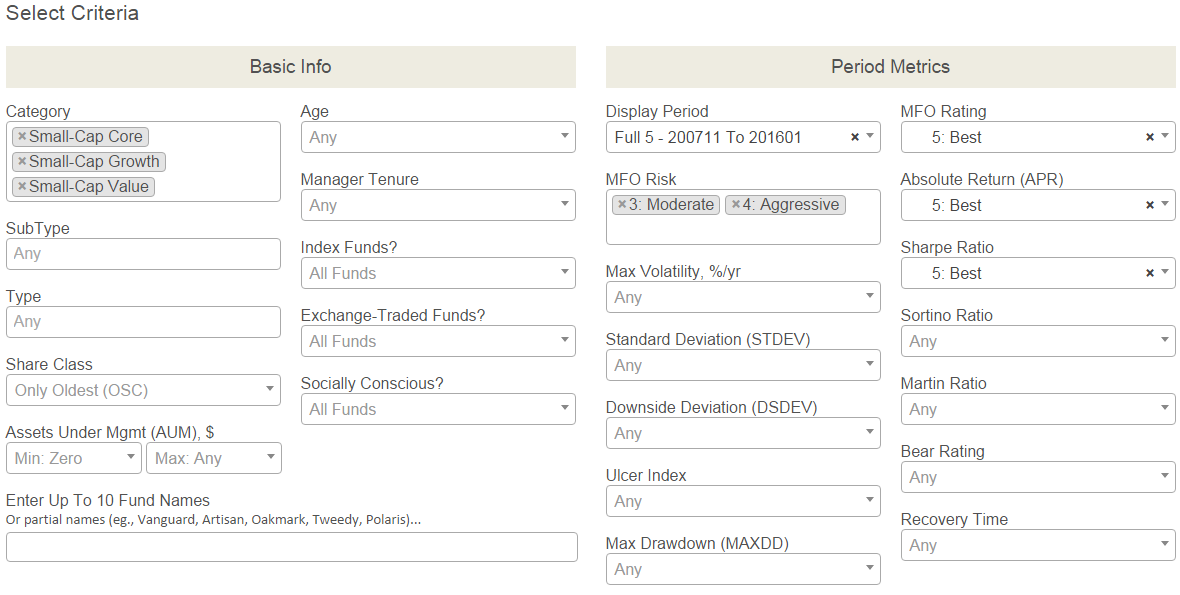
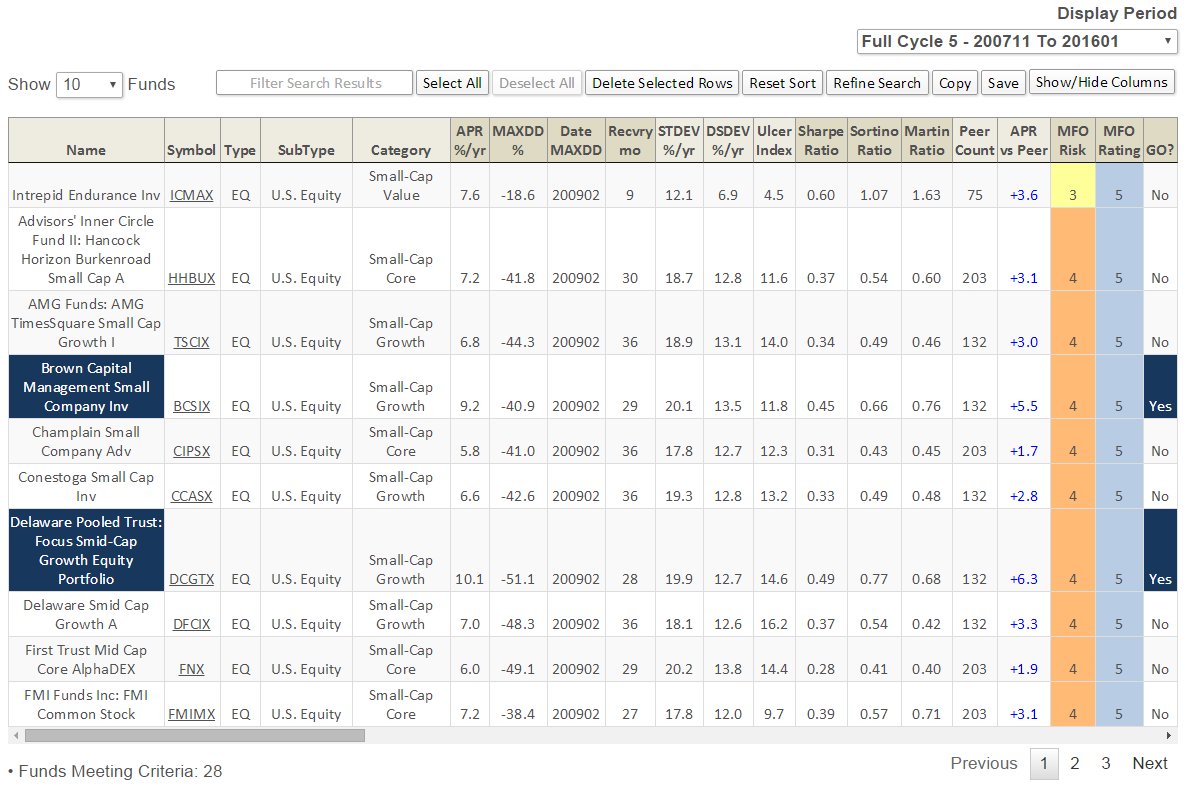
 Pruning Season
 Since the number of funds we can cover in-depth is smaller than the number of funds worthy of in-depth coverage, we’ve decided to offer one or two managers each month the opportunity to make a 200 word pitch to you. That’s about the number of words a slightly-manic elevator companion could share in a minute and a half. In each case, I’ve promised to offer a quick capsule of the fund and a link back to the fund’s site. Other than that, they’ve got 200 words and precisely as much of your time and attention as you’re willing to share. These aren’t endorsements; they’re opportunities to learn more.
 Jim Robinson formed Robinson Capital Management, located in Detroit’s ritzy Grosse Pointe suburb, in December, 2012. The firm manages about a quarter billion in assets for a handful of high net worth clients and advises two (soon to be three) mutual funds.
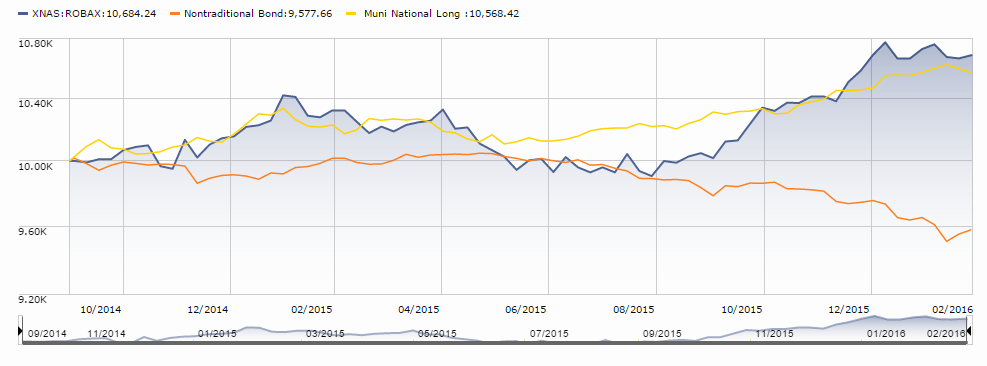
 Effective May 1, 2016, Donald A. Yacktman will transition to an advisory role and will no longer serve as a portfolio manager for AMG Yacktman (YACKX) and AMG Yacktman Focused (YAFFX) funds. The roughly corresponds with his 75th birthday. Mr. Yacktman has been managing mutual funds since 1968, starting with Stein, Roe and the Selected American Shares before founding Yacktman Asset Management in 1992. $10,000 invested in YACKX that year would have grown to $95,000 today, which compares well to the returns on an investment in the S&P500 ($76,000) or the average large-value fund ($56,000). He was named Morningstar’s Manager of the Year in 1991 and was joined on the management team by his son, Stephen, in 2002. Stephen Yacktman and Jason Subotky will manage the funds after the transition.