Monthly Archives: November 2019

November 1, 2019

By David Snowball

Dear friends,

It’s November 1, the traditional beginning of the holiday avoidance season. It’s the time of year when I program-out the local radio stations (not listening to you, Mix96) that switched to the 24/7 Christmas music today and the big box retailers who have declared that November 1 is Black Friday. (Looking at you, Kohls.) I will, with all my might, avoid their tinsel-festooned commercial caverns all of this month, and as much of next as I might.

That’s not because I dislike the year-end holidays. No, quite to the contrary: I’ve always embraced the communal spirit of celebration, the defiance of the cold winter nights and the opportunity to take a moment to remember to be grateful for one another. This dogged insistence on flogging holiday sales months in advance of the events does nothing but drain away any sense of the specialness, sacred or civil, that those few mid-winter nights once offered.

Thoughts after my AAII Conference sojourn

Thanks to the folks at AAII for inviting me to speak at their annual conference, this year in Orlando. Going from 40 and breezy in Iowa to 90, humid, with thunderstorms and scamper-y, mouse-sized lizards in Florida was a bit much for my system.

They are, Chip tells me, “anoles.” I mostly nodded and prayed they’d stay out from underfoot.

For those interested, the title of my talk was “The Indolent Investor: Managing Long-Term Decisions in a Sea of Short-Term Noise.” I tried to broaden my listeners’ understanding of the media universe that surrounds them, its effects on their own (investing and other) behavior and the strategies for managing it. The quick summary of the problem looked like this:

I suggested three sets of strategies: insulating ourselves from the noise, inoculating ourselves against the worst sorts of stories, and aligning our portfolios with long-term needs rather than short-term reactions. I’ll happily share the specifics with anyone interested.

The talk gave me the opportunity to share one of my favorite graphics, from a powerful and readily-accessible presentation by Rob Arnott. His point is that valuation matters in the long-run. A lot. Really, it matters more than anything. Here’s the graphic:

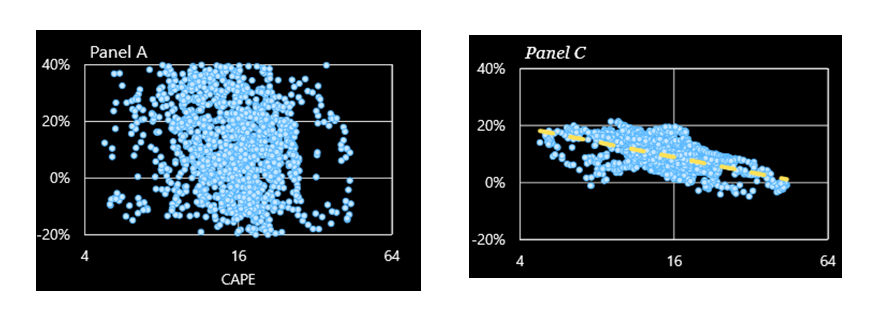
What you’re looking at is the relationship between what you pay for stocks (the CAPE p/e, along the bottom) and how much you make from stocks. Panel A shows the relationship after one year. More properly, the lack of relationship after one year. It’s clear that you sometimes buy a cheap market and, a year later, have lost a mint; those are the dots in the lower left of Panel A. Sometimes you buy into an egregiously overvalued market and, a year later, have made a mint; that’s the 40% gain dot in the upper right. In the short term, price doesn’t matter.

But in the long term? That’s Panel C, which shows your returns after 10 years. In that time frame, there’s a clear, evident and consistent pattern. The dashed yellow line represents the average return at each price point. If you pay 52 p/e (Amazon’s current rate, fyi) for a basket of stocks, after 10 years you’ll have made zero on average and below zero (for 10 years!) frequently. Our current Shiller CAPE p/e is 30, which is not a pretty portent.

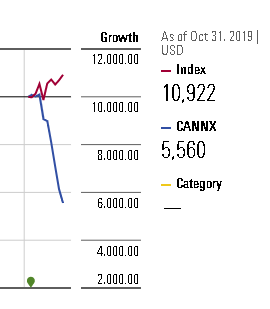
Rupal Bhansali impressed me. We had a thoughtful, though brief, conversation about the evolution of her funds and her take on the market. Roughly, she’s attracted billions in institutional money but a tiny fraction of that from retail investors. And, given her insistence on investing only in sound businesses and discounted prices, she estimates that her investable universe has shrunk to about 5% of the market. That’s caused her to trim the number of positions in her portfolios, though she remains almost fully invested.

James O’Shaughnessy impressed me. His keynote address was funny and wide-ranging, and started from the premise “we are all descended from cowards.” His point is that, in an evolutionary sense, “the fight or flight reaction” worked best as “the flight reaction” because bold and fearless aboriginals generally got eaten before achieving parenthood. Instinctive risk aversion, he argued, cannot be educated away. His solution was reliance on quantitative models which knew no fear, and that’s the direction his firm has gone. My own reaction is that quant models are one possibility, but only one and quite often as flawed as the humans they supplant. (Quant funds, as it turns out, work pretty poorly in falling markets, as do the rest of us.)

Mebane Faber did not impress me, at least not positively. Manager of the Cambria ETFs, he came across as arrogant, disrespectful, full of unconditional declarations and easy generalization, and largely lacking in self-reflection. I left about halfway through, and was not the first to depart.

The FINRA representatives asked if I would mention to you the existence of their Fund Analyzer. They seem rather proud of it for its ability to do side-by-side comparisons of fund and ETF expenses. FINRA is the industry’s Congressionally-authorized self-regulatory scheme. Folks on the MFO discussion argue that FINRA, like most self-regulators, is forced into a series of compromises that belie the celebratory rhetoric.

Since I’m mentioning tools, the folks at As You Sow offer a simple tool for identifying funds with high scores on four hot button issues: carbon-free funds, gun-free funds, deforestation-free funds (who knew?) and gender equality funds. Since sorting through the increasingly mountain of ESG-come-lately funds is getting tougher and tougher, they seem to be offering a useful service.

Morningstar’s challenges

If you’ve had difficulty using Morningstar’s fund tools, or even accessing them, you’re not alone. One of the longest recent threads on MFO’s discussion board is entitled “Morningstar is falling apart.” The complaints raised there echo my own experience and I’ve spent a lot of time in recent weeks trying to work things through with Retail Support (aka “Joe”). For example, I tried to chart the total return of the Voya Corporate Leaders Trust (LEXCX) against the DJIA from the fund’s 1935 inception.  Nine or ten emails later, that turns out to be impossible. The evident option in their chart only tracks the Dow for nine years. With the intervention of the media relations folks and the Morningstar Direct folks, I got closer to an answer which is the indexes have sort of secret internal codes. If you know the codes, you can get close to the answer but it’s not necessarily possible to find the code.

A pending discussion asks how it’s possible for a fund to simultaneously be in the top 32% of its peer group for a particular year and trail the peer average. The response simply explained to me what 32% meant.

Our most dramatic discussion surrounds this image:

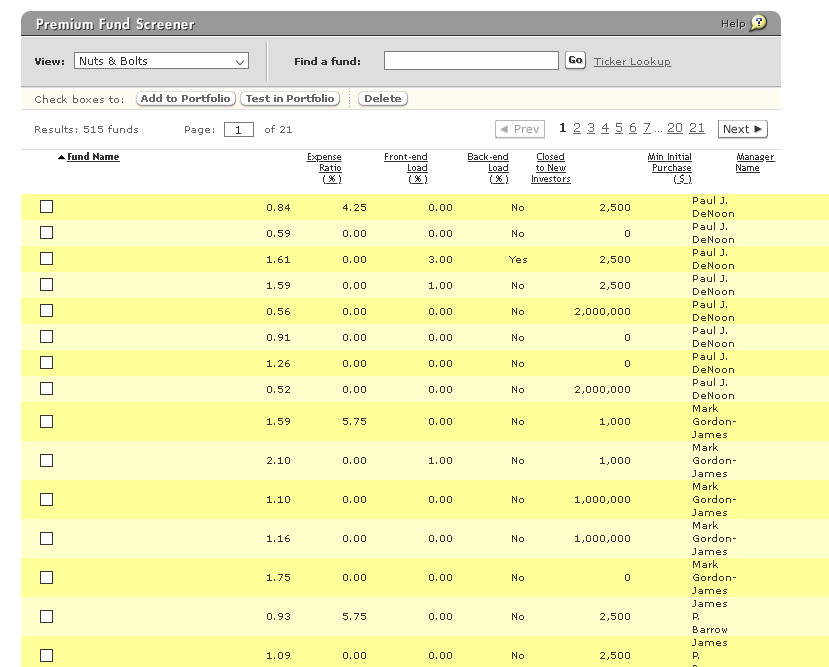
The Premium Fund search was willing to give me what I asked for, as long as what I asked for didn’t include the names of any funds. The folks in Morningstar media relations confirmed the difficulty and got back quickly with the message that the screener might be functioning again in the middle of next week. (sigh)

Even folks with access to Morningstar Direct, the high-end professional product, are complaining that they’ve lost access to data they could once easily retrieve.

I mention all of that for two reasons. First, if you’re having trouble and doubting your sanity, set your mind at rest. Second, if you’re having trouble, reach out to Morningstar. They’re running a tremendously complicated operation, and they’re doing it in the context of a parent corporation whose priorities are … uh, evolving. They are trying to do a good job for as many people as their knowledge and resources permit, while surely under pressure to support the corporation’s earnings. Letting them know, clearly and politely, what’s not working is our best option for encouraging changes that keep the system alive.

The $2500 solution

We all know we need “an emergency fund,” that ill-defined pot of money designed to help us surmount … well, an emergency. The problem is that no one seems ever to have figured out what “an emergency” looks like or how much it plausibly costs. That gave rise to rules of thumb that seemed designed to discourage anyone from even trying to establish such a fund, since they’d never reach the “six months’ worth of expenses” threshold.

Why six months? Because it’s the rule.

Turns out there’s a far more reassuring answer than that, one grounded in empirical analysis. Economists from the University of Colorado and Diego Portales University in Chile looked at 70,274 low-income households across the country and concluded that lower-income households would be quite fine with an emergency account of $2,467. They found that emergencies costing $500 dollars are surprisingly common, but those costing $5000 are surprisingly rare. As they chart out the frequency of emergencies by the dollar-size of them, you get a graph that goes flat at about $2500. That means that $6000 is not much more helpful, in practical terms, than $2500 is.

A decent non-technical walk-through of their research is here, while the original, downloadable research paper is here. NPR, being NPR, did a nice job of placing the research in its larger context.

My own emergency fund consists of a modest insured savings account (paying almost nothing) and a rather larger investment in RiverPark Short Term High Yield (RPHYX), an exceptional fund only open to those purchasing through the adviser. For folks like me who can tolerate some variation in share price, Zeo Short Duration Income (ZEOIX) and PIMCO Enhanced Short Maturity Active ETF (MINT) offer something like 3% returns with minimal downside.

Thanks, as ever …

Thanks to Kevin, Philip of Bloomfield Hills, and our cadre of loyal Paypal subscribers Greg, Doug, David, Sheshadri, Brian, William, Matthew, and the other William. Special thanks to our newest Paypal subscriber, James!

In answer to your questions: we do have a summary of how all of the funds we’ve profiled have done. It’s our monthly Dashboard, a free resource hosted at the MFO Premium site. And I’m still working on how to include brokerage availability in each of our fund profiles. Formerly that was something that Morningstar collated, but they’ve dropped that service from their website. I’m looking for a reliable alternative.

Finally, I’d urge everyone to read Charles’s piece this month, on changes at MFO Premium. The power of the tools on that site has grown exponentially over the past five years and the cost of the data feed that drives it has risen over 20%. As a result, we’ve increased the threshold for gaining access to the MFO Premium site from $100 to $120. We believe that the tools offer great potential and are, relative to any comparable service, a great value.

If you would like to contribute and gain access to MFO Premium, please use the MFO Premium link. Likewise, if you’d like to send a check and gain access to MFO Premium, please note that on the memo line and share your email address with us.

The Mutual Fund Observer itself is, and always will be, a free, non-commercial, reader-supported public service. Your contributions, large and small, make it all possible.  Folks who aren’t seeking MFO Premium access should continue to use our regular PayPal link, the one over there on the right.

Illness and a freak late October snowstorm threw plans a bit off-schedule this month, which means that our North Star Dividend and Yacktman Focus profiles will debut in our December issue, as will an update to our Akre Focus profile. Please join us for that, and much more, in the December – post-Thanksgiving, post Macy’s Parade, okay we can at least start talking about the holidays – Observer!

david's signature

Liquidity, Always Liquidity

By Edward A. Studzinski

“The only way a man can remain consistent amid changing circumstances is to change with them while preserving the same dominating purpose.” Winston S. Churchill, “Consistency in Politics,” Nash’s Pall Mall, July 1927, reprinted in Churchill’s Thoughts and Adventures (1932)

Where’s the Risk?

Horizon Kinetics, in its Q3 Commentary, again did a superb job of raising issues that investors should be thinking about, given a wide range of potential outcomes for Gross Domestic Product, as well as inflation and deflation. Now I am fully aware that both David Snowball and I have been banging the drum about the dangers of extreme overvaluation in the marketplace, and the possibilities of a major market decline. For those “Game of Thrones” fans I will say it differently, “Winter is coming.”

We are at a point where there are things taking place that we have not seen before, all happening concurrently. On the one hand, we have rapidly growing companies, the Amazons and Mastercards, trading at price to earnings ratios often in excess of 30. (Forward p/e’s of 54 and 31, respectively, as of 11/01/2019.) Or rather, they are trading at 30 years’ worth of earnings. They represent (and I am showing my age here), the new Nifty Fifty like the growth stocks of old, the Polaroids, Data Generals, and Digital Equipments.

At the same time, we have very mature companies that are often showing minimal or negative growth, that are trading in a range around 24X earnings. In this category you can find a 3M (19X earnings) or a Kellogg (29X earnings). For these companies to survive, you are dependent on a continued environment of low (or suppressed) interest rates.

Don’t like being in the stock market, especially if you are near retirement or in retirement? What’s your alternative? An eighteen-month certificate of deposit at 1.75% or a ten-year U.S. Treasury at roughly the same return, 1.7%? Try living on that, Dividend yield on the S&P 500 is closer to 2%. There has been a migration to stocks by people who really don’t want to be invested in them, but who have not a lot of alternative choices.

Finally, we have the issue of non-diversification. You think if you own a couple of ETF’s or index products that you have become broadly diversified? I recently had to point out to a young widow that she, although owning three or four of the most popular equity index mutual fund products out there, was in reality under-diversified and over-concentrated. Because if you look carefully, you will find in the portfolios that the same stocks, depending on the product category of the fund, are presented as a Value stock, a Growth stock, a High Yield stock, or some other category, all at once.

Why is this happening? It is now a question of money flows into funds and products, and trading liquidity. One of my former colleagues, after some of the early trading and liquidity debacles in 2001-2002, pre-ETF availability, started limiting the position sizes of equity positions in his fund to a number of days trading volume to enter or exit a position. Concomitant with that, he no longer was interested in mid-cap stocks, where he had achieved a successful performance record. Rather, he style-drifted upwards to large cap and mega-cap issues. This worked for a while. Now, because of the amounts of money that have gone into these newer ETF vehicles and indexation, his ability to earn a positive alpha in his fund due to his own skill set has been arbitraged away because everyone owns the same stuff. Differentiation is not easy (which explains more money spent on marketing than research).

A similar explanation seems to fit as to why hedge funds have also lost their ability to thrive and outperform, where individual manager stock-picking by hedge fund managers has lost both its cache and its edge. In that vein, I commend an article in the Wall Street Journal this week concerning Highfields Capital in Boston, as well as an explanation as to how the endowment at Harvard University shot itself in the foot. (“Twilight of the Stock Pickers: Hedge Fund Kings Face a Reckoning,” 10/27/2019)

Amundi’s chief investment officer has warned the asset management sector could be on the verge of a wider liquidity crisis, amid heightened scrutiny by investors in the wake of Neil Woodford’s downfall.

“This business is a trade-off between risk, return and liquidity. We have the ingredients of looming liquidity mismatches across the industry,” said Pascal Blanqué.

The CIO’s comments reflect growing concerns that some open-ended funds could suffer the same fate as Woodford by struggling to sell some of their holdings fast enough to pay back investors. MarketWatch, 10/23/2019

Which brings me to what should be the most concerning fact of all. And, it raises again the liquidity issue. In June of 2019, Morningstar issued a report that indicated that there were now more assets in indexed vehicles (passive management) than were placed with active managers. This of course is driven primarily by asset allocation strategies, often set by consultants. Should individuals or institutions one day wake up and decide to reallocate their assets to different strategies or allocations, especially to cash, the markets lack the ability to buy those equities and provide liquidity. The allocations are effectively hung assets. The active managers lack cash, which they would have to raise, in effect driving clearing prices in the markets lower. The resulting permanent capital losses would end up causing other serious effects.

What’s to be done? I again would argue that investors need to review their allocations and comfort zones with those allocations, especially as to their ability to replenish their assets in the event of a permanent capital loss. Things that were five or ten years ago are often no longer what they seem. Just ask anyone who owns coastal property which is now in an area reclassified as a flood plain due to rising sea levels.

First, don’t be afraid to hold more cash than you usually would. Secondly, if you are going to be invested in equities, try and make sure that they and your other assets are as uncorrelated to the general markets as possible. Look for things that are unloved. Avoid asset classes that are laden with debt, especially where the cash flows may not be sustainable to pay the debts in the event that rates rise. And try to protect yourself from asset managers who are talking their own book.

Many years ago, I would run to get the Barron’s Roundtable write-ups, to see what good new ideas were out there. Imagine my surprise when I learned some time after the fact, having discovered 13-F filings, that often the issues being recommended were being sold out of the recommending firm’s portfolios. There was a need to stimulate interest (and liquidity) in some of the issues.

Reformulation Redux

I have previously touched on reformulation as it pertains to consumer brands, and to a certain extent pertains as well to money management firms. There, as in many businesses tied to individuals, the intellectual capital assets go down the elevator at the end of the day. And they may or may not come back, depending on any number of other factors.

We have seen an impact at Artisan International Value Fund and Artisan Global Value where, in October 2018, one organization basically split into two, with different personnel and locations (San Francisco and greater Chicago). You of course don’t need to have a tag day for the lead portfolio managers of each fund, as each one received more than $100M in stock when Artisan Partners went public. But how have the fund investors fared since then?

Similar questions need to be raised at other firms where the culture and personnel begin to shift for a variety of reasons.  If the research and portfolio brand management equity of a firm has been built upon the synergies of having everyone sited in one place (like a Dodge and Cox), changes need to be commented upon when they become noticeable.  Such synergies may be as de minimis as the intellectual exchanges that take place daily in the lunchroom, especially when you have marketed them as such.  Alternatively, if your lead portfolio managers of funds begin telecommuting from distant locations or states, it should raise questions as to whether there is a pre-retirement transition going on at that firm.  And existing and future clients would want to be made aware of those transitions.  Obviously, modern technology such as “Go to Meeting” software makes on-line commuting much easier.  But where your brand equity has been built upon the synergies of having your intellectual capital in one place?  For example, Wellington Management has announced that the portfolio manager of Vanguard’s Wellington Balanced Fund will be retiring in 2020, and that the succession planning is under way.   What is happening is in effect a reformulation of the brand which should be and has been disclosed to the clients.  The clients have a right to not be surprised with something different than what they thought they signed up for.  Another example of fair disclosure would be that of Bob Rodriguez, the retired First Pacific Advisors managing partner and portfolio manager, who when I saw him in 2009 in Chicago, a few years before he retired,  told me quite clearly that if I wanted to come visit with him, it would be to his office in Las Vegas, California where he lived and had an office, not Los Angeles where the firm’s offices were located.  Clearly with Bob, this was not an example of retiring in place, in absentia.

P.S. I do commend to those of you with the time and interest, the entire transcript or replay of the Q3 Commentary. They go into a discussion at length of dealing with the different scenarios of inflation or deflation that we may face. And they approach things with a degree of honesty and integrity that I find refreshing in a world full of asset gatherers with no interest in the yachts of the investors.

Living a Rewarding Retirement

By Robert Cochran

Some Thoughts on Social Security, Medicare, and the Markets

I’ve been officially retired for just more than two years. During that time, I have been asked numerous times about when to take Social Security retirement benefits. My general response is that it pays to delay receipt of benefits to age 70. After that, there is no incentive to delay other than potential income taxes.

A recent study, “The Retirement Solution Hiding in Plain Sight” by United Income (June, 2019), indicates most people would say “yes” to making one simple retirement planning decision that could mean more income during retirement. But the same study shows that 96% of retirees take their first Social Security check at something other than the best time to do it. The potential lost income is estimated to average $111,000 per household. Now there are many good reasons for starting benefits at an earlier time. They include health issues that force starting Social Security benefits as early as age 62, or even careful planning that indicates total income is sufficient to fund retirement prior to age 70.

For someone whose full retirement age (66) benefit is $1,320, their age 62 benefit would be $1,000, and their age 70 benefit would be $1,640. That’s 64 percent per month more for someone who waits. There is a trade-off for those who do not work into their later 60s and delay benefits until age 70, as they will need to draw from their portfolios to meet their income needs. The other side of the coin is that people who work past their early and mid-60s will perhaps need less, if anything, from their portfolios.

Poverty among the elderly could be cut in half, without a single program change, by making one good decision.

Maybe the most interesting finding from the study was this: Elderly poverty could be cut by nearly 50 percent if all retirees claimed Social Security at the financially optimal time. And the drop in poverty would potentially fall even further if they earned additional income while they waited to claim Social Security.  In full disclosure, I retired and started receiving Social Security benefits at age 67. Mine was a lifestyle decision, a choice other retirees may not have. I was able to retire before age 70 and not rely only on Social Security.


A close family member was recently diagnosed with lung cancer. While we do not yet know the extent or stage of the disease, we are nevertheless grateful that personal legal and medical documents were completed and signed a year ago. Health issues can appear seemingly from nowhere. Not only is it vital to have personal documents in order, but also to have the best Medicare Supplemental Insurance and Medicare Prescription Insurance. We recently received our annual report from our health insurance advisor, telling us that our existing Supplement Insurance is still the best option for us, but that we will save some dollars on our monthly premiums and prescriptions by making changes to Part D. For us, it is worth the advisor’s annual fee to have a knowledgeable person handle this for us. It gives us peace of mind, knowing we will have very good care as it is needed.


I was recently at a gathering of friends from my high school graduating class. As several of us discussed, it is amazing how quickly ten years’ time passes. We don’t know when we might see each other again, or even IF we will see each other again. We agreed that keeping physically active and doing some kind of rewarding volunteer work are important in living a rewarding a retirement.


MFO readers know that I don’t spend much time looking at my portfolio values. Some months I don’t even open the Schwab statements. This may shock people that someone who devoted more than 30 years to providing financial advice could step away from all of it so easily. There are four key truths in this decision.

  1. The world is always teetering on the brink. There have been reasons for concern and even frightening moments for as long as I can remember, but almost all of them were false alarms or had no lasting consequence. Some more mature readers may remember Louis Rukeyser’s response to a question about what the market was going to do. He said “The market will fluctuate. It will fluc up and fluc down.” How very true.
  2. I can’t change that. I fully admit that I have absolutely no control over what happens to the stock and bond markets. Worrying about things which I cannot control is wasted time.
  3. The financial press thrives by manufacturing crises. It is a fact that much of the broadcast financial media deliberately creates or hypes scary headlines in order to sell advertising. Do you ever see or hear them hype good news? Their strategy works.
  4. A sound long-term plan is the key to sleep. The best thing I have done is to create an allocation mix that allows me to sleep at night. I recently captured some profits at the urging of my former colleagues, now my advisors. We have a lot more sitting in cash than we ever had in the past, which helps offset some of the truly aggressive holdings we still hold.

Consider the current market’s record high just yesterday (29 October). If ever there was a time for extreme market volatility, it is now. But in fact, the market has remained rather resilient this year. Broadcast and print media are providing almost non-stop negative political news. Yet the economy remains robust, employment numbers remain strong, interest and mortgage rates remain historically low, and inflation is still lower than the Federal Reserve’s target level.

My advice to other retirees is to stay healthy, stay busy, and make it a point to spend some time doing things that bring joy and fulfillment to those whose lives are a struggle. Let’s be grateful for what we do have.


Limiting Choices

By Charles Lynn Bolin

Oddly enough, the most time-consuming part of investing for me is limiting my choices. To simplify and streamline the process, I looked at fund families with top performing mutual funds that are available as no-load funds with low minimum investments through Charles Schwab, Fidelity or Vanguard.

Investment Model

Hedge fund billionaire Ray Dalio, in our call of the day, says the global economy is in a “great sag” and the world has parallels to the 1930s… Speaking at a panel at the IMF and World Bank meeting in Washington, the founder of the world’s largest hedge fund, Bridgewater Associates, said he didn’t see a market or economic crash on the horizon but a “great sag.”

Why the Bull Market Won’t End with a Typical Crash, Says Hedge Fund Billionaire Ray Dalio”(Marketwatch, 10/26/2019)

I built the Investment Model, shown in Chart #1, over the past 7 years to estimate an allocation to stocks and bonds that maximizes the return on $100 invested in January 1995 by adjusting to the business cycle. It takes into account dividends, total bond returns, monetary policy, financial risk, valuations, market trends and volatility, orders, production, sales, banking, corporate health, and money market flows, among many others. It now sits at the minimum allocation of 20% to stocks. Charles Boccadoro wrote a fascinating article in June 2017 called “How Bad Can It Get?”. He shows the maximum drawdown of various stock to bond allocations since 1932. Charles also shows the Martin Ratio (risk adjusted return) is highest for a 30/70 stock to bond portfolio.

The shaded area in Chart #1 provides guidance to whether I should be more aggressive or defensive, and for only the third time in 25 years, it is saying to be defensive, which does not imply being bearish. The indicator went negative in October 2000 and December 2008. During the next six months, the S&P 500 fell 14 and 9 percent respectively before entering a bear market. The next six months are important to watch for signs of a global recession. The negative factors impacting the Investment Model now are monetary policy (rising interests over the past two years and unwinding of the balance sheet), yield curve, global growth slowdown, increasing flows to money markets (risk aversion), construction, valuations, low potential GDP growth (labor, capacity, potential GDP), corporate (sales, income, profits), shipping, orders, manufacturing, and leading indicators, along with a few that just recently went negative. Twenty percent of the data is quarterly, so there may be revisions as more data becomes available in November.

CHART #1: INVESTMENT MODEL

Source: Created by the Author

I use the MFO Premium screener to evaluate and implement the Investment Model by developing a ranking system based on Momentum (3 and 10 month trends and moving averages), Quality (bond rating, low leverage, Fund Family Rating, Ferguson Metrics, composite ratings), Valuation (price to earnings ratio, price to cash flow, price to book), Risk (Ulcer Index, MFO Risk, capture metrics, debt to equity, performance during recessions), Risk Adjusted Returns (Martin Ratio, MFO Rank, Great Owl and Honor Roll Classification), and Income (Yield).

The timeframe for all of the following data is 18 months.

We consciously selected an 18 month window because that corresponds with a period of rising volatility and intermittent market falls. The Investment Committee at Tweedy, Browne Company shares our judgment about the market shift we’re trying to capture:

Since early 2018, there have been periodic bouts of market volatility, which has translated into weakening correlations and improved idea flow for value investors like us. Past experience would suggest that prevailing investor anxiety is, in part, related to above-average risk asset valuations coupled with increasing macroeconomic uncertainty … we suspect that market volatility is likely to remain with us, and that should bode well for bargain hunting. (Investment Committee, Tweedy, Browne Company LLC, Third Quarter Commentary, October 2019)

From the perspective of a risk-aware investor, this shorter time-frame is more diagnostic than performance during years of unrelenting rises.

Limiting the Fund Families

Table 1 contains the final funds by family selected to be ranked. The rejected funds are mutual funds not available through Charles Schwab or Fidelity or that have high minimum investment requirements. The closed end funds were rejected based on high premiums or expenses using CEF Analyzer. “Barron’s Fund Family Ranking” is worth reading for those interested in more information about their views. I chose AMG because I like the Yacktman Focused Fund (YAFFX), Janus for the Janus Henderson Balanced (JABAX) fund, and Cohen & Steers for real estate funds.

TABLE #1: SUMMARY OF OCTOBER FUNDS EVALUATED

Fund Family Mutual Fund ETF CEF Total # Funds with an MFO Rating >=4 Great Owls
Blackrock 42 110 29 181 113 20
Fidelity 114 13 0 127 83 16
Invesco 42 66 8 116 73 20
Vanguard 58 22 0 80 60 12
MFS 34 0 7 41 27 8
PIMCO 34 12 0 46 23 4
T Rowe Price 62 0 0 62 21 8
Janus 17 1 0 18 15 3
Charles Schwab 21 9 0 30 15 4
State Street 0 19 0 19 14 4
Virtus 19 0 1 20 13 2
Nuveen 11 4 17 32 12 0
Cohen & Steers 10 0 7 17 12 1
AMG 14 0 0 14 12 3
American Funds 34 0 0 34 11 6
Other 5 56 11 72 59 10
Rejected 50 0 32 82 51 31
Total 567 312 112 991 614 152

Source: Created by the author based on Mutual Fund Observer

Table #2 contains the four fund families with the most funds with a MFO Rating of 4 or higher per Lipper sub-type, along with the number of funds in those four families. The funds in Table #2 were only included if they were managed or enhanced, 5 years old or older, and non-institutional. Only AMG, MFS, and Invesco had top ranked alternative funds.

TABLE #2: FUND FAMILIES WITH THE MOST TOP RANKED FUNDS

U.S. Equity Mixed Asset Bond Internat’l Equity Global Equity Sector Equity Municipal Bond
Fidelity Fidelity Fidelity Fidelity MFS Fidelity Invesco
MFS MFS Vanguard T Rowe Price Virtus Cohen & Steers Vanguard
T Rowe Price T Rowe Price T Rowe Price MFS Janus Invesco Nuveen
AMG Blackrock Invesco Virtus Misc Virtus Fidelity
44 58 37 45 13 34 16

Source: Created by the author based on LGDF data and MFO Premium screening

Ranking System

I built the ranking system for someone who invests according to the business cycle, is less tolerant of risk, or is interested in low to moderate risk with high risk adjusted returns. The Bear column refers to the average performance during the 2000 and 2007 bear markets. Each month, I compare the top ranked Lipper Categories to what I own to see if there is some small change that I should make. I personally think that many utility and real estate funds are over-bought as investors seek safety. In addition, many low volatility and conservative funds own large percentages of these categories. The key take away from this data is that investors have been flocking to safety, driving up the prices and returns. I believe that interest rates will fall further due to easing of monetary policy globally.

TABLE 3: TOP RANKED OBJECTIVES

Objective Ulcer Martin Yield RTN 3Month RTN 1Year Bear
Ultra-Short Obligations 0.0 10.9 2.7 0.7 2.9 3.4
Short Invest Grade Debt 0.0 + 2.6 0.8 4.6 3.9
Short U.S. Government Bond 0.1 24.5 2.3 0.5 4.0 5.0
Short-Intmdt Invest Grade Debt 0.1 31.3 2.6 1.0 6.4 4.7
Short U.S. Treasury 0.1 17.2 2.2 0.6 3.9 7.2
Short-Intmdt Muni Debt 0.2 21.1 2.0 0.7 5.0 +
GNMA 0.3 9.0 2.7 1.2 7.2 8.6
Intermediate Muni Debt 0.3 14.4 2.3 1.4 8.2 5.7
International Income 0.4 48.6 2.8 3.0 11.6 +
Gen & Ins Muni Debt 0.4 16.3 2.8 1.8 9.1 2.5
Core Bond 0.4 11.9 2.9 2.1 10.1 4.5
Global Income 0.4 7.7 3.1 1.9 8.0 4.8
High Yield Municipal Debt 0.5 15.1 4.1 2.3 9.5 (6.6)
Corp Debt BBB-Rated 0.6 12.0 3.4 2.3 11.4 +
General U.S. Government 0.7 10.9 2.2 3.2 12.5 9.1
General Bond 0.9 9.9 5.0 3.3 13.4 (0.3)
Utility 1.1 16.9 2.7 7.8 22.7 (31.3)
General U.S. Treasury 1.1 10.7 2.2 4.9 17.5 12.3
Income 1.5 2.5 2.8 1.5 6.6 (9.8)
EM Hard Currency Debt 1.7 2.9 4.6 1.3 10.9 (0.0)
Global Infrastructure 2.0 5.9 2.1 2.5 16.8 (35.8)
Real Estate 2.5 7.8 3.4 7.3 18.9 (21.8)

Source: Created by the author based on LGDF data and MFO Premium screening

I have a preference for Fidelity and Vanguard mutual funds, but want to see how funds from other fund families are performing. Table #4 contains the top ranked fund for each top ranked Lipper Category.

TABLE #4: TOP RANKED FUNDS BY OBJECTIVE

Objective Vanguard Fidelity CEF ETF Other
 International Income VTABX FCDSX   IAGG TNIBX
 GNMA VFIIX FGMNX   GNMA  
 Utility   FSUTX UTF VPU MMUFX
 Ultra-Short Obligations VUSFX FCNVX   MINT TRBUX
 Short U.S. Government VSGBX     FTSD OPGVX
 General & Insured Municipal Debt VWAHX FTABX   FMB OPAMX
 General U.S. Government   FGOVX   AGZ AMUSX
 Short-Intmdt Investment Grade Debt   FTHRX   VCSH BRASX
 Intermediate Municipal Debt VWITX FLTMX   ITM SWNTX
 General U.S. Treasury VFITX FUAMX   SCHR PRULX
 Short Investment Grade Debt VFSTX FYBTX   SPSB PRWBX
 High Yield Municipal Debt     NMZ HYMB ORNAX
 Core Bond VFICX FTBFX   FBND DODIX
 Short U.S. Treasury VFISX FUMBX   SCHO  
 Global Income   FGBFX   HOLD PRSNX
 Corporate Debt BBB-Rated   FCBFX BHK VCIT BRACX
 Emerging Markets Hard Currency Debt       VWOB TRECX
 Income VWINX FFFAX   AOK DIFAX
 General Bond   FPCIX BBN BAB PTCIX
 Global Infrastructure       NFRA CSUIX
 Short-Intermediate Municipal Debt VMLTX FSTFX   SUB OPITX
 Real Estate VGSLX FRIFX RNP REZ CSEIX

Source: Created by the author based on LGDF data and MFO Premium screening

Table #5 contains one of the highest rated funds for top ranked Lipper Categories. Each month, I create a list of funds and compare them to what I own to see if there is some small change that I want to make. Depending upon one’s investment needs, the funds in Tables 4 and 5 are an excellent starting point for building a low risk, high risk adjusted return portfolio.

TABLE #5: TOP RANKED FUNDS

Recession Resistant Funds – 18 Months
Symbol Name CAGR MFO Risk Ulcer MFO Rating Martin GO? Yield
TRBUX T Rowe Price Ultra ST Bond 3.1 1.0 0.0 5 Yes 2.8
VCSH Vanguard ST Corp Bond ETF 5.1 1.0 0.0 5 62.5 Yes 2.8
VTABX Vanguard Total International Bond 8.6 1.0 0.1 5 85.1 Yes 2.8
VFIIX Vanguard GNMA 5.4 1.0 0.3 5 9.6 No 2.9
VGIT Vanguard Intermediate-Term Treasury ETF 7.2 2.0 0.3 5 14.9 No 2.2
DODIX Dodge & Cox Income 6.2 1.0 0.3 5 12.7 Yes 3.1
VWAHX Vanguard High Yield Tax-Exempt 8.1 1.0 0.4 4 14.1 No 3.4
PRSNX T Rowe Price Global MltiSect Bond 6.9 1.0 0.7 3 7.0 No 3.5
JMUIX Janus Henderson Multi-Sect Income 6.5 1.0 0.3 5 12.8 Yes 4.6
TRECX T Rowe Price EM Market Corp Bond 6.2 2.0 1.2 5 3.5 Yes 4.7
FRIFX Fidelity Real Estate Income 12.1 2.0 1.0 5 10.0 Yes 4.3
VWINX Vanguard Wellesley Income 8.2 2.0 1.0 5 6.3 Yes 2.9
JGDIX Janus Henderson Global Inc Mngd Vol 7.8 2.0 1.3 5 4.4 Yes 3.2
TAIAX American Funds Tx-Adv Grwth&Inc Port 5.5 2.0 1.5 5 2.3 Yes 2.5
SPLV Invesco S&P 500 Low Volatility ETF 16.5 3.0 1.8 5 7.8 Yes 2.0
JERIX Janus Henderson Global Real Estate 15.0 3.0 2.5 4 5.2 No 2.9
LVHD Legg Mason Low Vol High Dividend ETF 9.6 3.0 2.1 5 3.5 Yes 3.7
XMLV Invesco S&P MidCap Low Volatility ETF 14.0 4.0 2.5 5 4.8 Yes 1.9
VMNVX Vanguard Global Min Vol 10.8 3.0 2.5 5 3.5 Yes 2.1
VIG Vanguard Dividend Appreciation ETF 12.0 4.0 3.6 5 2.8 Yes 1.7

Source: Created by the author based on LGDF data and MFO Premium screening

Here’s how to read that table. T. Rowe Price Ultra Short Term Bond (TRBUX), the first fund listed, has returned an annually 3.1% over the past 18 months. It falls in MFO’s lowest risk group (1) and has an Ulcer Index of zero. The Ulcer Index factors together the depth and duration of a fund’s drawdowns; funds that go down a long way and stay there a long while are the source of … well, ulcers. The lower the Ulcer Index, the better. In this case, TRBUX had no monthly drawdown at all, so the Ulcer Index is zero. The MFO Rating assesses a fund’s risk-adjusted returns based on the Martin Index; the Martin Index itself measures a fund’s performance during drawdowns, based on the logic that volatility on the upswing is annoying but volatility on the downside is disastrous. So a high MFO rating and high Martin Ratio are both good; in TRBUX’s case, the Martin is actually incalculably high so the space is blank. The Great Owl status tells you that the fund consistently ranks in the top tier of its peer group by risk-adjusted performance. On whole, you’d describe it as a flawless performance with about 3% annual returns.

Closing

What I gained from this is exercise is a list of fund families that can be purchased at the investment companies that I use and a list of funds which are not considered due to load fees, availability, or having high minimum investment requirements. It reduces the research required looking at individual funds. I continue to automate the process so that each month it requires less time. The Multisearch and new Portfolio tools at MFO Premium are powerful and easy to use. For most investors, the available tools are all that is required.

Disclaimer

I am not an economist nor an investment professional. I became interested in economic forecasting and modeling in 2007 when a mortgage loan officer told me that there was a huge financial crisis coming. There were signs of financial stress if you knew where to look. I have read dozens of books on business cycles since then. Discovering the rich database at the St. Louis Federal Reserve (FRED) provides most of the data to create an Investment Model. The tools at Mutual Fund Observer provide the means for implementing and validating the Investment Model.

Resources

Excellent books on investment models and business cycles are Nowcasting the Business Cycle by James Picerno, Conquering the Divide by Cornehlsen and Carr, Investing with the Trend by Gregory L. Morris, Ahead of the Curve by Joseph H. Ellis, Probable Outcomes by Ed Easterling, The Era of Uncertainty by Francois Trahan and Katerine Krantz, The Research Driven Investor by Timothy Hayes, and Beating the Market 3 Months at a Time by Gerald Appel and Marvin Appel.

Premium Site Updates: Fund Fee Rating, Category Averages, and Subscription Price

By Charles Boccadoro

Martini: No, it’s not stupid, Signora Mayes. L’amore e cieco.

Frances: Oh, love is blind. Yeah, we have that saying too.

Martini: Everybody has that saying because it’s true everywhere.

From the 2003 film “Under The Tuscan Sun”

ER Rating

Morningstar has long championed funds with low expense ratios. In Ben Johnson’s piece earlier this year, entitled Fund-Fee Study: The Key Factors Helping Drive Fund Fees Lower, he states: “… fees are one of the best indicators of future relative performance, as lower-cost funds generally have greater odds of surviving and outperforming their more-expensive peers.”

Price remains one of the five pillars in its qualitative fund rating system, along with parent, people, performance and process. That said, Morningstar seemed to turn a blind eye to funds charging indefensible front loads, but the industry has since all but buried that issue.

Yesterday, MFO Premium introduced its Expense Ratio (ER) Rating metric in MultiSearch – the site’s main fund screening tool. Funds are grouped or rated versus category peers by quintiles. Funds with lowest ERs receive a 1 (best), while funds with highest ERs receive a 5 (worst). Users can specify an absolute value of ER, say less than 1%, or an ER Rating.

The plot below reinforces why fees matter, something that should seem entirely self-evident. You’ll see that funds with the highest ER tend to deliver the worst returns over their lifetimes, and the opposite appears true. In fact, it’s 2-3 times more likely for a fund with the worst ER Rating to deliver the worst performance. Similarly, a fund with the best ER Rating is 2-3 times more likely to deliver the best performance.

The same holds true even if you extract index or so-called passive funds, as evidenced in the plot below. One other bit of evidence: through September there are 164 funds that share MFO Great Owl and Honor Roll distinctions. Of the 164, only 9 have the worst ER Rating, while 38 have the best.

Take-away:  If a fund in your portfolio has an MFO ER Rating of 5 (worst), you’d better have a good reason for holding it.


Category Averages

Another addition to MultiSearch is Averages. While the separate Averages tool shows category averages for several metrics, like Return and MFO Risk, it is limited in scope and offers few evaluation periods, like 1, 3, 5, 10, and 20 year plus full cycles.

When users select an Asset Universe of Averages, MultiSearch will now present the averages of all metrics as applicable for the 175 categories for any of the 42 evaluation periods selected. It’s pretty cool. Shortly, these new averages will be incorporated as an option in the Portfolios tool when funds are too young for an evaluation period of interest. (See Introducing MFO’s Portfolio Analysis Tool.)

The averages are based on oldest share class, typically; exceptions are ER, Yield, 12b-1 fee, and load, which include all share classes. Also, for convenience, AUM is the sum or total in category not the average. The symbol for these averages is “AV-” followed by the Lipper Category Code.

By selecting “Include Averages,” users can also add the category averages to display along with the other selected criteria, as illustrated below for the oldest Large Cap Core funds in our database.

Exporting MultiSearch results for all the Averages easily enables users to assess AUM across categories, subtypes and types, as illustrated below. Generally, equities/U.S. equities, bonds, and money market are where folks keep their money. (Note: There are about 1750 Fund of Funds in our database, which collectively hold about $2.5T, mostly affecting the Mixed Asset sums.)


Subscription Price

Beginning this month, we will be upping the price (donation level) of an annual subscription to MFO Premium from $100 to $120 for individuals and from $500 to $600 for companies. Company subscriptions give access for up to 10 individual accounts.

This increase covers corresponding price increases in our Lipper (now Refinitiv) datafeed. It also covers a (hard to believe) service sales tax being imposed on Lipper by Iowa, where our non-profit resides, as well as higher costs of our new user portal.

We believe the price remains a bargain, especially given the extent to which the site has evolved since its inception four years ago, thanks to continued feedback and recommendations from our subscribers. We’ve received considerable praise this past year. Here are a few from folks who’ve agreed to share:

“I look forward to more good things from the Premium Site, the best bargain in investing.” James C. Pursley, President and Chief Investment Officer, Gaia Capital Management, Inc.

“Damn, man, a major thumbs-up, with tons of admiration … it is an amazing site.” David R. Moran, active MFO Discussion Board member.

“Overall, one of the most powerful and comprehensive fund screeners I’ve come across.” Samuel Lee, founder SVRN Asset Management, LLC.

“Your site is fantastic and we seem to rely on it more-and-more these days to search and monitor client fund investments.” Michael P. Egan, CFP, Diversified Management, Inc.

With your continued support, we promise more good things to come.

Elevator Talk: Jonathan Brodsky and Waldemar Mozes Harbor International Small Cap (HIISX)

By David Snowball

Since the number of funds we can cover in-depth is smaller than the number of funds worthy of in-depth coverage, we’ve decided to offer one or two managers each month the opportunity to make a 300 word pitch to you. That’s about the number of words a slightly-manic elevator companion could share in a minute and a half. In each case, I’ve promised to offer a quick capsule of the fund and a link back to the fund’s site. Other than that, they’ve got a few hundred words and precisely as much of your time and attention as you’re willing to share. These aren’t endorsements; they’re opportunities to learn more.

On May 23, 2019, Harbor Capital Advisors did a hard reset on Harbor International Small Cap (HIISX). Over its first three years, the fund’s returns trailed nearly three-quarters of its peers and 
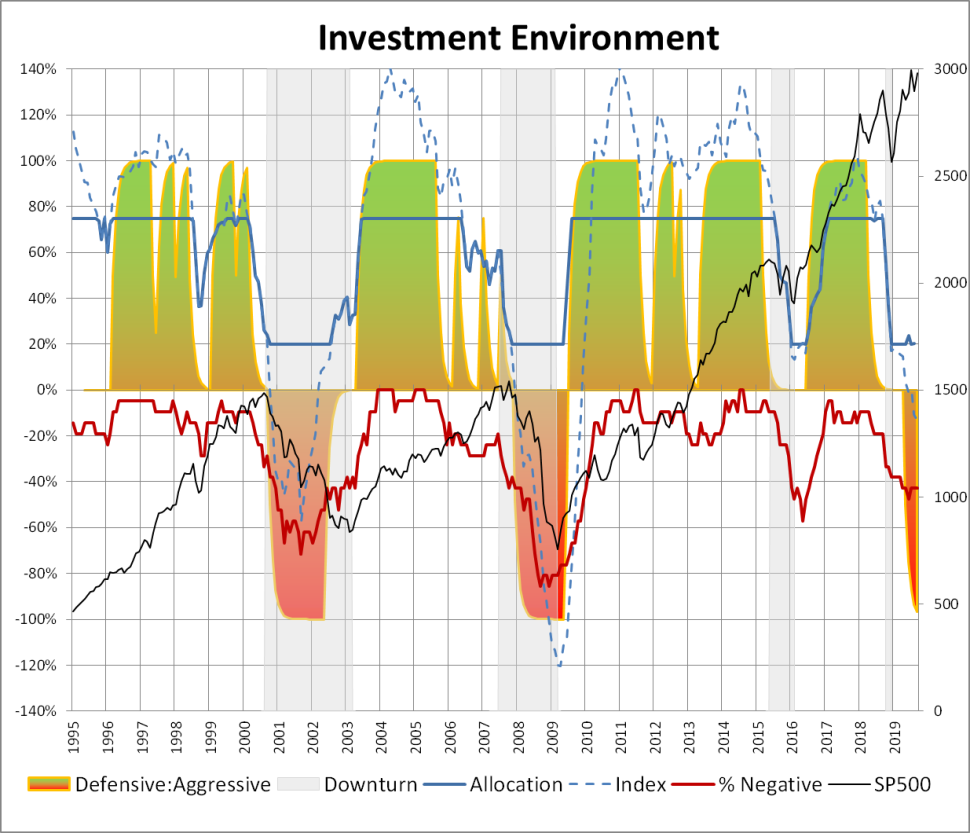
only a tiny bit less volatility. Harbor chose to empanel a new subadvisor, Cedar Street Asset Management. Cedar Street was founded in April of 2016, as an employee-owned investment management firm and has approximately $250 million in assets under management as of June 30, 2019.

The new management team is Jonathan Brodsky, Founder and Principal, and Waldemar Mozes, Director of Investments for Cedar Street. Mr. Brodsky co-managed Advisory Research International Small Cap Value (ADVLX) from 2010-2016, Calvert International Opportunities (CIOAX) from 2011-2016 and Acuitas International Small Cap (AISCX) from 2014-2016. Prior to joining Cedar Street, Mr. Mozes worked with TAMRO Capital Partners LLC as a manager, starting in 2008, after stints with Artisan Partners and The Capital Group, adviser to the American Funds. At TAMRO he developed the international small cap strategy and managed the ASTON/TAMRO International Small Cap Fund (AROWX/ATRWX) from its launch in 2014 to its untimely liquidation in January, 2016.

In the topsy turvy world of asset management, M&A Advisory Research was bought in 2010 by Piper Jaffray then sold again in 2019 while Aston was bought in 2016 by AMG, with all of its funds absorbed or liquidated.

Cedar Street Asset Management was specifically founded to provide a value-focused investment service free of such conflicting ownership structures. With the Harbor International Small Cap fund, the managers are seeking long-term growth of capital. The plan is to invest in a fairly compact portfolio of small cap stocks, primarily but not exclusively domiciled in developed international markets, using Cedar Street’s disciplined, valued-oriented approach.

Thinking about international small cap investing

As the name requires, the team will invest in international small caps. Over the past five years, that’s not been a happy place. The average international small- to mid-cap value fund has returned under 1% a year and the average core fund made just 1.3%. International smid-cap growth returned 3.6%, which looks great in comparison to the other two group but substantially trails even low-risk assets like muni bonds.

There are, nonetheless, reasons to take the asset class seriously.

1. International small caps are a major asset class.

In rough terms, four-five thousand stocks, 46 countries with, depending on how you count, somewhere between 100-200% of the total market capitalization of the two thousand US small caps. Collectively, their market cap is over $5 trillion, which is about 6% of the global stock market.

2. You’re underexposed to them.

The average US investor holds about 15% of their portfolio in international stocks but the average “core” international fund only has 1.5% of its money in small cap stocks. In rough terms, the average US investor might then have 0.225% in international small caps, about a 25:1 underweight.

The bias toward international large caps is ironic since small caps have greater price inefficiencies linked to low (and falling) analyst coverage, substantially higher 10-year returns than their large cap peers, higher risk-adjusted returns, lower correlation to the US market and better valuations. And their advantage over international large caps has been persistent over time and across markets.

As of May 2019, GMO projects international small caps to have higher returns than any asset class outside of the emerging markets over the next five to seven years.

The Cedar Street plan

Supported by a team of three analysts, the two PMs will build a portfolio of 50-70 international small cap stocks. The current market cap range for their universe is about $100 million – $8 billion. While they have the authority to invest in emerging markets, they anticipate that direct EM exposure will be “minimal.” Position sizes will be “conviction weighted” but any individual position is capped at 5%. They anticipate turnover in the range of 25-35% which implies a typical holding period of three to four years.

In building the portfolio, they give exceptional attention to downside protection. The team’s investment process review places the “downside review” before the “upside analysis,” which strikes me as singularly sensible. They have a strong preference for value-priced stocks of firms with solid underlying businesses and clean balance sheets. They also spend a lot of effort in a governance analysis. They argue that “Because of varied laws around corporate governance and knowledge of the local players in the markets and their views on minority investors, Cedar Street feels that a detailed review of corporate governance practices is key to success in this space.”

There are, by Lipper’s count, 116 international small- to mid-cap funds, about a dozen of which are quite good. We asked Messrs. Brodsky and Mozes to reflect a bit on what made them think the world needed a 117th strategy and why thought they might make it into The Distinguished Dozen. Here are their 300 words on the matter:

What sets our firm apart is our unique culture focused exclusively on capturing the inefficiencies that consistently present themselves in non-U.S. small caps. It all starts with our team. Every investment team member brings a unique set of work experiences and diverse perspectives to the firm. Each team member has also earned an equity ownership stake based on significant contributions to the firm. We also make investment decisions collaboratively based on this long-term, ownership mentality. As a result, every investment idea hews to our value-based principles and every potential idea is vetted with a consistent, rigorous process prior to gaining entry into our portfolios. This cultural cohesion allows us to maintain our focus even when our value-oriented style may be out of favor.

The other key attribute that differentiates us is the breadth of valuation inefficiencies that we are able to capture as a team thanks to our diverse work experiences, language skills, cultural backgrounds, and educational training. Our value philosophy still means that we buy stocks trading at inexpensive absolute and relative valuation multiples. But instead of capital-intensive, highly-levered cement companies trading at a discount to book value, we are experts at capturing value from a more dynamic universe of secular growth opportunities such as the electrification of automobiles, increasing use of renewable materials for consumer products packaging, digital advertising, and the growth of protein-rich diets of emerging consumers. We do all of our own investment research, which means we often find companies that are overlooked by brokers or unloved by local investors. When combined with our rigorous balance sheet and corporate governance review, our investment process produces a portfolio of companies that have above-average, through-the-cycle returns on equity or invested capital, with below average leverage and volatility.

The administrative details

The minimum initial investment for the retail shares (HIISX) is $2,500 and the expense ratio, after waivers, is1.32% on assets of $54 million. The fund offers three other share classes.

Name / ticker Expense ratio Minimum investment
Administrative HRISX 1.20 $50,000
Institutional HAISX 0.95 $50,000
Retirement HNISX 0.87 $1,000,000

The fund is available through Schwab, TDAmeritrade, Vanguard and a few other platforms. Its website, Harbor International Small Cap, doesn’t yet offer commentary from the Cedar Street team. The Cedar Street Asset Management site isn’t noticeably richer, except for a bunch on video clips (2016-19) on the In the News page. Those mostly offer commentary on external events (“X is overpriced”) rather than discussions of strategy and approach.

The general case for international small cap investing was nicely summarized in a December 2018 white paper from AMG and in a July 2019 one from two of the guys at Harbor Capital. It’s worth reading for folks new to the field. Mike Lipper, president of the Royce Funds, has a comparable piece (May 2019) but it requires a slightly annoying registration in order to get access.

Your holiday shopping list starts here: 15/15 funds

By David Snowball

The S&P500 posted, and the DJIA approached, new all-time highs at the end of October while unemployment remained at half century lows. And yet the health of the economy is so fragile that the Federal Reserve felt compelled to cut interest rates for a third time. Skeptics believe that effectively zero-to-negative interest rates is more likely to encourage corporate financial engineering than it is to encourage productive investment. Rupal Bhansali, manager of Ariel Global and Ariel International and now a member of the Barron’s Roundtable, warned that “the market, which had been on steroids, is now on opioids. That’s not going to end well.”

Headline writers, and the self-serving pundits who they channel, do have that “you say ‘crystal meth’ like it’s a bad thing” air about them. A single day’s digest from Business Insider (1 November 2019) led with these four tidbits

Forget the rate cut: BlackRock’s $1.9 trillion bond chief told us of a more significant bombshell the Fed just dropped on markets

‘I would always rather be late’: A chief researcher at a $67 billion financial giant reveals his strategy for avoiding disaster in a market obsessed with growth

Jim Rogers earned a 4,200% return with George Soros by investing in overlooked assets. He tells us what he’s buying now ahead of the ‘worst crash of our lifetime.’

‘Bad from every angle’: America’s trucking recession is now slamming one of the $800 billion industry’s largest companies

Bombshell, disaster, worst crash, slamming recession … and yet on the same day, MarketWatch trumpets:

Dow and S&P guaranteed to rise another 5% in the next two months

US stock market has a good chance to record new highs

Finally, the last bullish stock market signals falls into place

Chart analyst says new record gives investors the green light to jump back into bull market

Bull, indeed.

Tweedy, Browne’s Investment Committee offered a calm, yet near-encyclopedic, list of what might soon go wrong:

… prevailing investor anxiety is, in part, related to above-average risk asset valuations coupled with increasing macroeconomic uncertainty, not the least of which is what appears to be a slowdown in economic growth, both in the U.S. and abroad. Other potential issues currently on the horizon that could pose a threat to market confidence include, but are not limited to: a hard Brexit; escalating trade tensions with China; a long overdue recession; a military confrontation with Iran; a miscalculation by North Korea; continued unrest in Hong Kong; rising debt levels; antitrust scrutiny of some of the FAANG companies; the upcoming U.S. presidential election; and perhaps more importantly, the possibility, however remote, of an uptick in inflation and interest rates. An unexpected outcome with respect to any of these macroeconomic issues could dampen investor enthusiasm, and in turn, negatively impact risk asset valuations, shifting the teeter-totter back in value’s favor. In the interim, we suspect that market volatility is likely to remain with us, and that should bode well for bargain hunting. William H. Browne, et al, Third Quarter Commentary, October 2019

MFO’s recommendation is always the same, and is never a market call: don’t abandon the equity markets, don’t take on more risk than you can manage and keep cash reserves on hand to deploy when values erupt.

Most of us have neither the knowledge nor the fortitude to invest in the face of a market crisis. As a result, we tend to favor funds whose managers have been building cash during the market’s frothy phase; we believe it demonstrates a contrarian good judgment and offers the resources that can be deployed by a professional who doesn’t panic when, well, the rest of us do.

Our approach is to catalog for you funds that have two admirable characteristics: they have been generating solid to excellent absolute returns in the short-run but have substantial cash on hand in order to buffer, then profit from, a market crisis.

The funds below have a substantial equity component, at least 15% in cash and double-digit returns over the past year. We chose the shorter-than-usual 12-month window because it corresponds with the period of heightened market instability, which is relevant to imagining funds that can thrive in good times and bad.

I almost called these “the 10-15 funds” until I discovered that in police radio code, 10-15 signals “prisoner in custody.” I just wasn’t sure that I wanted to go there.

The final two columns are summative judgments from MFO and Morningstar. MFO’s highest designation is “Great Owl” (GO), earned by funds that finish in the 10% of their peer group on risk-adjusted returns for every period longer than 12 months. The Honor Roll (HR) designation is for fund that outperform their peers, not adjusted for risk.

The Morningstar stars are awarded in light of a fund’s past risk-adjusted returns. The medalist awards – gold, silver, bronze, neutral, negative – are a judgment, rendered either by human analysts or a Morningstar machine-learning model that tries to mimic the analysts, are a fund’s future prospects. A Gold-rate fund is one in which Morningstar has the greatest level of confidence that the fund is positioned to outperform in the future.

    Cash 1 year return 3 year return AUM Expense ratio Minimum MFO M*
Akre Focus AKREX Large Growth 19% 27% 23% 11,920 1.32 2,000 GO + HR 5 – Silver
AMG Yacktman Focused YAFFX Large core 26 13 13 3,700 1.27 2,000 GO + HR 4 – silver
Marshfield Concentrated Opportunities MRFOX Large Growth 27 27 22 112 1.10 10,000 GO 5 – neutral
Nuance Concentrated Value NCVLX Large Value 16 18 10 443 1.07 10,000 GO 4 – Neutral
Needham Small Cap Growth NESGX Small Growth 16 25 17 45 1.95 2,000 HR 3 – neutral
Sextant International SSIFX Intl Large Growth 26 19 13 109 1.04 1,000 HR 4 – neutral
Federated Kaufmann KAUFX Mid-Cap Growth 23 14 17 6,401 1.95 1,500 HR 4 – Neutral
Federated Kaufmann Small Cap FKASX Small Growth 16 14 22 3,582 1.35 1,500   5 -Neutral
Artisan International Value ARTKX Foreign Large Core 15 10 9 14,268 1.18 1,000 – closed   4 – silver
FPA International Value FPIVX Foreign Small/Mid Core 34 13 10 247 1.29 1,500   4 – Bronze
T. Rowe Price Int’l Concentrated Equity PRCNX Int’l Large Core 10 14 8 150 0.9 2,500   4 – bronze
BBH Partner Fund – International Equity BBHLX Foreign Large Growth 20 16 9 1,755 0.65 10,000   3 -neutral
Provident Trust Strategy  PROVX Large Growth 16 11 17 185 1.00 1,000   3 – Neutral
Fairholme FAIRX Large Value 28 25 4 1,090 0.82 10,000   1 – negative
Artisan Thematic ARTTX Large Growth 13 17 691 1.51 1,000   n/a
Clarkston Founders CIMDX Mid-Cap Core 28 12 43 0.91 10,000   n/a

Notes on the data: all performance and fee data are current as of mid-October, 2019. The funds’ cash holdings are Morningstar data which we cross-checked with the fund’s website; in the case of a disagreeable, we went with the funds’ self-report.

Every fund name is linked either to its MFO profile or to its homepage.

A quick gloss on some of the funds:

It is exceedingly rare for large funds to hold substantial cash reserves. Their business model does not allow such caution.

Artisan Thematic and Clarkston Founders have not yet reached their three-year mark. While Artisan Thematic strikes me as quirky but the manager does have a substantial record prior to Artisan and Artisan does have a remarkable record for hiring only “category busters” to manage their strategies. The open-minded might want to investigate.

Akre Focus and Sextant International have lead managers who are (1) brilliant, (2) principled and (3) in the … uhh, later stages of their investing careers. Folks might want to get comfortable with the state of the funds’ succession planning before proceeding.

Fairholme is probably not an attractive option for most investors. It is ultra-concentrated and ultra-volatile. When the lead sentence by the Morningstar analyst covering the fund begins “Fairholme doesn’t face a liquidity crisis anymore but …” you know things are iffy.

Yacktman Focused is ridiculously, inexplicable, consistently excellent.

Bottom line

It is delusional to believe that the market will rise forever or that you will have the knowledge and fortitude to commit your cash reserves at the moment of the market’s greatest despair. That is, neither having no cash is bad and having cash that you’re incapable of deploying is bad. Our recommendation, always, is to consider managers who have the cash and have a record of managing both rising markets and tumbling ones. These funds warrant some attention for that role.

Related articles: The 15 / 15 Funds (04/2018), 15/15 funds, one year on (03/2019) and Overachieving defenders: Your late-cycle shopping list (08/2019)


Ariel Global (AGLOX), November 2019

By David Snowball

Objective and strategy

Ariel Global Fund’s fundamental objective is long-term capital appreciation. The manager pursues an all-cap global portfolio. The fund is, in general, currency hedged so that the returns you see are driven by stock selection rather than currency fluctuation. The manager pursues a “bottom up” discipline which starts by weeding out as much trash as humanly possible before proceeding to a meticulous investment in both the fundamentals of the remaining businesses and their intrinsic value. The fund is diversified and will generally hold 50-150 positions. As of September 2019, there are 55.

Adviser

Ariel Investments LLC of Chicago. Founded in 1983, Ariel manages $12.7 billion in assets spread between nine separate account strategies and five mutual funds; a sixth, Ariel Discovery, was liquidated in June, 2019. Ariel provides a great model of a socially-responsible management team: the firm helps run a Chicago public charter school, is deeply involved in the community, has an intriguing and diverse Board of Trustees, is 95% employee-owned, and its managers are heavily invested in their own funds. One gets a clear sense that these folks aren’t going to play fast and loose either with your money or with the rules.

Manager

Rupal Bhansali. Ms. Bhansali joined Ariel in 2011 and has served as portfolio manager for the International and Global Funds since their inception in 2011.  She and her team are based in New York City which substantially eases the burden of meeting representatives of the non-U.S. firms in which they might invest. She has 30 years of industry experience, most recently spending 10 years at MacKay Shields as Head of International Equities, managing MainStay International (MSEAX). Before that, she was a portfolio manager and co-head of international equities at Oppenheimer Capital.

Strategy capacity and closure

Vast. The combined global and international strategies hold about $3.5 billion now but could accommodate $50 billion.

Active share

92.45% as of September 30, 2019

Active share measures the degree to which a fund’s portfolio differs from the holdings of its benchmark portfolio, in this case, the MSCI ACWI Index. The fund’s active share shows a very high level of independence, especially for a fund investing primarily in large cap stocks,  from its benchmark.

Management’s stake in the fund

Both substantial and a lot more than is obvious at first glance. Ms. Bhansali’s reported investment in the fund is between $100,000 – $500,000 as of September 30, 2018. She has two layers of additional investment. First, Ariel is owned by its employees and directors so when she joined the firm, she devoted a fair amount of her wealth to investing in it. Second, her portfolios were originally marketed as separately managed accounts; she made a substantial investment in such an account to visibly align herself with her investors. As a result, the reported investment in the fund is a fraction of her total financial commitment.

All of Ariel’s seven independent trustees have substantial investments in the fund, as have four of her five fellow managers. Ariel president John Rogers is an exception, though he does have a $100,000-500,000 invested in its sibling, Ariel International (AINTX).

Opening date

December 30, 2011.

Minimum investment

$1,000 for Investor shares, $1 million for Institutional (AGLYX) ones.

Expense ratio

1.13%, after the expense waiver, for Investor shares on assets of $13.4 million, as of June 2023.  The Institutional shares charge 0.88%.

Comments

The question is: do “contrarian” investors pose the most intriguing opportunities when their fund have five stars or two? Contrarian portfolios, which are typically identified as value portfolios, tend to have two phases. In the accumulation phase, the manager has identified an opportunity (or set of opportunities) that others have dismissed as trash. The manager buys, the stock declines, and the manager buys more. In the interim, their Morningstar rating falls and investors grow restless. In the harvest phase, the rest of the world catches on and begins bidding up the price of the misunderstood holdings. They hit to contrarian’s “sell” trigger, at which point they harvest gains and celebrate high Morningstar ratings … just before they restock on misunderstood stocks that cause their ratings to fall and the cycle to begin again.

As Ms Bhansali points out, “I’ve had five-star ratings on my funds. Now I have two stars. The process hasn’t changed, my discipline hasn’t changed. Stars come and stars go. I remain a risk-manager and a high-conviction contrarian investor.”

I have spoken with Ms. Bhansali on three occasions, most recently during the AAII conference in October 2019, and have come away impressed from each encounter. She’s had a long career in international and global investing. She’s very smart and articulate; she really gives the impression of thinking about questions rather than rattling off talking points. She’s made a series of principled and thoughtful career moves, and she’s served her investors well. I hope you have the opportunity to engage with her as well.

Three things worth knowing:

  1. She and her team think of themselves as business analysts, not financial analysts. There are a lot of businesses out there which are poorly run, vulnerable to predation or in a dying industry. She wants no part of any of them. “When we look at these fundamental business risks, we eliminate 60% of all firms. Those are stocks that we would not own, ever, regardless of price.” To be clear: they are sensitive to price and valuation, but only if the underlying business is sound.

    Of the sound businesses, about 70-80% are fully valued. Those valuations are much more challenging than when we profiled the fund in 2016; back then, the manager estimated that 50% of all sound businesses were fully valued which reduced their immediately investable universe to 20% of the market. At the stretched valuations in late 2019, they focus their 360-degree analysis on  the ever-smaller pool of sound businesses available at attractive valuations: about 5% of the market.

  2. She and her team are very risk conscious. “We start with the question, ‘what can go wrong? How bad could it get?’ and if we don’t like the answer, we walk away. No amount of theoretical upside is worth some of these risks.”

  3. She and her team build the portfolio stock-by-stock. They’re not benchmarking themselves against an index or peer group; the culture at Ariel favors independent thinking even when it means being out of step. Similarly, they don’t make thematic bets. They allow ideas to compete for space in the portfolio. The more misunderstood a firm is, the more it’s likely mispriced. An example she cites frequently is the choice between Microsoft (which she does own) and Apple (which she doesn’t). Everyone knows that these are two tech giants and everyone knows that tech companies post flashy growth numbers, everyone knows that Microsoft’s best days are behind it. In consequence, everyone bought Apple. As it turns out, “everyone” was wrong. Over the past five years, an investment in Microsoft – a steady cash machine with predictable, recurrent cash flows – was far more profitable (up 196%, as of 10/31/2019) than an investment in Apple (up 127% with substantially greater volatility). “Everyone is ‘contrarian’ but it’s not enough to be contrarian. You must be contrary and correct. Very few are.” The most mispriced firms earn the largest spots in the portfolio. As of October 2019, Microsoft is the fund’s largest holding. Like most of the fund’s top 10 holdings, it has been in the portfolio virtually since inception.

Her preference for a global portfolio of sound businesses with mispriced stocks lands her in Lipper’s Global Large Cap Value category along with the likes of Oakmark Global Select (OAKWX), Dodge & Cox Global Stock (DODWX) and Tweedy, Browne Value (TWEBX). It’s good company. Among the 13 funds and ETFs in the category with a record of seven years or more, here are Ariel’s rankings:

  Absolute value Rank
Annual return 8.8% 6th best of 13
Maximum drawdown -11.5% 4th
Sharpe ratio .80 1st (tied with BlackRock Global 100)
Sortino ratio 1.30 1st
Martin ratio 2.42 1st
Capture ratio, MSCI ACI xUS 1.42 2nd
Capture ratio, S&P 500 0.85 1st
Ulcer Index 3.3 1st

Annual return is a pure return measure, made without consideration of volatility. By that measure, Ariel Global is a tiny bit above average. Maximum drawdown is a pure risk measure, looking only at the worst slum a fund suffered during the period. By that measure, Ariel is substantially above average.

The fund’s greatest distinction comes in the five measures of risk-adjusted performance. It is, by every measure, the best or second-ranked option for investors over the past seven years. While Sharpe ratios are familiar as the most common metric for risk-adjusted returns, MFO and the MFO Premium screeners are more risk-aware than most and so we complement that with additional metrics:

Sortino: an adaptation of the Sharpe ratio which focuses on a fund’s returns relative to its downside volatility; Sharpe looks at both upside and downside volatility which, critics say, ends up punishing funds with “good” volatility and masking some with “bad” (or downside) volatility.

Martin: an adaptation of the Sharpe ratio which focuses excess return relative to a fund’s typical drawdown, again since people rarely worry about volatility (“is my fund high or higher?”) in rising periods.

Capture ratio: is simple the ratio of Upside to Downside Capture. A fund that captures, say, 80% of a market’s upside and 50% of its downside is far more attractive than a fund that captures 80% of the upside plus 100% of the downside. Since we don’t have a global benchmark in the database, we offer Ariel’s performance against the MSCI international index (2nd) and the domestic S&P 500 (1st).

Ulcer Index: which captures both how far a fund falls and how long it stays down, with the notion that falls that go down and stay down give their investors (and their managers) the worst ulcers.

The simple generalization is this: since inception, Ariel Global has offered its investors reasonably good returns with exceptionally good risk-management. That’s certainly in line with Ms. Bhansali’s description of herself as an investor who manages risks rather than returns.

Bottom Line

Cautious, global and value have not been in favor for the better part of a decade. Much of that is attributable to interest rates near, or even below, zero which has engendered and rewarded all sorts of corporate shenanigans. Ms. Bhansali’s judgment is that “a market that’s been on steroids is now on opioids which, I believe, cannot end well.”

Ariel International and Global follow the same discipline. Purists might prefer to look more closely at the larger International (AINTX) fund. Both because it’s smaller and it affords its manager greater flexibility, we chose to profile Global. In either case, patient, risk-sensitive investors interested in expanding (or upgrading) their international exposure should add the funds to their due-diligence list.

Fund website

Ariel Global.  Ms. Bhansali just published her first book, Non-Consensus Investing: Being Right When Everyone Else is Wrong (2019) which intertwines her life story, her investment perspective and her concern that other women be empowered to take responsibility for their financial futures. It’s available in paper and Kindle through Amazon. The writing’s a bit uneven but the content is powerful. The News page on the Ariel Funds site has several good stories involving Ms. Bhansali, including her recent addition to the Barron’s Roundtable.

© Mutual Fund Observer, 2019. All rights reserved. The information here reflects publicly available information current at the time of publication. For reprint/e-rights contact us.

Castle Focus (MOATX), November 2019

By David Snowball

Objective and strategy

Castle Focus Fund seeks long-term capital appreciation. They have a bottom-up, absolute value focus, which means a ready willingness to hold substantial amounts of cash when they’re not able to find good companies selling at substantial discounts. The portfolio is typically comprised of 15 to 30 positions. Currently about 30% of the portfolio is in cash and about 30% is invested in non-US companies.

Adviser

Castle Investment Management, which is headquartered in Alexandria, Virginia. Castle was founded in 2010 by Caeli Andrews and Andrew Welle. Castle has about $111 million in AUM and offers two funds, Focus and Tandem. Castle Focus is sub-advised by St. James Investment Company, headquartered in Dallas, Texas. St. James was founded in 1999 and positions itself as “absolute value” investors. As of September 2019, St. James managed $1.2 billion.

Manager

Robert Mark. Mr. Mark has been the portfolio manager since its inception. Mr. Mark formerly worked in the Private Client Group at Goldman Sachs, earned his MBA in finance at the University of Texas and graduated from the United States Military Academy at West Point with a BS in Engineering. The firm’s Form ADV notes that, “Robert Mark is the sole Portfolio Manager at St. James.” In addition to this fund, Mr. Mark is responsible for several thousand SMAs.

Strategy capacity and closure

By MFO’s rough calculation, about $12.5 billion.

Management’s stake in the fund

Mr. Mark has a minor investment in the fund, between $10,000 – 50,000 as of June 30, 2018. None of the fund’s trustees have chosen to invest in the fund.

Active Share

95.93, per Morningstar.

Active share measures the degree to which a fund’s portfolio differs from the holdings of its benchmark portfolio, in this case, the S&P500 Index. The fund’s active share shows a very high level of independence, especially for a fund investing primarily in large cap stocks, from its benchmark.

Opening date

July 1, 2010.

Minimum investment

$4,000

Expense ratio

1.35% on assets of $24.6 million, as of July 2023. 

Comments

Mr. Mark practices a discipline that is old, intuitive, successful and now incredibly rare. Here’s the short version: find a few really good companies, buy their stocks when they are trading for substantially less than fair value and, if there are no stocks to buy, don’t buy stocks.  Be patient, in time irrationality will reassert itself and irrationally good values will again be available. Until then, keep your powder dry and your cash ready. Such folks are designated “absolute value” investors.

The simple principle is “valuation matters” or, more particularly, “the price you paid, sometimes called the entry price, matters.” If you overpay, you will underperform in the long term. Sadly, few shareholders have the patience to wait out the stock market’s stretches of mania. In consequence, few absolute value investors remain.

Mr. Mark is one of them. He practices a classic discipline and practices it well. Here’s his Investment Process Summary:

  • Maintain a “wish list” of high‐quality companies, characterized by sound balance sheets and enduring business models. We emphasize a high probability of consistent cash flows over a long‐term horizon.
  • For each we quantify fair value, applying a 10% discount rate to our conservative cash flow projections.
  • Determining a “margin of safety” is a proprietary qualitative assessment of the risks associated with a company’s business model.
  • Portfolio Construction incorporates weighting each stock consistent with the margin of safety, sizing a position in accordance to the discount to fair value / potential for gain.
  • Trim and eventually sell a stock when price approaches / exceeds fair value or fundamentals change.

That’s translated to a compact, global portfolio of 24 mid- to large-cap stocks. The manager’s willingness to trim positions inflates the reported turnover rate by a bit; Morningstar reports 74% but half the portfolio was first purchased two to nine years ago.

It is most distinctly holds cash when attractive opportunities are scarce. Mr. Mark writes in 2019:

The Fund held a significant cash position throughout the fiscal year, which is an important part of our process. Given our absolute-return mindset, we contend that entry price is a significant determinant of return. As a result, we often wait for compelling prices to thoughtfully deploy capital. This is especially true over the last year, when prices of high-quality companies were significantly elevated above our conservative estimate of fair value.

“Significant” translates to 30%. Despite that drag, the fund has posted double-digit returns in three of the past four years and modestly outperformed their peers in the other one.

His preference for a global portfolio of sound businesses with mispriced stocks lands him in Lipper’s Global Multi Cap Value category along with the likes of Artisan Global Value (ARTGX), Causeway Global Value (CGVIX), Polaris Global Value (PGVFX) and Tweedy, Browne Global Value (TBCUX). It’s good company. Among the 24 funds and ETFs in the category with a record of nine years or more, here are Castle’s rankings:

  Absolute value Rank
Annual return 7.3% 13th best of 24
Maximum drawdown -7.2% 1st (best)
Downside deviation 5.9 4th
Bear market deviation 5.0 4th
Sharpe ratio .95 1st
Sortino ratio 1.15 1st
Martin ratio 3.31 1st
Capture ratio, MSCI ACI xUS 1.47 6th  
Capture ratio, S&P 500 0.82 6th  
Ulcer Index 2.0 1st

Annual return is a pure return measure, made without consideration of volatility. By that measure, Castle is a tiny bit above average.

That’s followed by three risk measures. Maximum drawdown is a pure risk measure, looking only at the worst slump a fund suffered during the period. By that measure, Castle is the category’s leader. Downside deviation measures just “bad” volatility and bear market deviation measures volatility in bear market months. By both measures, Castle is a top tier fund.

The fund’s greatest distinction comes in the five measures of risk-adjusted performance. It is, by every measure, the best or second-ranked option for investors over the past seven years. While Sharpe ratios are familiar as the most common metric for risk-adjusted returns, MFO and the MFO Premium screeners are more risk-aware than most and so we complement that with additional metrics:

Sortino: an adaptation of the Sharpe ratio which focuses on a fund’s returns relative to its downside volatility; Sharpe looks at both upside and downside volatility which, critics say, ends up punishing funds with “good” volatility and masking some with “bad” (or downside) volatility.

Martin: an adaptation of the Sharpe ratio which focuses excess return relative to a fund’s typical drawdown, again since people rarely worry about volatility (“is my fund high or higher?”) in rising periods.

Capture ratio: is simply the ratio of Upside to Downside Capture. A fund that captures, say, 80% of a market’s upside and 50% of its downside is far more attractive than a fund that captures 80% of the upside plus 100% of the downside. Since we don’t have a global benchmark in the database, we offer Castle’s performance against the MSCI international index (6th) and the domestic S&P 500 (6th).  In this case, 6th equates with “top 25%.”

Ulcer Index: which captures both how far a fund falls and how long it stays down, with the notion that falls that go down and stay down give their investors (and their managers) the worst ulcers.

The simple generalization is this: since inception, Castle Focus has offered its investors reasonably good returns with exceptionally good risk-management.

At the same time, we should note that the fund is probably not a good fit for investors concerned about the carbon footprint of their investments or similar matters of “sustainable investing.” Morningstar tends to assign it “low” to “below average” ratings on such things.

Bottom Line

Castle Focus has repeatedly appeared in MFO’s articles on absolute value investing and managers with “dry powder,” both of which were written to identify the managers most likely to serve you best when markets are at their worst. That discipline is least attractive in the frothy, late stages of a bull market and the fund’s relative performance against their (domestic) Morningstar peer group is weak while their performance against their (global) Lipper group remains solid. Equity investors who realize that valuation matters and are willing to wait patiently for opportunities to arise should put Castle Focus on their immediate due-diligence list.

Fund website

Castle Focus Fund

[cr20198]

Launch Alert: Avantis International Small Cap Value (AVDV)

By David Snowball

Between September 17 – September 24, 2019, Avantis Investors launched a series of five actively-managed ETFs. They are:

Avantis Emerging Markets Equity ETF AVEM, e.r. 0.33%

Avantis International Equity ETF AVDE, e.r. 0.23%

Avantis International Small Cap Value ETF AVDV, e.r. 0.36%

Avantis U.S. Equity ETF AVUS, e.r. 0.15%

Avantis U.S. Small Cap Value ETF AVUV, e.r. 0.25%

Because of the fundamental similarities between them, we choose just one as an exemplar of the group. Chip, MFO’s cofounder and technical director, declared “international small cap value sounds cool, do that one!” Since she is, she reminds me, never wrong, I did.

Avantis Investors is a subsidiary of American Century, a $168 billion asset manager that was one of the pioneers of no-load investing. They have five strategies which they’ll offer through active ETFs, institutional mutual funds and separately managed accounts. Their particular distinction in the marketplace is that their principals are all alumni of Dimensional Fund Advisors (DFA). DFA is a legendary firm whose investment disciplines are based on rigorous academic research; long before it became vogue, DFA was pioneering smart beta portfolios where conventional index portfolios were reshaped by overlays for factors such as size and value. DFA’s concern for the integrity of their brand made them legendary, and largely inaccessible. Their funds could be purchased only through financial advisors, and the advisors had to earn the right to sell DFA funds through rigorous financial coursework.

For reasons not yet clear, a group of experienced DFA executives and managers left the firm to found Avantis. They are:

Eduardo Repetto, PhD, former co-Chief Executive Officer and co-Chief Investment Officer of Dimensional Fund Advisors; Dr. Repetto’s degrees are all in engineering, including a doctorate in aeronautics from CalTech.

Pat Keating, CFA, former Chief Operating Officer of Dimensional Fund Advisors

Mitchell Firestein, investment manager at DFA from 2005-2019

Daniel Ong, CFA, senior portfolio manager and vice president at Dimensional Fund Advisors (DFA) from 2005 to 2019.

Ted Randall, portfolio manager at DFA from 2001-2015 and founder of Pro-Value Construction Services, Inc. from 2016 to 2018. Really: “I was growing tired of working as a portfolio manager at a mutual fund and not sure what I wanted to do next, but I knew I didn’t want to continue what I was doing. So, I quit my job of 16 years and started working on the house with our new contractor.” After being burned by unscrupulous contractors, he decided that he and a partner, Tre, could do better. (“Meet Ted Randall and Tre Green of Pro-Value Construction Services in Rolling Hills Estates,” VoyageLA, June 12, 2017)

An interesting side benefit of working with Avantis is that Jim Stowers, the founder of American Century, created a structure whereby AC and its affiliates would provide financial support to the Stowers Institute for Medical Research at the University of Missouri. Since 2000, American Century’s dividends distributed to the Institute have totaled more than $1.5 billion.

International Small Cap Value ETF invests primarily in a diverse group of non-U.S. small cap value companies across market sectors, industry groups, and countries. The portfolio currently has about 850 stocks while their benchmark index, MSCI World ex USA Small Cap Index, has 2500. They aim to harvest three sets of advantages:

  1. the advantages of with indexing (diversification, low turnover, transparency of exposures)
  2. the advantages of active tilts driven by academic factor research and quantifiable factors
  3. the advantages of careful trading. At base, they recognize that some trades are not, in practical terms, worth making.

The portfolio’s tilts place an emphasis on firms with smaller market caps and high profitability. They’ll underweight or exclude some of the indexes larger, more expensive or less profitable firms. The term “small cap” is, they note, relative so that what qualifies as “small” in one country might be “large” in another.

Morningstar concludes that DFA “continues to be an outstanding steward of its shareholders’ capital … [their] investment strategies are rooted in research from the top minds in financial academia. These same researchers use a rigorous vetting process when developing new strategies or modifying existing ones. Proposals must be exploitable in a well-diversified, low-turnover, and cost-effective manner.” Investors hoping that the (accessible) apple doesn’t fall far from the (inaccessible) tree might want to investigate the five Avantis ETFs more closely.

Funds in Registration

By David Snowball

The Securities and Exchange Commission, by law, gets between 60 and 75 days to review proposed new funds before they can be offered for sale to the public. Each month, Funds in Registration gives you a peek into the new product pipeline. Most funds currently in registration will become available by year’s end, which is the reason for the surge now

Our list contains 30 new funds and active ETFs. We don’t usually track passive ETFs but did want to mention two this month, both passive ETFs designed to give Muslim investors broad exposure to the stock market and exposure to the equivalent of an investment grade bond fund. Those are the SP Funds S&P 500 Sharia Industry Exclusions ETF and SP Funds Dow Jones Global Sukuk ETF.

Many of the funds this month, in their rush to get this stuff into the pipeline in time for a launch before year’s end, have not determined their expense ratios. Of those who have disclosed expenses, five start life with near-suicidal expenses above 2.0%. Only a couple of the funds stand-out, FMI International Fund II – Currency Unhedged which mirrors the very fine FMI International Fund, and Grandeur Peak US Stalwarts Fund, which follows in the footsteps of Grandeur Peak’s International Stalwarts and Global Stalwarts funds.

Acclivity Broad Equity Multi-Style Fund

Acclivity Broad Equity Multi-Style Fund  will seek long-term capital appreciation. The plan is to use a quantitatively driven, factor-based investment strategy to construct a 2000 stock portfolio. The fund will be managed by a team of PhDs from Innealta Capital. Its opening expense ratio has not been disclosed, and the minimum initial investment will be $10,000.

AdvisorShares DWA FSM US Core ETF

AdvisorShares DWA FSM US Core ETF, an actively-managed ETF, seeks long-term capital appreciation with capital preservation as a secondary objective. The plan is to use the FSM Core Solution US Core Model, constructed by Dorsey, Wright, to construct a portfolio of ETFs. The fund may move toward cash if the markets turn ugly. The fund will be managed by Robert M. Parker of AdvisorShares. Its opening expense ratio is reported as 0.xx%.

AlphaCentric Energy Income Fund

AlphaCentric Energy Income Fund will seek total return with an emphasis on current income. The plan is a bit fuzzy with regard to the “income” part but, in general, they’re investing in the common and preferred stocks of energy-related companies, and might involve in bonds and options. The fund will be managed by J.C. Frey and James Baker of Kayne, Anderson. Its opening expense ratio is a steep 1.74%, and the minimum initial investment will be $2,500.

Aperture Small Cap Opportunities Fund

Aperture Small Cap Opportunities Fund will seek a return in excess of the Russell 2000 Total Return Index. (I’m not a fan of the “our plan is to beat the benchmark” mantra.) The plan is to take “long and short positions in equity securities of companies that the Adviser believes are undergoing transformational change.” The focus is on North American small cap stocks. The fund will be managed by Brad McGill of Aperture Investors. Its opening expense ratio is 2.45%, and the minimum initial investment will be $500.

Archer Focus Fund

Archer Focus Fund will seek long-term growth of capital. The plan is to use a “bottom-up” approach to select about 50 stocks. That’s about all the detail I’ve got. The fund will be managed by a team from Archer Investments. Its opening expense ratio is 1.21%, and the minimum initial investment will be $2,500.

Archer Multi Cap Fund

Archer Multi Cap Fund will seek long-term growth of capital. The plan is to buy stock in about 100 domestic companies that are financially sound and have good prospects for the future. The fund will be managed by team from Archer. Its opening expense ratio is 1.21%, and the minimum initial investment will be $2,500.

Axonic Strategic Income Fund

Axonic Strategic Income Fund will seek to maximize total return, through a combination of current income and capital appreciation. The plan is to invest primarily in asset-backed, income-producing securities with the slightly worrisome note that “for speculative or hedging purposes, the Fund may use various cleared and uncleared over-the-counter and exchange-traded derivatives.” The fund will be managed by a team from Axonic Capital LLC. Its opening expense ratio has not been disclosed nor has the minimum initial investment.

Baron FinTech Fund

Baron FinTech Fund will seek capital appreciation. The plan is to invest in growth stocks, specifically companies that provide technologies or services for the financial services industry and companies that provide financial services using technology. (Uhh … ATMs, Ron?) The fund will be managed by Josh Saltman of Baron Asset Management. Its opening expense ratio has not been released, and the minimum initial investment will be $2,000.

Cambria Global Real Estate ETF

Cambria Global Real Estate ETF, an actively-managed ETF, seeks income and capital appreciation. The plan is to use a computer model that factors in valuation, momentum and quality factors to select 100 global real estate stocks. The portfolio positions will be equally weighted. The fund will be managed by Mebane Faber. Its opening expense ratio is 0.59%.

Catalyst/Teza Algorithmic Allocation Income Fund

Catalyst/Teza Algorithmic Allocation Income Fund will seek long-term capital appreciation and current income. The plan is to use futures contracts to gain broad exposure to different asset classes; with the exposure changing daily. They’re going to target 9-12% annualized volatility, and get the best returns they can for that level of risk. The prospectus helpfully offers up 27 single-spaced pages of risks that investors face. The fund will be managed by Dr. Mikhail Malyshev and Dr. Reinhold Gebert of Teza. Its opening expense ratio is 2.24% for “A” shares, and the minimum initial investment will be $2500.

Dynamic Global Diversified Fund

Dynamic Global Diversified Fund will seek capital appreciation and income. It’s a “go anywhere, buy anything” portfolio whose success depends on “the professional judgment of the Adviser” and the Quantitative Framework. The fund will be managed by Vito Sciaraffia, and Josh Kocher of Innealta Capital. Its opening expense ratio has not been disclosed, and the minimum initial investment will be $10,000. This fund appears in the second half of a prospectus that begins with the Acclivity fund, fyi.

First Trust Vivaldi Merger Arbitrage ETF

First Trust Vivaldi Merger Arbitrage ETF, an actively-managed ETF, seeks capital appreciation. The plan is to establish long and short positions in the equity securities of companies that are involved in a publicly-announced significant corporate event, such as a merger or acquisition. The fund will be managed by six guys from Vivaldi Asset Management. Its opening expense ratio has not been disclosed.

FMI International Fund II – Currency Unhedged

FMI International Fund II – Currency Unhedged will seek long-term capital appreciation. The plan is to be FMI International (FMIJX, large cap, value-oriented, quality oriented, successful) without the currency hedge. Such hedges tend to reduce volatility but, like all insurance, come at a cost. Tweedy, Browne made an identical decision – to launch on unhedged version of their international fund – at the behest of shareholders. The fund will be managed by the same 10 people who manage FMIJX. Its opening expense ratio is 1.00% on both Investor and Institutional shares (nice touch, guys), and the minimum initial investment will be $2,500.

Franklin Disruptive Commerce ETF

Franklin Disruptive Commerce ETF, an actively-managed ETF, seeks Capital appreciation. The plan is to invest “in equity securities of companies that are relevant to the Fund’s investment theme.” (Great.) Bottom-up, non-diversified, mostly centered on consumer-discretionary industries. The fund will be managed by Matthew Moberg and Joyce Lin of Franklin Advisers. Its opening expense ratio has not been disclosed. The same prospectus covers the very similar language around the launch of Franklin Genomic Discovery ETF and Franklin Intelligent Machines ETF.

Grandeur Peak US Stalwarts Fund

Grandeur Peak US Stalwarts Fund will seek long-term growth of capital. The “Stalwarts” funds are sort of funds for stocks that have graduated from Grandeur Peak’s core micro-to-small cap growth funds. The portfolios often have stocks that are a bit too large and a bit too sedate for the core funds any longer. In general, the other Stalwarts have been good investments. The fund will be managed by Randy Pearce, and Brad Barth. Its opening expense ratio has not been disclosed, and the minimum initial investment will be $2,000.

Guardian Fundamental Global Equity Fund

Guardian Fundamental Global Equity Fund will seek long-term capital appreciation. The plan is to use bottom-up investment approach to construct a portfolio of mid-to-large cap global stocks, targeting high-quality companies capable of sustaining growth for more than five years. The fund will be managed by Michael Boyd and Giles Warren. Its opening expense ratio is 0.99%, and the minimum initial investment will be $10,000.

Lebenthal Ultra Short Tax-Free Income Fund

Lebenthal Ultra Short Tax-Free Income Fund will seek a high level of current income exempt from federal income tax consistent with relative stability of principal. The plan is to buy munis with a maturity of a year or less. The fund will be managed by Gregory Serbe of DCM Advisers. Its opening expense ratio is 0.74%, and the minimum initial investment will be $1,500.

LHA Market State Alpha Seeker ETF

LHA Market State Alpha Seeker ETF, an actively-managed ETF, seeks positive returns across multiple market cycles that are generally not correlated to the U.S. equity or fixed income markets. The plan is to invest long or short in instruments linked directly or indirectly to the performance and/or volatility of the S&P 500® Index. The fund will be managed by Michael and Matthew Thompson of Thompson Capital. Its opening expense ratio has not been disclosed.

Midwood Long/Short Equity Fund

Midwood Long/Short Equity Fund will seek long-term capital appreciation. The plan is to buy small value stocks and short small growth stocks. This is a former hedge fund, Midwood Capital Partners, L.P., that has, but has not disclosed, a long track record. The fund will be managed by David Cohen of Crow Point Partners. Its opening expense ratio is 2.25%, and the minimum initial investment will be $1000.

Princeton Alternative Premium Fund

Princeton Alternative Premium Fund will seek capital appreciation and income. The fund relies on two principal investment strategies: 1) a premium collection strategy involving sale or purchase of put options on the S&P 500 Index and 2) investing in fixed income securities. The fund will be managed by Greg Anderson and John L. Sabre of Princeton Fund Advisors. Its opening expense ratio has not been disclosed and the minimum initial investment will be $2,500.

Q3 All-Weather Sector Rotation Fund

Q3 All-Weather Sector Rotation Fund will seek long-term growth of capital. It’s a fund of funds and ETFs with the usual plan: use a computer to target which sectors to buy and which to sell, then move to bonds if the equity market is getting too ugly. The fund will be managed by three guys from Q3 Asset Management. Its opening expense ratio is 2.19%, and the minimum initial investment will be zero.

Q3 All-Weather Tactical Fund

Q3 All-Weather Tactical Fund will seek positive rate of return over a calendar year regardless of market conditions. It’s a fund of funds and ETFs with the usual plan: use a computer to target which sectors to buy and which to sell, then move to bonds if the equity market is getting too ugly. Just more conservatively than their other fund does it. The fund will be managed by three guys from Q3 Asset Management. Its opening expense ratio is 2.19%, and the minimum initial investment will be zero.

Raub Brock Dividend Growth Fund

Raub Brock Dividend Growth Fund will seek “long-term capital appreciation growth.” Uhh … they want to grow their appreciation? The plan is to invest in high quality companies with growing dividends. The portfolio will hold 20 stocks. The fund will be managed by Richard Alpert. Its opening expense ratio has not been disclosed nor has the minimum initial investment.

Segall Bryant & Hamill Small Cap Core Fund

Segall Bryant & Hamill Small Cap Core Fund will seek long-term capital appreciation. The plan is to buy US small cap stocks using a combination of quantitative analysis, fundamental analysis and experienced judgment. This is another converted hedge fund, Lower Wacker Small Cap Investment Fund, LLC, with a long though undisclosed record. (Ummm … Lower Wacker Drive in Chicago is a subterranean stretch that could easily double for the set of a post-apocalyptic zombie flick.) The fund will be managed by Jeffrey Paulis and Mark Dickherber of SB&H. Its opening expense ratio is one-point-undisclosed-something percent, and the minimum initial investment will be $2500.

SmartETFs Marketing Technology ETF

SmartETFs Marketing Technology ETF will seek long-term capital appreciation. The plan is to invest in 30 marketing technology companies. The fund will be managed by Dustin Lewellyn, Ernesto Tong and Anand Desai of Penserra Capital on behalf of Guinness-Atkinson, the adviser. Its opening expense ratio has not been disclosed.

SP Funds Dow Jones Global Sukuk ETF

SP Funds Dow Jones Global Sukuk ETF, an actively-managed ETF, will seek to track the performance of the Dow Jones Sukuk Total Return (ex‑Reinvestment) Index. Think of it as the equivalent of an investment-grade bond fund for Muslim investors, who are religiously-proscribed for investing in traditional bonds and other interest-bearing notes. The fund will be managed by CSat Investment Advisory, L.P. Its opening expense ratio has not been released.

SP Funds S&P 500 Sharia Industry Exclusions ETF

SP Funds S&P 500 Sharia Industry Exclusions ETF, an actively-managed ETF, will seek to track the performance, before fees and expenses, of the S&P 500 Sharia Industry Exclusions Index, which was newly-minted in 2019. That comes down to all Sharia-compliant companies in the S&P 500 Index, so think of the S&P500 without sin stocks (guns, porn, alcohol, and banks). The fund will be managed by CSat Investment Advisory, L.P. Its opening expense ratio has not been released.

Trend Aggregation Cannabis ETF

Trend Aggregation Cannabis ETF, an actively-managed ETF, seeks long-term capital appreciation. The plan is to invest in legal cannabis-related businesses or ETFs using quant process “to identify investment opportunities, based on strong price momentum and companies that are potentially oversold. The Adviser uses multiple investment models that combine market trend and counter trend following, pattern recognition and market analysis … The Fund may invest, a portion of the Fund’s portfolio in volatility ETFs and ETNs, leveraged ETFs and inverse ETFs. In managing the Fund’s portfolio, the Adviser will engage in frequent trading, resulting in a high portfolio turnover rate.” The fund will be managed by Matthew Tuttle. Its opening expense ratio is 1.87%.

Briefly Noted . . .

By David Snowball

Updates

GMO is now urging you to get comfortable with being uncomfortable. In a new GMO Insights piece titled “Emerging Market Stocks: Getting Comfortable with the Uncomfortable,” they look at how lackluster emerging market equity returns in recent years have led many to write off the asset class. They note that” value stocks within emerging markets are particularly cheap, trading at their largest discount since December 2001.” Profitably remains solid about EM corporations, despite the obvious headwinds.

Effective October 11, 2019, Inbok Song ceased to be a portfolio manager for Seafarer Overseas Growth and Income (SFGIX). Seafarer reoriented its portfolio last year to include an explicit commitment to pure value and growth stocks, as with as the steady stocks that had traditionally been the portfolio’s core. Ms. Song was responsible for the growth sleeve of the portfolio. For the nonce her responsibilities will be covered by other established members of the Seafarer team, with the prospect will seek out, vet and acculturate a new growth-oriented colleague in the next year or so. William Samuel Rocco, a long-tenured Morningstar analyst, concludes, “Seafarer Overseas Growth and Income’s management team remains solid after the departure.” We concur.

Briefly Noted . . .

RiverPark Funds is getting into the podcasting business. Mitch Rubin writes, “We just released our first podcast, discussing our Large Growth and Long/Short strategies entitled ‘May You Live in Interesting Times.’ The podcast is under 10 minutes long and features our CEO Morty Schaja and me discussing the topics we reviewed in our recent third quarter investor letters. “

As part of ongoing planning, James and Vanita Oelschlager, the founders and owners of Oak Associates – advisor to the seven Oak Funds (e.g. White Oak Growth WOGSX) – have agreed to sell “substantially all” of their stake in the company to an employee group. The management teams and fees will remain the same, with Mr. Oelschlager and Robert Stimpson continuing as co-CIOs. It looks like there’s a shareholder vote in December on the proposal.

SMALL WINS FOR INVESTORS

Alta Quality Growth Fund (AQLGX) has reduced its minimum initial investment from $10,000 to $2,500. Tiny fund, year-old, good start so far.

On October 1, Boston Partners reduced their advisory fee on both Boston Partners Emerging Markets Long/Short (BELSX) to 1.5% from 1.85% and Small Cap Value II (BPSCX) to 0.95% from 1.0%.

Effective November 1, CrossingBridge Low Duration High Yield Fund (CBLDX) will lower its operating expense limit by 10 bps, from 0.9% to 0.8%.

INVESCO European Small Company Fund (ESMAX) has reopened to new investors after being closed for about four years.

Effective October 31, 2019 Litman Gregory Masters Alternative Strategies Fund (MASFX) lowered its operating expense ratio to 1.36% from 1.54%.

Effective November 1, 2019, Otter Creek Advisors, lowered its management fee on Otter Creek Long/Short (OTCRX) from 1.50% to 1.35%.

On November 4, Vanguard Alternative Strategies Fund (VASFX) will slash its minimum initial investment by 80% (from $250,000 to $50,000). Quick note for those of you with $50,000 to spend: not compelling.

CLOSINGS (and related inconveniences)

Wells Fargo Special Small Cap Value Fund (ESPAX) has closed to most new investors. It’s a five-star small cap fund with $3.4 billion in assets.

OLD WINE, NEW BOTTLES

Sometime in December, American Energy Independence ETF (USAI) becomes Pacer American Energy Independence ETF with the same expenses but new managers.

Effective October 11, 2019, Balter European L/S Small Cap Fund (BESRX) was renamed F/m Investments European L/S Small Cap Fund.

Cannabis Growth Fund (CANNX) is doing away with its institutional share class. The current institutional shares will be converted into investor class shares on November 14, 2019. As part of that conversion, the expense ratio on the investor shares will be reduced to the level now assessed on institutional shareholders: 1.10%. Not to offer any commentary on the change, but the fund has $1.8 million and its performance since inception looks like this:

Yeah, they’re the blue line.

On January 2, 2020 Cohen & Steers Global Realty Majors ETF (GRI) becomes ALPS REIT Sector Dividend Dogs ETF (RDOG) and will begin tracking the S-Network REIT Dividend Dogs Index.

Effective October 21, 2019, Crawford Dividend Opportunity Fund (CDOFX) became Crawford Small Cap Dividend Fund. We profiled CDOFX in our October issue.

Effective October 15, 2019 Green Square High Income Municipal Fund (GSTAX) was renamed to the Principal Street High Income Municipal Fund.

On or about December 1, 2019, Rational Dividend Capture Fund (HDCAX) name, investment policy and principal investment strategies change with the addition of a new management team and the “repositioning the Fund as an equity fund with a hedging component.” The new fund will be named Rational Equity Armor Fund.

Around January 20202, the Tocqueville Gold Fund (TGLDX) will become the Sprott Gold Fund with the current management team still in place. Morningstar dismisses the fund as having an “increasingly outdated process and inhibitive price tag” and counsels investors to find at gold ETF if they’re really into the asset class.

Effective January 1, 2020, the T. Rowe Price Personal Strategy Balanced Fund (TRPBX) will be renamed T. Rowe Price Spectrum Moderate Allocation Fund while T. Rowe Price Personal Strategy Growth Fund (TRSGX) gets rechristened T. Rowe Price Spectrum Moderate Growth Allocation Fund. No other changes are apparent. Traditionally “Spectrum” signaled “fund of funds” and “Personal Strategy” signaled “individual securities.” I suspect that that distinction has been too cumbersome to market.

OFF TO THE DUSTBIN OF HISTORY

361 Global Equity Absolute Return Fund (AGRQX) liquidated on October 18, 2019.

On about November 25, 2019, PIMCO EqS Long/Short Fund (PMHAX) will be merged into the PIMCO RAE Worldwide Long/Short PLUS Fund (PWLBX). The latter is otherwise closed to new investors and is, on whole, a solid fund.

Tocqueville is “pleased to announce” that Tocqueville Select Fund (the “Select Fund”) will be merged into the Tocqueville Phoenix Fund (the “Phoenix Fund”) on or about November 15, 2019. Ummm … Tocqueville Phoenix has trailed 96% of its peers over the past decade and carries one star from Morningstar, making the “pleased” part ring a bit hollow.

Funds liquidating in the near future:

CG Core Total Return Fund October 29, 2019
Convergence Opportunities Fund October 31, 2019
Equable Shares Small Cap Fund (which had already undergone a series of openings and closings in its year of life) October 30, 2019
GraniteShares S&P GSCI Commodity Broad Strategy No K-1 ETF November 15, 2019
Hancock Horizon U.S. Small Cap Fund November 25, 2019
Lazard Emerging Markets Income Portfolio Lazard Explorer Total Return Portfolio Lazard US Realty Equity Portfolio October 30, 2019
Linde Hansen Contrarian Value Fund November 22, 2019
Measured Risk Strategy Fund November 22, 2019
Salient International Small Cap December 12, 2019
Voya International Real Estate December 6, 2019