Monthly Archives: July 2023

July 1, 2023

By David Snowball

Welcome to summer!

It’s really rare that acts of explosive deconstruction are the highlight of my month, but June was a special month. It welcomed summer and saw us bid farewell to a Quad Cities icon, the I-74 Twin Bridges.

Photo credit: Our friend, Roberta Osmers, Illuminated Scene Photography

The first span opened in November of 1935, one lane in each direction, providing an unprecedented opportunity to cross the Mississippi River in comfort and style. Businesses boomed, the cities grew, and the solution was to create a second span, just a hundred feet downriver of the first, using the same set of blueprints. That span, which allowed two lanes into Illinois, opened in 1959. By 2012, the Secretary of Transportation declared the old bridge “one of the worst bridges I’ve ever seen.” (We never liked him anyway.)

Its successor, begun in 2017, so completely dwarfs the old bridges that … well, here …

Source: Iowa DOT, I-74 River Bridge Facebook

John Adams had a fairly poor start to his summer. He was sort of zero-for-two on celebrations.

Reflecting on the recently passed Declaration of Independence, Adams prophesied:

The Second Day of July 1776 will be the most memorable Epocha, in the History of America. I am apt to believe that it will be celebrated, by succeeding Generations, as the great anniversary Festival… It ought to be solemnized with Pomp and Parade with Shews, Games, Sports, Guns, Bells, Bonfires and Illuminations from one End of this continent to the other from this Time forward forever more. (Letter to Abigail Adams, 7/3/1776)

So close, John. So very close. The Continental Congress did vote to declare American independence on July 2, 1776, which is what Adams exulted in. So what’s up with the July 4th date? The most crass and contemporary explanation is that’s the date on the press release announcing the decision. After voting for independence, the delegates had a small committee provide a final, formal draft of what they’d done and why. The group reviewed it on July 4 and authorized having a printer run 200 copies over for John Hancock’s signature.

In short: July 4, 1776, is the date of the most important press release in American history. Grab some skyrockets!

Adams also slightly whiffed on his preference for the Great Seal of the United States. That’s the thing with the bald eagle, the “e pluribus unum” banner, thirteen arrows, and all. There was a vigorous debate, recounted lately in the Wall Street Journal about the appropriate creature to symbolize the new nation of its role in the universe. Some favored the white-tailed deer, elusive and resilient. Some (ahem, Benjamin Franklin) preferred the turkey, fearless and a native. Many were taken by the beaver, industrious and willing to push others to work. The eagle, a native bird symbolically holding the olive branch of peace with one set of talons and the arrows of war with the other, prevailed.

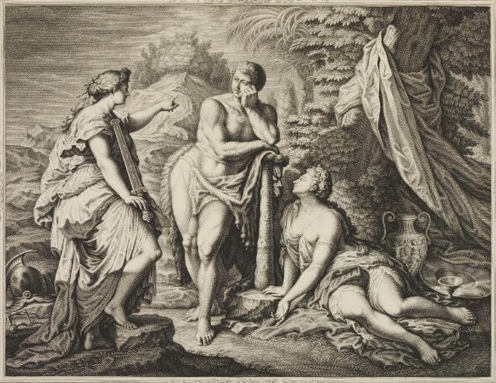
Then a few, like Adams, appear to have slept through their “Introduction to Visual Design” lectures and came up with an intricate allegorical soup:

Hercules, as engraved by Gribelein, in some editions of Lord Shaftebury’s works. The hero resting on his club. Virtue pointing to the rugged mountains on one hand, and persuading him to ascend.

Lin-Manuel Miranda wasn’t much more charitable to Adams, in Hamilton. On the upside, he was the hero of 1776, the Hamilton of its day, which followed Adams’s fight to get the Continental Congress to pass an actual Declaration of Independence. As president, he championed a strong central government that was, in our terms, moderate and bipartisan.

He and Thomas Jefferson were fierce political opponents, brilliant and passionate. Their friendship grew in the years following Jefferson’s presidency. And they both died on July 4, 1826: the 50th anniversary of the release of the world’s most important press release. His last words were, “Thomas Jefferson still survives.”

Welcome to summer

Annually we have a “days of summer” issue that celebrates … well, beach weather, holidays, gardens, families, travel, and recharging. We tend to target quick, light (or “lite”) and useful. Here’s the rundown:

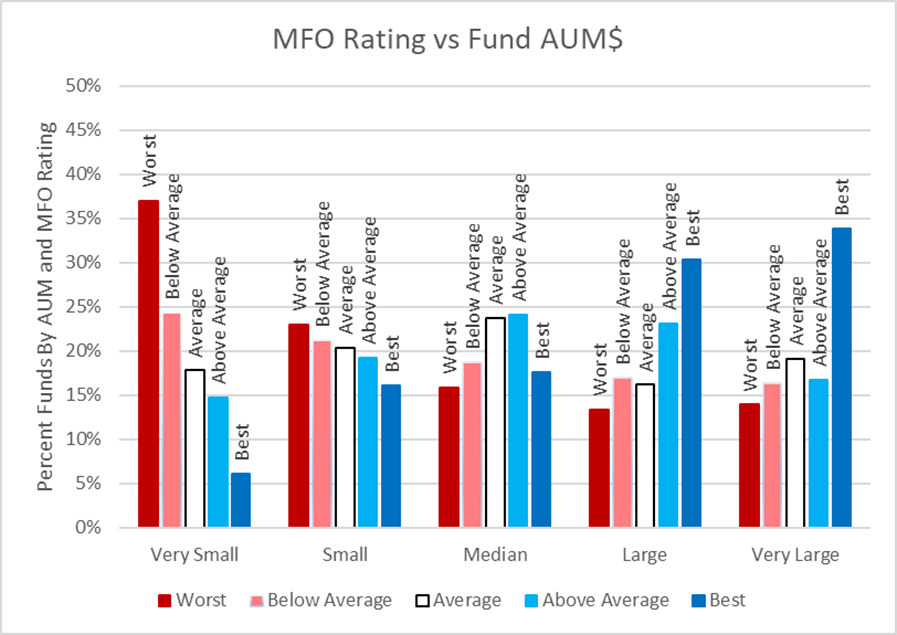
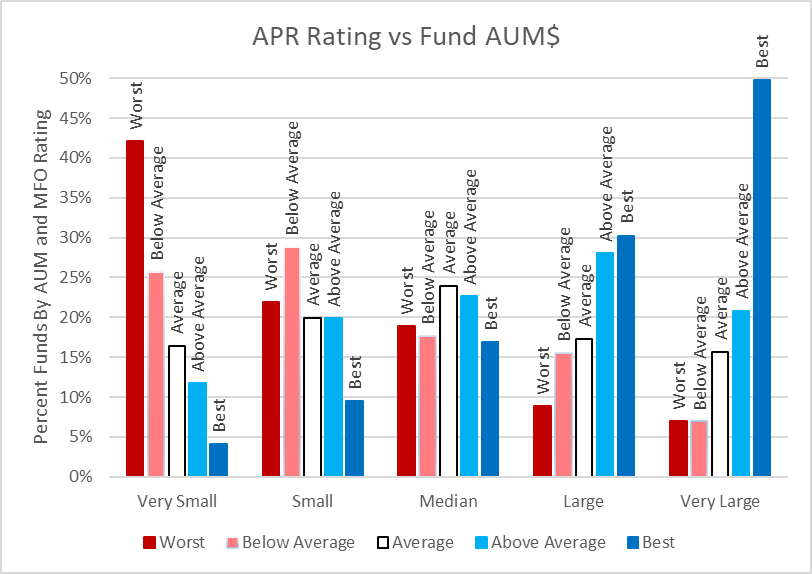
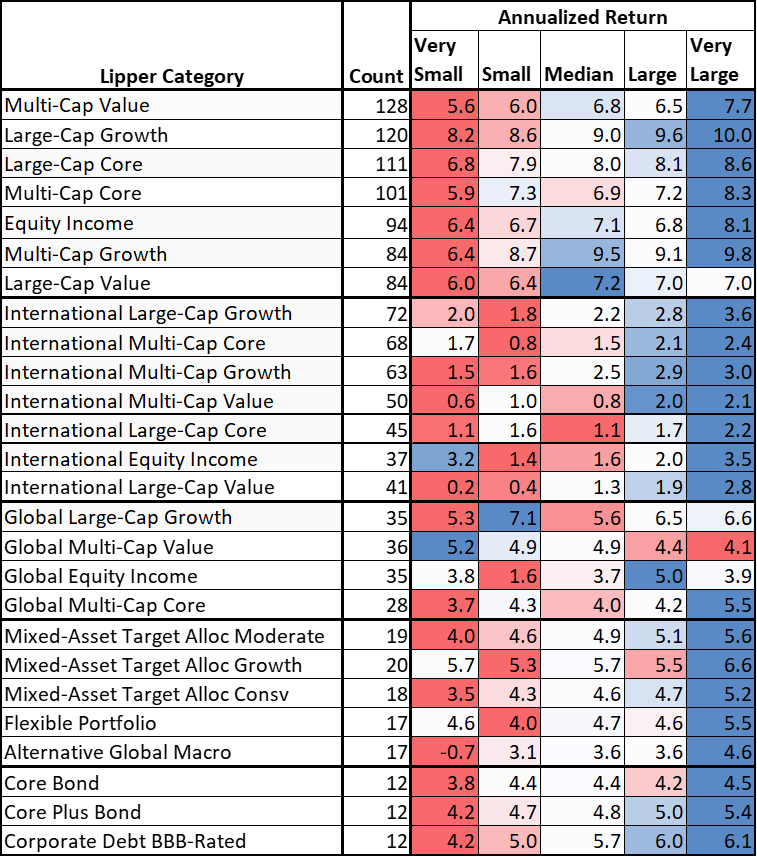
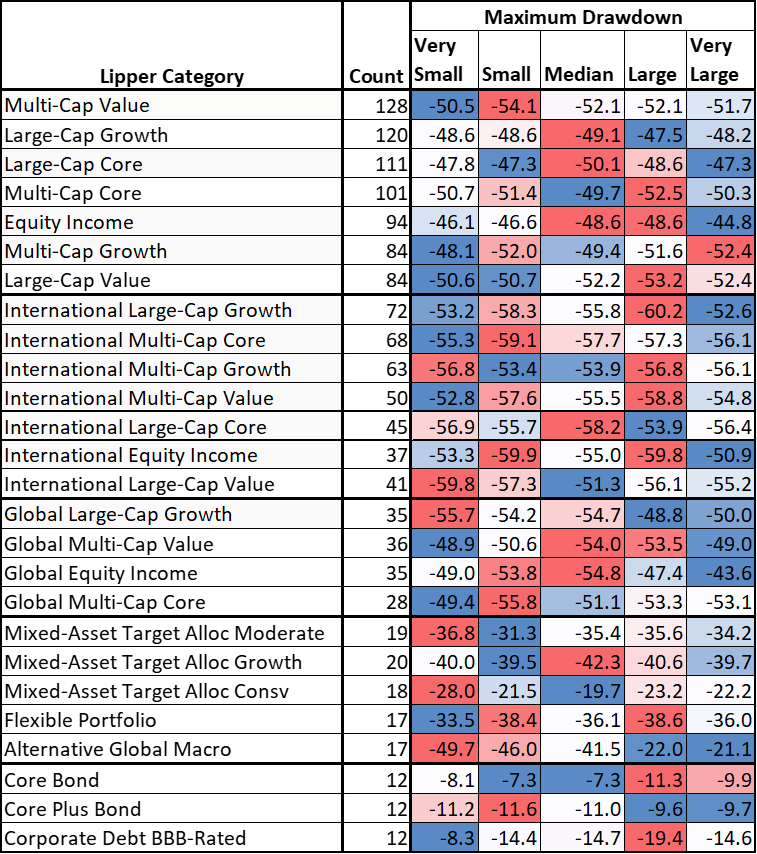
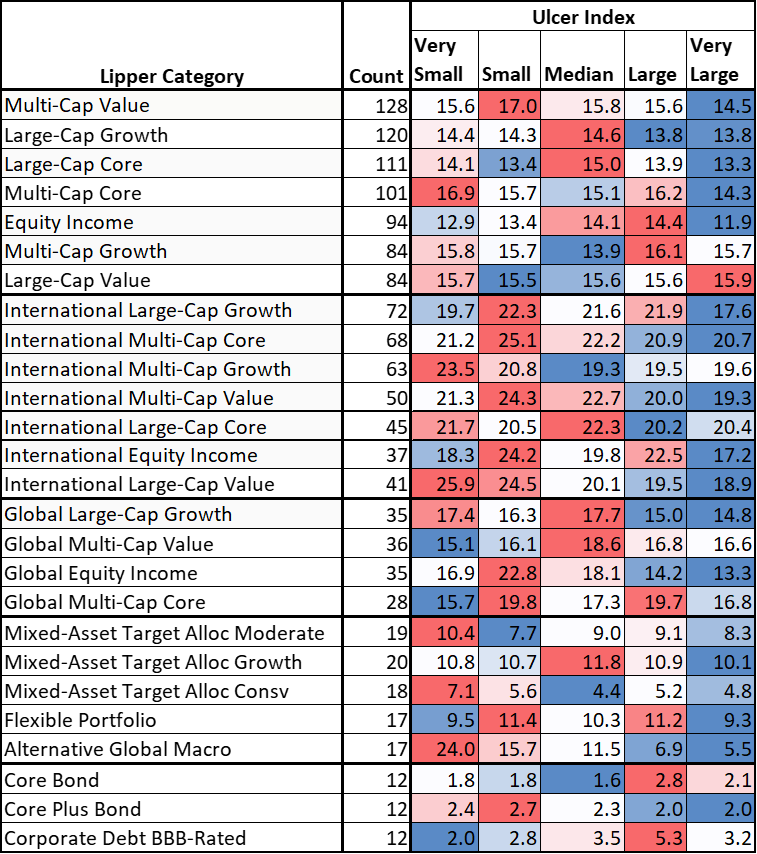
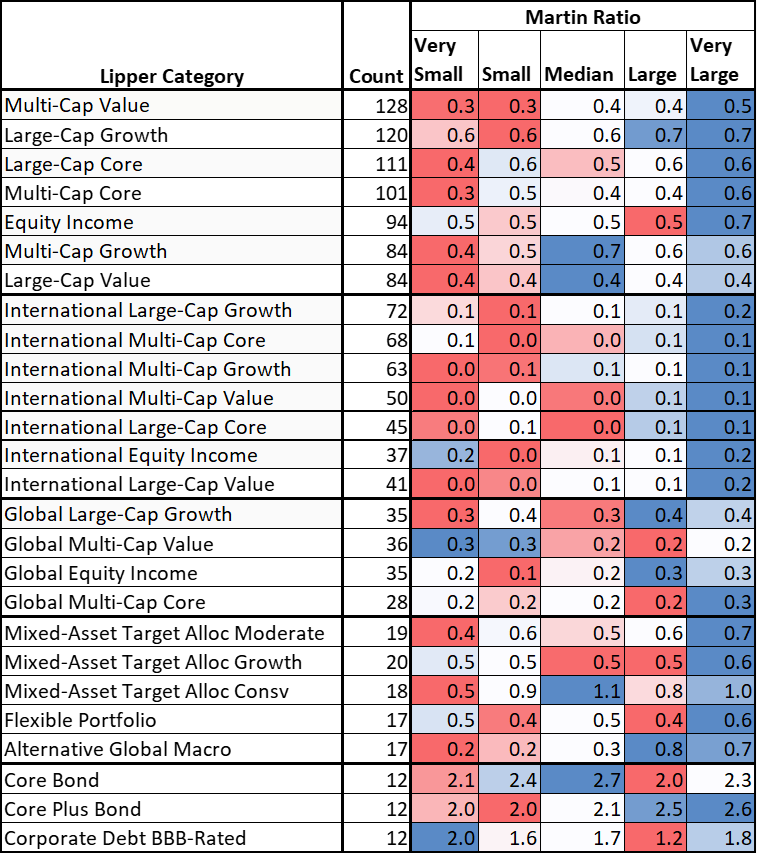
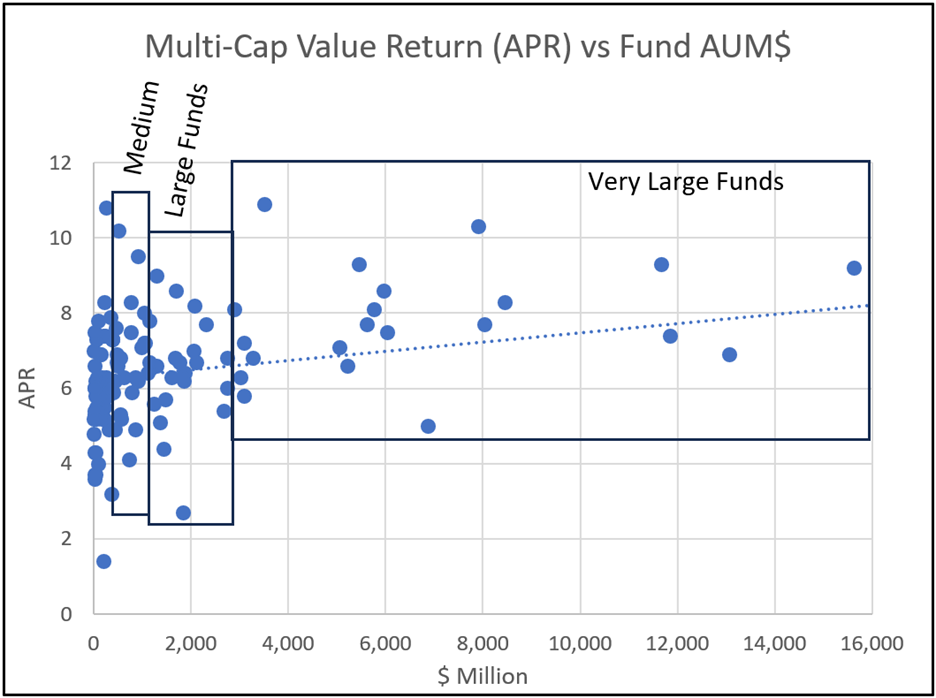
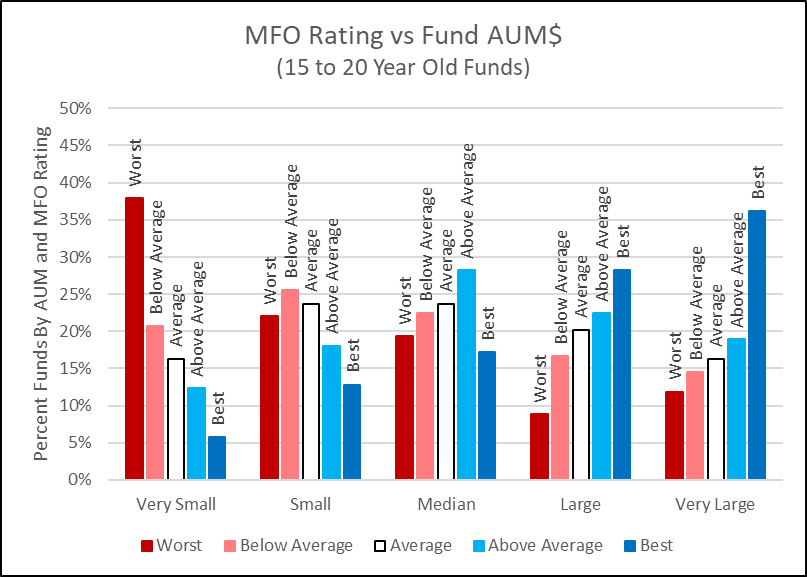
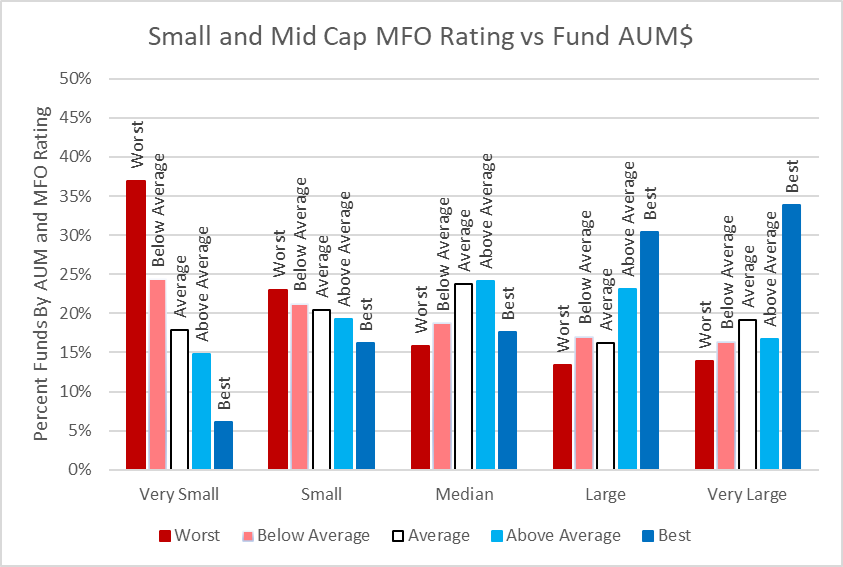
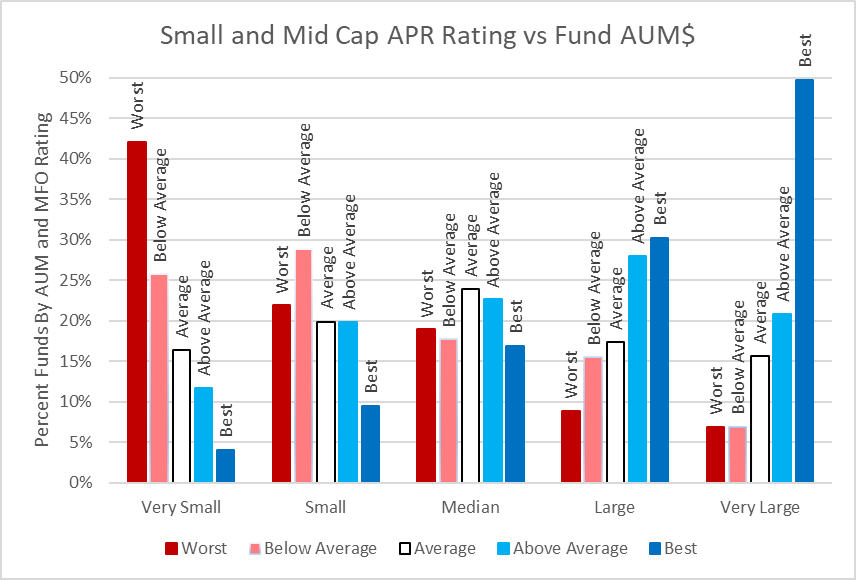
  1. Lynn looks at the ultimate cage match between Fidelity and Vanguard for world domination, or at least a prime position in your portfolio, and then goes on to look at whether you really should be investing in small and nimble funds. Spoiler alert: usually not, most big funds got big because they brought a systemic advantage to the table. Despite MFO’s focus on small, new and boutique, we don’t disagree with Lynn’s broad thesis. Most small funds are bad ideas, as are most big funds. The difference is that there are a lot more small funds to sort through.
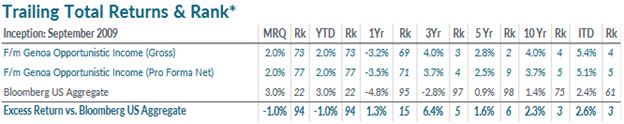
  2. Speaking of small funds, we’re trying a renewed “Funds in Registration” feature that focuses only on funds in the pipeline that might actually warrant your attention. This month we’re offered two and a half possibilities: Genoa Opportunistic Income ETF and Dynamic Alpha Macro Fund both of which bring really strong track records and stable teams. Genoa is working well in separate accounts and Dynamic Alpha Macro has a successful hedge fund as 50% of its portfolio. The half fund, the one just missing the case, is Polar Global Growth ETF which is the ETF version of an existing fund. The caveat is that the fund has a great long-term record and a really soft short- and medium-term one, which we’d need to understand thoroughly.
  3. Charles Boccadoro, the incomparable maestro of MFO Premium, cranks up the screener to test out – and tease out – the New York Times’ recent comment regarding the “longest bear market since the 1940s.” For folks who thrive on face-to-face connection, Charles will always be offering a live mid-month online discussion.
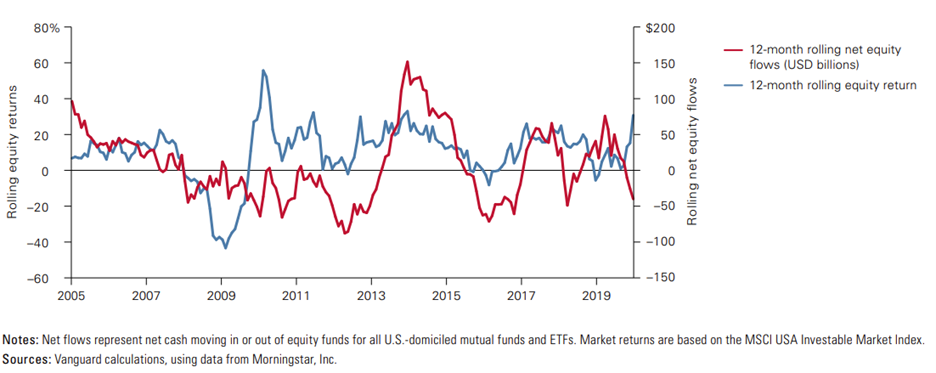
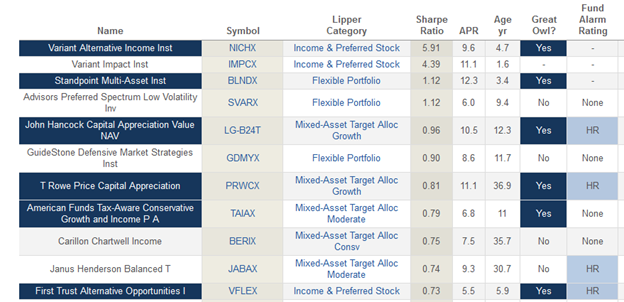
  4. In the military “fire and forget” refers to a weapon that can be launched but doesn’t need to be monitored after that. Investors have their own version of fire-and-forget: they often fire a manager because of a problem, and then forget to check back once the problem’s resolved.

Ten things I had been meaning to tell you

Sorry, leads pour in. In good faith, I stack them up next to the recyclables and the “healthier lifestyle” resolutions, then forget to share them with you. Here are ten things I’d been meaning to tell you.

1. Warren Buffett is investing in Japan.

Berkshire Hathaway doubles down on Japan. The conglomerate run by Warren Buffett disclosed yesterday that it has bought more shares in Japan’s five biggest trading firms and suggested that it may go further. Nikkei-listed stocks have outperformed the S&P 500 and most other large indexes this year, thanks to investor enthusiasm over Japan’s economic recovery.” (Andrew Ross Sorkin, “DealBook,” New York Times, 6/20/2023).

This aligns with David Sherman’s observation last month that Japan hosts some of the world’s best values. JP Morgan (5/2023) agrees.

Over the past five years, the best-performing Japanese funds have two distinctions: (1) they’re ETFs, and (2) they actively hedge their currency exposure.
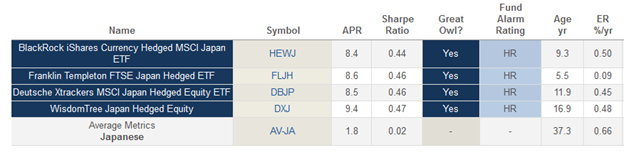
Source: MFO Premium

The “Great Owl” designation means that they’ve achieved top quintile risk-adjusted returns over all trailing periods, and the Fund Alarm Rating signals that they’ve beaten their peers for the past 1-, 3- and 5-year periods.

Morningstar’s preference as a fund for retail investors would likely be Fidelity Japan (FJPNX), which they give a “silver” rating, and which has earned four stars.  Its 2.9% annual returns over the last five years handily beat its peer group while badly trailing the hedged ETFs.

2. Ray Dalio thinks that India is the next great opportunity.

Mr. Dalio is the chief of Bridgewater Associates, the world’s largest hedge fund, and is generally considered to be one of the clearest and broadest thinkers around. He regularly frets in public about one threat or another (in June alone, he discussed war with China, a fraying world order, a currency collapse, a late-cycle debt bubble, and why he’s betting big on AI) but seems singularly supportive of the prospects of India as an investment market. Speaking of Prime Minister Narendra Modi, Mr. Dalio said, “He and India are in an analogous position to Deng Xiaoping and China in the early 1980s – i.e., at the brink of the fastest growth rates and biggest transformations in the world.” (George Glover, “Billionaire Ray Dalio hails India as the next big investing opportunity,” 6/23/2023). Mr. Glover’s article quotes Mark Mobius, the most famous of the emerging markets investors, as saying, “India is the real future.”

The opportunity set for small investors is less clear, in part because India, despite its huge population, has not always welcomed foreign investors. There are three pretty solid options, though.
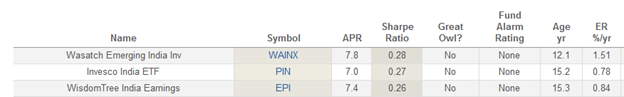
Source: MFO Premium

The two passive ETFs both track indexes that attempt to incorporate measures of corporate quality. The Wasatch Emerging India Fund targets “the highest-quality growth companies in India” and has a concentrated, large-cap, high-growth portfolio.

3.  Making their mark right out of the gate: the Tanking Ten

MFO’s target universe has always centered on funds that are off Morningstar’s radar. While Morningstar’s algorithms now express opinions on all funds, their analysts traditionally are working in a pool of a thousand or so of the 10,000 available.

Off the radar translates to smaller, newer, distinguished but offered by boutique or specialty managers. In recognition of that, MFO Premium has preset screens for newly launched funds. Here’s a quick glimpse at the worst and the best of them.

The worst-performing newbies are on pace for double-digit annualized losses, despite launching in a bull market. The easiest way to end up at the extremes of a spectrum is put big bets on narrow niches. So, for example, tripling the returns of the energy sector hasn’t been wise this year, nor at seeking 175% of the returns of Jack Ma’s Alibaba.

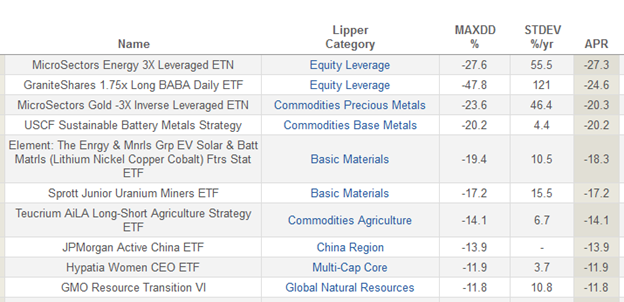
The same is true at the other extreme: big bets on this year’s winner translate to stunning returns. Two newbies are set to make over 200% a year by leveraged bets on the performance of Invidia and Meta (Facebook) stock.

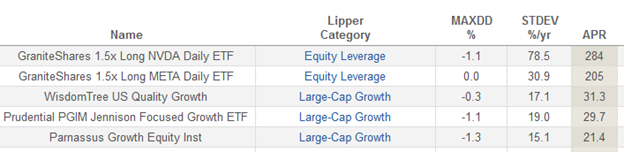
We would recommend reserving those sorts of bets for a casino.

4. GMO is freakishly cheerful

Institutional investor GMO, formerly Grantham, Mayo, Van Otterloo & Co., is a very disciplined bunch. They loathe overpriced investments and overpriced markets and relentlessly hunt out pockets of exceptional value. At their peak, they managed $140 billion in assets. Today, that’s closer to $60 billion. As markets got speculative, GMO refused to play along, and investors got irked and pulled their money. GMO sort of shrugged and reminded people that they were doing precisely what they’d promised to do when you chose them as your manager.

GMO monthly publishes asset class return forecasts which are driven by two simple assumptions: (1) profit margins tend to regress to their averages because high-profit niches attract competitors who steal your profits, and (2) stock valuations are, in the long term, driven by price and earnings. Based on those assumptions and lots of data, they project what a prudent investor might expect in the intermediate term.

For the past several years, before the 2022 panic, the answer was “pain and darkness.” Today, they’ve managed to reach “mostly positive returns outside the US, and pretty solid ones in international small caps and emerging markets.”

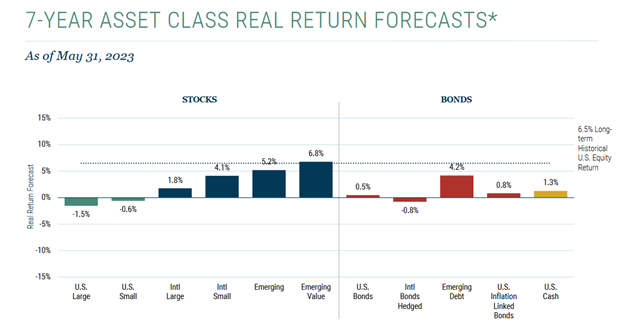
Our recommendations for people who want to explore the latter two are pretty unambiguous: Harbor International Small Cap and Seafarer Overseas Value, both of which we’ve profiled and both of which have exceptional teams.

5. No, it seems like no one can beat Vanguard

Our colleague Sam Lee explained “Why Vanguard Will Take Over the World?” in a 2015 article.

Vanguard is eating everything. It is the biggest fund company in the U.S., with over $3 trillion in assets under management as of June-end, and the second biggest asset manager in the world, after BlackRock. Size hasn’t hampered Vanguard’s growth. According to Morningstar, Vanguard took in an estimated $166 billion in U.S. ETF and mutual fund assets in the year-to-date ending in August, over three times the next closest company, BlackRock/iShares. Not only do I think Vanguard will eventually overtake BlackRock, it will eventually extend its lead to become by far the most dominant asset manager in the world.

He lays out four factors that drive their move toward global dominance.

Let’s do a quick status check on Sam’s prediction, eight years later.

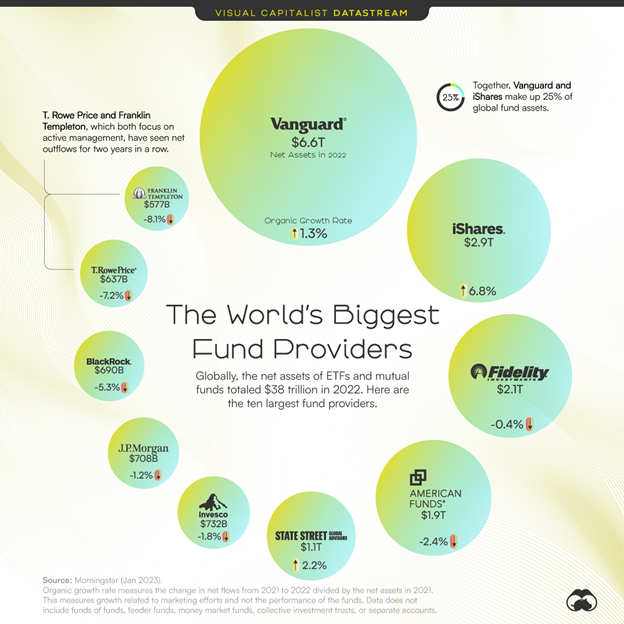
Source: Jenna Ross, Visual Capitalist, 6/19/2023

Just checking the math here but $6.6 appears greater than $2.9 + $2.1. That is, bigger than its top two competitors combined and inching up to being larger than its top three competitors combined since two of them are seeing declines.

Sam, for those of you who missed him, is brilliant and was a Morningstar editor at a ridiculously young age. He left Morningstar, as so many did, and launched his own firm. It was originally Severian Asset Management but transitioned to SVRN Asset Management. Founded in Chicago, he and a partner moved to Austin, Texas, where they oversee about $100 million for 18 high-net-worth clients. We archive all of our contributors’ essays, and Sam’s essays are about the best for their startling and careful insights. You should browse.

6. Doug Ramsey, Leuthold CIO, on investing in the markets ahead

Leuthold Group began life in 1981 as an institutional research firm with a singular obsession about letting data drive decisions; to make that work, they need vast amounts of data and a permanent willingness to challenge themselves and the way they’ve traditionally interpreted the numbers. They got good enough that their clients convinced them to launch an affiliated money management group, Leuthold Weeden Capital Management.

Since the retirement of founder Steve Leuthold, Doug Ramsey has held the reins as the firm’s chief investment officer and co-manager of their flagship Leuthold Core Investment Fund, which we profiled last month. In mid-June, Doug spent an hour online talking with investors have where the evidence points right now.

Highlights:

  • both yield curve inversions and six-month drops in the index of Leading Economic Indicators are pointing to a business downturn beginning in fall. Both are eight-for-eight with no false positives as predictors, though their “predictions” occur with “long and variable lags.” The window for a yield curve inversion has been four to 16 months previously. Others observe that Fed actions presage recession by about two years.
  • the last false signal from a yield curve inversion was in the mid-1960s. Doug talked a bit about the differences in economic conditions between then and now.
  • the stock market generally rallies immediately after a curve inversion, on average by 13%, before rolling over. Currently, it’s up 16%.
  • US inflation has dropped like a rock but “Fed policy has never been this tight with inflation having already come down significantly.”
  • the stock market is not in a bubble but in the top 10% of historic valuations.
  • seven to nine stocks have gone crazy, driving all of the year’s returns of the S&P 500. They’re the best candidates for a smackdown.
  • midcap valuations are good, small cap valuations are historically good. That judgment looks only at the valuations of the 80% of small caps that operate in the black, so “small quality” might be worth your attention.
  • the valuation of small caps relative to large caps is as extreme as in the late 1990s. Remember that the S&P 50 corrected by 50% in 2000-02. The S&P Equal Weight index and small caps vastly outperformed back then.
  • assuming 6% earnings growth and normal valuations as the base, large caps are priced for 3.5% returns in the medium term, mid-caps are 6-7% and small caps are at 8-9%. Foreign corporate earnings still have not returned to their 2007 levels which makes such calculations for EAFE and EM, given Leuthold’s discipline, impossible.
  • Leuthold Core Investment today is 51% net equities with no evidence that they’re going to drop toward their 30% minimum allocation; their investable universe looks like the S&P 1500 Equal Weight and that’s not looking nearly as risky as it did 18 months ago.

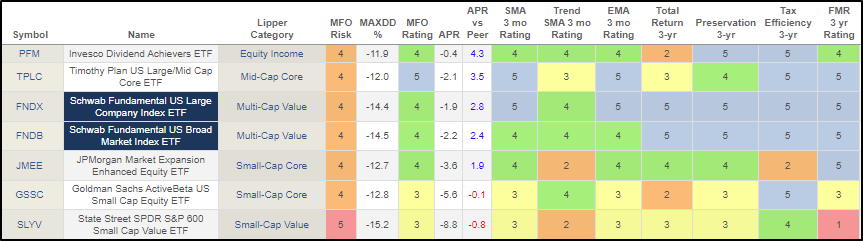
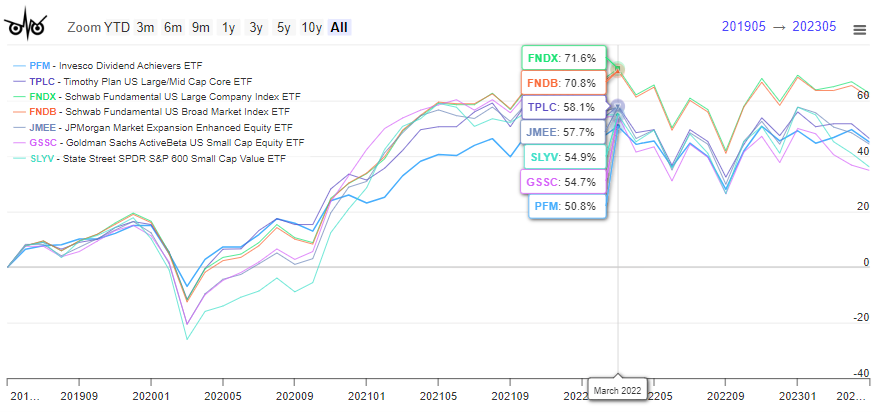
7. S&P 500 Equal Weight Indexes are intriguing

The performance of the S&P 500 Index is, and always had been, driven by the fate of a handful of megacap stocks. Year-to-date in 2023, the index is up 16.9% (through 6/30/2023). The median stock in the index, Merck, is up just 4% and more than 200 of its stocks are in the red. The level of concentration in the S&P 500 portfolio is higher now than it was at the peak of the late 1990s bubble. The index’s fundamental imperative is this: buy more of whatever has been doing well. Inevitably, structurally, growth and momentum drive the portfolio. Fame and low-cost access add to its appeal.

That said, there are long periods when “smaller and cheaper” offer more compelling possibilities. A host of professional investors, from Cohanzick’s David Sherman to Leuthold’s Doug Ramsey to Morningstar’s John Rekenthaler suggest that you might want to accelerate your due diligence on an equal-weight index. There are three reasons for this.

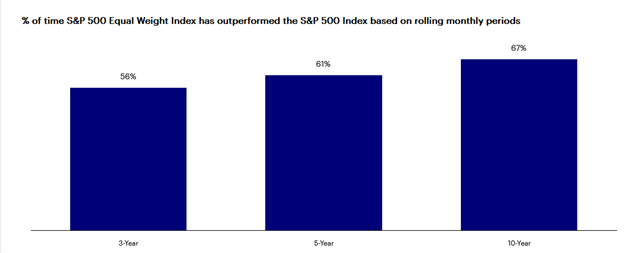
First, over periods of more than one year, the Equal Weight Index tends to outperform its more famous market-weight sibling.

Second, the equal weight index beats almost all actively managed funds over the long term.
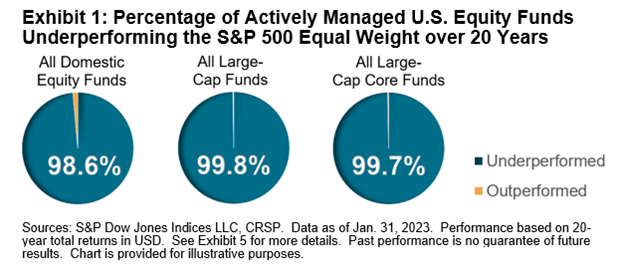
Third, the equal weight index buys low. It operates on the opposite dynamic of the S&P 500: it buys more shares of cheaper stocks and fewer shares of expensive ones. That is then reflected in a substantial discount in the portfolio.

Forward p/e: 15.3 for Equal Weight, 18.7 for Market Weight

Price/book ratio: 2.84 versus 3.81

Price/sales ratio: 1.53 versus 2.19

Price/cash flow ratio: 23.1 versus 26.8

If you are an advocate of low-cost passive investing but anxious about the domination of your portfolio by just five or six or seven stocks, there are several equal-weigh index funds to consider. The Big Dog is the Invesco S&P 500 Equal Weight ETF (RSP) which has seen $5 billion in net inflows in the past month. We would recommend a serious look at ONEFUND S&P 500 Equal Weight Index (ticker: INDEX, which is cute) which has minutely outperformed the ETF and its underlying index since inception. The key comes down to a superior trading strategy that takes advantage of price inefficiencies in the opening minutes of each day’s market.

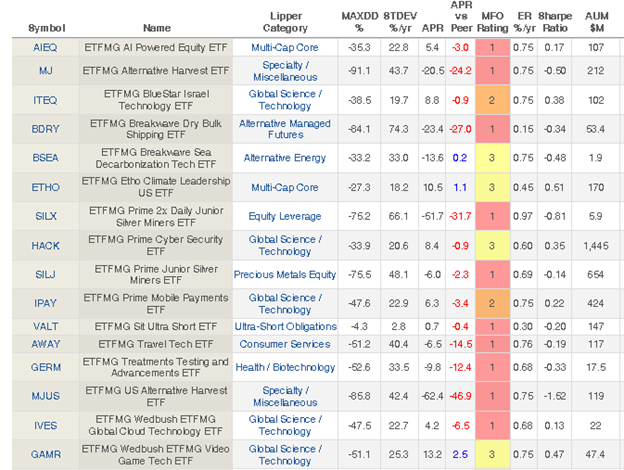
8. It might be time to renew the ETF Deathwatch

I was always slightly irked by the early champions of ETFs who regularly rejoiced at the imminent demise of the mutual fund dinosaurs. Two things struck me: (1) mutual fund companies were huge, well-resourced, and predatory. If they found the ETF niche interesting, they’d simply eat it and everyone in it. And they have:  Moreover (2) investing is not an infinitely expanding universe. Treating it like it is – by launching dozens of speculative ETFs (the KPOP and Korean Entertainment ETF?) in the desperate belief that someone will get excited – was a recipe for failure. And, indeed, it is: 583 ETFs are at high risk of closure, a substantial fraction of the 3000 fund universe. The number of ETF closures are now approaching the number of launches. (Heather Bell, Dark Days May Be Looming for ETFs, 3/28/2023)

9. Harry Markowitz, in memoriam

Harry Markowitz (August 24, 1927 – June 22, 2023) died in a San Diego hospital at the age of 95. He was the most influential guy you never heard of. Dr. Markowitz received the 1989 John von Neumann Theory Prize and the 1990 Nobel Memorial Prize in Economic Sciences with Merton H. Miller and William F. Sharpe. In 1999, Pensions & Investments named him “man of the century.”

He was an interesting soul. His work laid the foundation for much of the modern finance industry. And yet he, himself, was not a finance guy and not particularly interested in the subject. He started out writing algorithms and running simulations. Financial markets were merely a rich source of interesting data with which to test the models. Harry started his critique of traditional finance practice by thinking about the behavior of bettors in a casino. “I’ll put it all on red 27” is a recipe for misery, so bettors spread their bets, trying to tilt the odds in their favor. Sometimes that pays off, sometimes it doesn’t. It’s hard to imagine, but until Markowitz, the received wisdom in investing was “find the market’s top couple stocks and put every penny there.” Markowitz knew that made no sense, and had the data to prove it. In being dubbed “the father of Modern Portfolio Theory,” we’re actually saying “the guy who proved the benefits of diversification.”

In 1968 Dr. Markowitz began to manage a successful hedge fund, Arbitrage Management Company, based on M.P.T., that is believed to have been the first to engage in computerized arbitrage trading. But he wasn’t wedded to it and I get the sense he didn’t stick around all that terribly long.

10. Thanks, as ever …

To Chip, for toiling away to publish this issue even when she’s on vacation with family (and especially since she’d rather be writing really tight data security protocols and reading trashy novels).

To Devesh, Lynn, and The Shadow for working so hard each month to help make others’ lives a bit more sane.

To Raychelle and Aahan, who you haven’t yet met but who are toiling under the hood to keep everything clear and current.

To the Weeks Family Charitable Fund, operating through a Fidelity Donor-Advised Fund, for a generous gift and kind thoughts.

To our faithful subscribers, Greg, William and the other William, Brian, David, Wilson, Doug, and the good folks at S&F Investments.

And to all of you who read our work: Takk! Tapadh leat gu mòrk! Grazie mille!

Which is a reminder that Chip and I will be vacationing in the Scottish Highlands when our August issue launches, with part of our time spent in Shetland – halfway between Scotland and Norway. We’ll send pictures!

As ever,

david's signature

Strong June Propels New Bull Market

By Charles Boccadoro

Despite pervasive skepticism based on: Russian invasion. China US tension. Inflation. Rising rates. Bank collapses. Default fears. The S&P 500 has been climbing generally for 9 months. Axios describes this year’s market as “climbing a wall of worry.”

A strong June of 6.6% return propelled the index to 26% over its October low, which qualifies the advance as a new bull market.

We’ll coin it The Great Normalization (TGN) Bull … the seventh bull market for S&P 500 since Vietnam War circa 1968 and tenth since The Great Depression circa 1930.

Granted. Value has lagged. But growth has soared. NASDAQ up nearly 40%. Berkshire Hathaway BRKA is up 27%. So is Japan (Nikkei). Rest of the world (ACIXUS) up 25%.

TGN Bear lasted just 9 months, inflicting drawdown pain of -24% through last September.

The table below summarizes full cycle performance since 1929:

The underwhelming full cycle returns may help explain the lack of enthusiasm for the new bull market. We remain 4% shy of getting back above water. But if history repeats, once the S&P climbs more than 20% above recent lows, it goes on to new all-time highs … may take a while, but it’s been happening for 100 years.

The table below provides a breakout of the bear and bull market components of the same cycles: 

A 8 June WSJ article mentions: “U.S. stocks rose Thursday, ending the S&P 500’s longest bear market since the 1940s and marking the start of a new bull run.”

That description had me a bit perplexed, along with a couple other long-time members of MFO Discussion Board.

I believe this declaration works if what’s being measured is the time between the minimum level of bear market (trough … greatest drawdown from previous peak) to time it takes to grow 20% from that minimum.

Using month ending (not daily) returns, it took 9 months … from October 2022 to June 2023 to accomplish. With the Tech Bubble, it took slightly less at 8 months. With Post WWII cycle in 1940’s, it took 23 months. (See Min-To-Bull in above table.)

So, interesting, but not really indicative of pain we all feel during a bear market. For example, in 1930’s it only took 2 months for S&P to gain 20% over its abyss of -83% in May 1932 … but the bear market, measured from last peak to trough took 33 months … and then another 151 months or 12.5 years to get back above water.

Certainly not how we measure length of bear market, which is the time from previous peak to trough.

Perhaps a better definition would be time the market enters bear territory (down 20% from previous peak) to time it climbs 20% above trough. (See Bear-To-Bull in above table.)

In any case, the bull and bear cycle declarations are only known in retrospect, ex post.

They become more credible historical markers if each cycle results in a new all-time high. We need another June-like gain for that to happen with the current cycle.

Fingers-crossed!

For reference, our series on market cycles for US equities, which includes methodology, is summarized here:

Updated MFO Ratings through June are crunching currently and should post to MFO Premium site on Sunday, 2 July.

Finally, please join us on Tuesday, 11 July for an MFO Premium Mid-Year Review webinar. Register here.

Battle of the Titans for Portfolio Management – Fidelity vs Vanguard

By Charles Lynn Bolin

Asset Manager Titans Fidelity and Vanguard have options for portfolio management that vary allocations across asset classes over time which include assessments of long-term market trends. Fidelity has the Business Cycle Approach while Vanguard has the time-varying-asset approach based on the Vanguard Capital Markets Model (VCMM). In this article, I briefly describe Tactical Asset Allocation (TAA), Business Cycles, and secular markets summarized in Figure #1. I then dive into Fidelity’s and Vanguard’s methodologies.

Figure #1: Fidelity Multi-Horizon Framework

Source: Multi-Horizon Framework, Fidelity Institutional

This article is divided into the following sections:

TACTICAL ASSET ALLOCATION

I set up the Fidelity ETF Screener to identify “bullish” funds that meet my criteria for investing. The basic criteria are: 1) Not Leveraged or Inverse, Net Assets over $100M, FactSet Rating (A, B, C), Morningstar (3 to 5 Star), Volume, Standard Deviation (<25), Beta (<1.5), and Price Performance. For Bullish Technical Event, I use: 1) Double Moving Average Cross Over, 2) 21-, 50-, and 200-Day Price Crosses Moving Average, and Triple Moving Average Crossover. For Oscillator Technical Events, I use: 1) Bollinger Bands, Moving Average Convergence Divergence (MACD), and Momentum. 

My Bullish ETF Screen usually identifies 25 to 75 funds that I might consider if they fit into my intermediate-term investment view. I often load the “bullish” funds into MFO MultiSearch to analyze them further. As of mid-June, Table #1 contains the Lipper Categories with the most “bullish” funds. Overwhelmingly, what is bullish are smaller funds, equity income, and emerging markets.

Table #1: My Fidelity Bullish ETF Screen Results

Lipper Category Count
Small-Cap Core 16
Emerging Markets 9
Multi-Cap Value 7
Small-Cap Growth 7
Equity Income 6
Mid-Cap Core 6
Small-Cap Value 6
Financial Services 4
Real Estate 4
Large-Cap Value 3

Source: Author Using Fidelity ETF Screens and MFO Premium database and screener

Lance Roberts at RIA Advice wrote “Sector Rotations Begin As Small And Mid-Cap Surge” in which he described the S&P500 as overbought and small-cap and mid-cap funds as having underperformed. Mr. Roberts makes the case that trends have shifted from the Technology, Discretionary, and Communications heavy S&P500 and may be trending toward small-size companies investing more in Energy, Financials, Materials, and Staples. His strategy is to remain underweight in stocks and overweight cash. He looks for pullbacks to make small moves to add more to cyclical stocks.

I loaded the most bullish funds from my Fidelity “Bullish ETF Screen” into MFO MultiSearch and further reduced the funds based on longer-term metrics and charts. Table #2 contains the funds that I like the most.

Table #2: Author’s Selected Bullish ETFs (One Year)

Source: Author Using MFO Premium database and screener

However, the MFO charts show that even the bullish funds are trending flat or down. It is best to wait for pullbacks to add to these risk assets.

Figure #2: Author’s Selected Bullish ETFs

Source: Author Using MFO Premium database and screener

BUSINESS CYCLE APPROACH

Alessio de Longis, Senior Portfolio Manager at Invesco Investment Solutions, wrote “Dynamic Asset Allocation Through the Business Cycle” in which he included Figure #3 showing the performance of stocks and bonds during stages of the business cycle. Stocks perform best during early and middle expansions while longer-duration quality bonds perform best during recessions. I view the Late Stage as an opportunity to tilt my portfolio from stocks to bonds.

Figure #3: Different Risk Premia Have Outperformed in Different Macro Regimes

Source: “Dynamic Asset Allocation Through the Business Cycle” by Alessio de Longis, Invesco Investment Solutions

I expanded upon this concept in the December 2019 MFO article, “Business Cycle Portfolio Strategy” with Table #3 describing how Lipper Categories perform during stages of the business cycle.

Table #3: Lipper Categories by Business Cycle Stage

Source: Author

I set up MFO MultiSearch “Searches” to identify funds doing well by business cycle stages using the Lipper Categories in the table above. I adjusted other search criteria focusing on returns during the early and middle stages, risk-adjusted returns in the Late Stage, preservation during a Recession, and short-term trends.

I am most interested in the current “Late Stage” of the business cycle, but also want to have an eye on the Recession which I believe will start in the second half of this year and “Early” stages in case I want to start transitioning some funds for a recovery. The searches each yield about a hundred funds. I reduced these to those contained in the following tables based upon metrics such as “Fund Flow”, “MFO Family Rating”, and Lipper Ratings, among others.

Table #4 contains funds identified in the “Late Stage” screen. In general, the funds are holding up relatively well, in particular Equity Income.

Table #4: Selected Late-Stage Funds Trending Up

Source: Author Using MFO Premium database and screener

Figure #4: Selected Late-Stage Funds Trending Up

Source: Author Using MFO Premium database and screener

Funds from the Recession screen are also doing well.

Table #5: Selected Funds for Recessions Trending Up

Source: Author Using MFO Premium database and screener

Figure #5: Selected Funds for Recessions Trending Up

Source: Author Using MFO Premium database and screener

Funds from the Early Expansion screen did poorly last year, but have started to recover. Those who want to buy the pullback or believe that the US economy will experience a soft landing may be interested in these funds.

Table #6: Selected Early Expansion-Stage Funds Trending Up

Source: Author Using MFO Premium database and screener

Figure #6: Selected Early Expansion-Stage Funds Trending Up

Source: Author Using MFO Premium database and screener

SECULAR MARKETS

Ed Easterling, founder of Crestmont Research, does an excellent job of describing secular markets based on valuations and inflation as shown in Figure #7. By his definition, we are still in a secular bear market. Extremely loose monetary policy has created bubbles. Valuations and inflation are both high which does not bode well for longer-term returns. Mr. Easterling says that secular bull markets are a time to sail (passive management), and secular bear markets are a time to row (active management).

Figure #7: Crestmont Research Secular Markets

Source: “Secular Stock Markets Explained” by Ed Easterling, Crestmont Research

Both Fidelity and Vanguard create views of how the markets will look over the next decade or two. I consider this to be important in setting up a strategic investing plan.

Vanguard was founded by John Bogle in 1975 based on the principle of low-cost funds and simplicity that performed extremely well during the secular bull market of the 1980s and 1990s. Mr. Bogle wrote Enough: True Measures of Money, Business, and Life in which he recognized that high valuations would impact future returns and he lowered his asset allocation to 35% stocks. Fast forward to 2014, and Vanguard publicly launched the Vanguard Capital Markets Model (VCMM) which it had been working on for six years. Vanguard began working on VCMM well over ten years prior to Mr. Bogle passing away in 2019. The current outlook for the next ten years from the Capital Markets Model is available here.

Fidelity Institutional wrote Capital Market Assumptions: A Comprehensive Global Approach for the Next 20 Years in which they describe how long-term Capital Market Assumptions (CMAs) can help “financial advisors position their clients to reach their long-term goals…”  Fidelity combines their long-term CMAs with their shorter-term business cycle research to “add value through active asset allocation”. Fidelity offers an abundance of timely information including Fidelity Viewpoints and their latest thinking on portfolio management.

BATTLE OF THE TITANS – FIDELITY vs VANGUARD

I am comfortable with the Business Cycle Approach, but the advantages of the Secular Market approach are that it looks at opportunities globally and for longer periods of time. Combining a business cycle approach with an overlay of secular markets is attractive. There are very few funds with long-term track records for varying allocations across asset classes that have reasonably high returns over the long term. These are mostly in the Flexible Portfolio and Alternative Global Macro Categories.

Each individual has different circumstances including financial literacy, risk tolerance, guaranteed income through pensions and annuities, level of savings, and goals. Enter portfolio management to customize assets to an investor’s needs (and bring in additional revenue for the manager).

I began using Fidelity Wealth Services recently to manage some longer-term portfolios. I elected to have a simple approach using mutual funds and exchange-traded funds. They make small changes to portfolios and explain why they are making them. I meet with the advisors twice a year.

I like diversifying across both Fidelity and Vanguard. I have talked with advisors from Vanguard twice during the past decade and elected not to use their advisory services. After writing this article, I feel better prepared on what to discuss when I talk to them again.

Vanguard Capital Markets Model (VCMM) and Time-Varying Approach

The purpose of Vanguard Capital Markets Model (VCMM) is to link Vanguard’s investment principles and development of realistic plans and is not intended to be a market timing or tactical asset allocation tool. Vanguard Global Capital Markets Model (2015) describes how “the asset return simulation model and how its forward-looking return projections can be applied in the portfolio construction process.” They describe the model as:

The VCMM uses historical macroeconomic and financial market data to dynamically model the return behaviour of asset classes. It includes variables such as yield curves, inflation and leading economic indicators. The model estimates the dynamic statistical relationship between risk factors and asset returns using historical data dating as far back as 1960. It then uses Monte-Carlo regression analysis to predict these relationships into the future.

Source: “Vanguard Global Capital Markets Model”, Vanguard, March 2015

Sophisticated Modeling and Forecasting describes how the Vanguard Capital Markets Model (VCMM), Vanguard Asset Allocation Model (VAAM), Vanguard Life-Cycle Model (VLCM), and Vanguard Financial Advice Model (VFAM) work together “which seek to optimize expected investor utilities including glide-path construction, point-in-time asset allocation, active/passive investment, and financial planning decisions.” The Capital Markets Model provides estimated performance of assets over the next ten years to the Vanguard Asset Allocation Model which optimizes the portfolio. The Financial Advice Model evaluates the strategies to recommend an optimal financial plan. Each month, Vanguard publishes their latest insights in their Portfolio Perspectives.

One approach of the Vanguard Asset Allocation Model (VAAM) is what Vanguard calls “time varying asset allocation”. They describe a 60% stock/40% bond portfolio that would have varied between 47% stock to 75% stocks over the 2020 to 2022 period. I built my Investment Model to have a target allocation of 50% stocks within a range of 35% to 65%. Vanguard cautions that their approach is not for everyone.

Fidelity Secular Capital Market Assumption and Business Cycle Approach

Fidelity has an Asset Allocation Research Team (AART) that “conducts economic, fundamental, and quantitative research to produce asset allocation recommendations for Fidelity’s portfolio managers and investment teams.” They describe Fidelity’s Business Cycle Approach to Asset Allocation. Additional information can be found in How to Invest Using The Business Cycle. Fidelity Institutional has the 2023 Second Quarter Market Update and the Second Quarter Business Cycle Update which I find very informative.

Closing Thoughts

There is plenty of information on the internet about investment management companies and their funds. There is little information about how their managed portfolios perform because they are so customizable. In order to get more information, an investor must call the companies. I choose to tread slowly.

I selected Fidelity Wealth Services to manage a portion of my assets a couple of years ago. I was not interested in using Vanguard advisory services until I learned about the Vanguard Asset Allocation Model (VAAM) and the time-varying approach. Now I want to know more, so I will call Vanguard and ask to talk to an advisor. I can envision a multi-strategy approach with Fidelity and Vanguard managing or advising me on portions of my portfolio and with me managing the remainder. Over time, I may choose to consolidate accounts.

Fire-and-Forget Gone Wrong: The Rise of GoodHaven Fund

By David Snowball

In the military realm, “fire and forget” designates a weapon that you don’t need to think about once it’s been launched. In investing, “fire and forget” could be used to describe several sorts of mistakes centering on our impulse to look away once we’ve made a decision. One of those mistakes is to buy a fund (presumably for a good reason) then sell it (presumably for a good reason) and then never re-examine your decision.

Managers – both corporate and fund – make mistakes. You can’t avoid it. They can’t. The best of them realize it, learn from it, correct it and return to doing fine work. It might be that the folks at GoodHaven warrant the “the best of them” tag. And, I suspect, they warrant resumed attention.

GoodHaven Fund (GOODX) was launched in April 2011 by Larry Pitkowsky and Keith Trauner, two former associates of the iconoclastic Bruce Berkowitz, who manages Fairholme Fund. During their time at Fairholme, the guys rose from research analysts to portfolio managers, CIOs, and vice presidents. In 2010 they left Fairholme and about 12 months later launched their own fund. The fund had two good years, then a long stretch of lean ones. The managers lamented “frustratingly modest gains” in their 2017 Annual Report. In each of 2013, 2014, 2015, and 2017, they trailed more than 97% of their peers.

In the year that followed, they took a long hard look in the mirror and concluded that it wasn’t working. They concluded that they had been undercutting their own success, and their investors, with a series of misjudgments.

They resolved to change and do better. Those changes rolled out in late 2020 and resulted in what manager Pitkowsky calls GoodHaven 2.0. The central differences come down to five changes.

Goodhaven 1.0 Goodhaven 2.0  
Two guys One guy Keith left the team, but not the firm. They concluded that their styles were not meshing so that the whole looked distressingly less than the sum of its parts.
Macro calls about the states of markets and the direction of rates and such informed the portfolio construction Fundamental analysis drives the portfolio The most evident difference is that the fund’s traditional double-digit cash stake was quickly and substantially reduced. The fund is now fully invested.
Emphasis on special situations that weren’t that terribly “special.” Emphasis on quality names in the portfolio with only the “occasional really special situation.” Mr. Pitkowsky believes that the 1.0 portfolio wasted too many resources on stocks “in the messy middle.” That is, stocks that were neither high-quality names nor “real” distressed securities.
Visually, the portfolio has sort of moved from being tube-shaped (1.0) to barbell-shaped (2.0).
Emphasis on statistical measures of value Emphasis on cheap for what you’re getting By centering on a desire for high quality rather than a desire for cheap, the portfolio names became better and the manager worked to make rational assessments of future prospects. He was willing to buy growth-y names when the price was right.
Cut your losses. “Don’t sell the flowers and water the weeds,” buy if the only change has been the stock’s price The fund has a low turnover ratio, about 17%, which reflects a commitment to hold through price corrections if the firm’s underlying prospects are unchanged. Mr. Pitkowsky allows, “Doing nothing is much, much harder than doing something.”

By Morningstar’s assessment, GoodHaven’s portfolio is characterized by dramatically higher quality names with higher growth prospects than its peers. That has corresponded with a period of dramatic outperformance in terms of total returns, downside management and risk-adjusted returns.

Comparison of 3-Year Performance (Since 202006)

  APR Max drawdown Downside deviation Ulcer Index Sharpe ratio Sortino ratio Martin ratio
GoodHaven 20.0% -17.8 9.8 6.5 1.07 1.90 2.85
Multi-Cap Value peer group 12.9 -17.9 10.3 5.9 0.65 1.13 2.16
S&P 500 12.9 -23.9 11.4 9.8 0.65 1.01 1.18

Its recent strength – including a return in the first half of 2023 – has driven it to top 10% returns in its Morningstar peer group over the past three years.

Bottom line: GoodHaven is living up to its early promise. Funds are beginning to trickle back in, though it’s down dramatically from its peak. It would be wise for investors interested in quality-at-a-good-price to add GoodHaven to their due diligence list.

Is Bigger Better?

By Charles Lynn Bolin

I have often heard that smaller funds are able to outperform larger ones because they can be nimbler. This article started as a search for the best performing “core” funds over the past fifteen years, but I started over several times as I challenged my own search criteria to select only large funds. My assumption was that success builds upon success and investors invest more in funds that are doing well. Funds that don’t perform well are closed or merged into other funds creating a “survivor bias”. Larger funds should reflect better performance over a given time period. It makes sense.

To investigate whether smaller or larger core funds outperform over time, I extracted all of the “actively managed” funds for twenty-six selected Lipper Categories for the full cycle time period from November 2007 through December 2019. I separated the approximately fourteen hundred funds into quintile groups of Assets Under Management (AUM) per Lipper Category. Surely smaller Small Cap and Mid Cap funds can outperform larger funds because they are nimbler? This afterthought is explored in the final section.

This article is divided into the following sections:

Definitions

The definitions for the metrics used in this article are:

  • Ulcer Index measures both the magnitude and duration of drawdowns in value. A fund with a high Ulcer Index means it has experienced deep or extended declines, or both. It is calculated as the square root of the mean of the squared percentage drawdowns in value.
  • The Martin Ratio measures the excess return relative to Treasury Bill using the Ulcer Index as the denominator. It is a measure of risk-adjusted return.
  • MFO Rank divides a fund’s performance based on Martin Ratio (risk-adjusted return) relative to other funds in the same investment category over the same evaluation period. Funds in the top 20 percentile (top quintile) are assigned a 5 for “Best,” while those in the bottom 20 percentile (bottom quintile) are assigned a 1 for “Worst.”
  • MFO “Great Owl” distinction is assigned to funds that have earned top performance rank for evaluation periods 3, 5, 10, and 20 years, as applicable.

MFO Rating versus Assets Under Management

Figure #1 shows the summary results of the MFO Rank for quintile groups of Assets Under Management by Lipper Category. The ratings of the Large and Very Large Funds are skewed to higher risk-adjusted performance while “Very Small” and “Small” funds are skewed to lower risk-adjusted performance.

Figure #1: MFO Rating vs Fund Assets Under Management (Full Cycle Nov 2007 to Dec 2019)

Source: Author Using MFO Premium database and screener

It became apparent that some funds can have high total returns and lower risk-adjusted returns as measured by the Martin Ratio. Figure #2 shows similar results for APR as was shown for risk-adjusted returns.

Figure #2: APR Rating vs Fund Assets Under Management (Full Cycle Nov 2007 to Dec 2019)

Source: Author Using MFO Premium database and screener

It appears that a fund’s relative size over a long-term period often reflects its performance. Vanguard illustrates how mutual fund cash flows follow performance in Figure #3.

Figure #3: Mutual Fund Cash Flows Often Follow Performance

Source: Vanguard’s Principles for Investing Success, corporate.vanguard.com

Performance Metrics by Size

Table #1 breaks Annualized Return down by Lipper Category and AUM. In general, the largest fund quintile within a Lipper Category has a one to three percent APR advantage over the smallest of funds within the same category.

Table #1: Annualized Return by Category and AUM (Full Cycle Nov 2007 to Dec 2019)

Source: Author Using MFO Premium database and screener

The table for Maximum Drawdown is less clear. Smaller funds often have better downside protection.

Table #2: Maximum Drawdown by Category and AUM (Full Cycle Nov 2007 to Dec 2019)

Source: Author Using MFO Premium database and screener

The Ulcer Index which includes the length of drawdown in addition to the depth does show a lower Ulcer Index for larger funds. Larger funds may recover faster from drawdowns than smaller funds.

Table #3: Ulcer Index by Category and AUM (Full Cycle Nov 2007 to Dec 2019)

Source: Author Using MFO Premium database and screener

With higher returns and lower Ulcer Index, it makes sense that the Martin Ratio (Risk Adjusted Return) is higher for larger actively managed funds.

Table #4: Matin Ratio by Category and AUM (Full Cycle Nov 2007 to Dec 2019)

Source: Author Using MFO Premium database and screener

I use the Multi-Cap Value Lipper Category to visually examine the ranges of return and AUM. Outlier high returns for the largest funds are excluded.

Figure #4: Multi-Cap Value Returns vs AUM (Full Cycle Nov 2007 to Dec 2019)

Source: Author Using MFO Premium database and screener

Competitive Advantage

Smaller funds that perform well may not grow into larger funds because of limited access to brokers, or being an institutional share class that is not available to retail investors. Some managers temporarily “close” funds to enhance long-term performance. Larger funds may have advantages such as economies of scale, larger pools of management talent, and research resources. Table #5 shows that expense ratios of the largest funds are about a half percentage point lower than the smallest funds which accounts for some of their outperformance.

Table #5: Expense Ratios vs AUM (Full Cycle Nov 2007 to Dec 2019)

Source: Author Using MFO Premium database and screener

Comparing Funds of Similar Age and AUM

I investigated whether the age of the fund had an impact on the outperformance of larger funds by narrowing the funds for the time period to those 15 to 20 years old. The purpose was to compare funds of a similar age. Figure #5 shows that over the same full cycle, the same pattern of outperformance in larger funds exists for funds with similar ages.

Figure #5: MFO Rating vs AUM for 15- to 20-Year-Old Funds (Full Cycle Nov 2007 to Dec 2019)

Source: Author Using MFO Premium database and screener

Great Owls by Size

Will fund performance drop off if the fund gets too large or management changes? I extracted all of the MFO Great Owl Funds for this time period to exclude those whose performance declined recently. I excluded funds that are not available at either Fidelity or Vanguard or have high minimum initial investments. “Second Class” refers to funds with a different share class that are available but the expenses are higher. I also filtered the list to exclude funds with low “Family” ratings and those whose performance have declined recently. Most of the Great Owls are larger funds, however, there are several smaller Great Owls available to individual investors. I reviewed the charts of the funds and narrowed the list to those that I favor. These are designated with the names shaded blue.

Table #6: Great Owls Core Funds (Full Cycle Nov 2007 to Dec 2019)

Source: Author Using MFO Premium database and screener

Selected Funds in Their Prime

I reviewed the charts of the Great Owls and selected one per Lipper Category as shown in Table #6 above. I described the Vanguard Tax-Managed Balanced Fund (VTMFX) in “Helping a Friend Get Started with Financial Planning” and the FMILX in “Fidelity Actively Managed New Millennium ETF (FMIL)”.

Figure #6: Author’s Selected Core Great Owl Funds

Source: Author Using MFO Premium database and screener

Small- and Mid-Cap Fund Performance by Size

Finally, I looked at small- and mid-cap funds to see if larger funds outperform. I extracted over three hundred actively managed funds in the small- and mid-cap core and growth categories and segregated them by AUM per Lipper Category. Indeed, larger funds in the Lipper Categories outperform as measured by MFO Rating (risk-adjusted return) and APR Rating (Annualized Return).

Figure #7: Small- and Mid-Cap MFO Rating vs Fund Assets Under Management

Source: Author Using MFO Premium database and screener

Figure #8: Small- and Mid-Cap APR Rating vs Fund Assets Under Management

Source: Author Using MFO Premium database and screener

Table #7: Great Owls Small- and Mid-Cap Funds (Full Cycle Nov 2007 to Dec 2019)

Source: Author Using MFO Premium database and screener

Figure #9: Small- and Mid-Cap Great Owl Core and Growth Funds

Source: Author Using MFO Premium database and screener

Closing Thoughts

While new funds that are smaller may outperform larger rivals due to new ideas, technology, or fresh management insights, over time if they continue to outperform, I expect them to grow to reflect this success. Keep in mind that in this article fund size is relative to peers in the same Lipper Category. I will continue to favor the larger “Great Owls”.

Having higher risk-adjusted returns often comes at the expense of having higher total returns. This article shows that is not always the case. The funds covered in this article have achieved both.

I greatly appreciate the work done by Charles Boccadoro to improve the MFO MultiScreen tool. Without it, I would not be able to shift through the universe of funds to find these great funds.

Funds worth watching for: Genoa Opportunistic Income ETF and Dynamic Alpha Macro Fund

By David Snowball

The Securities and Exchange Commission, by law, gets between 60 and 75 days to review proposed new funds before they can be offered for sale to the public. Each month we survey actively managed funds and ETFs in the pipeline. Summer is a slow time for new fund launches, with the pipeline filling up in November in anticipation of reaching the market by December 30.

Many new funds, like many existing funds, are bad ideas. (Really, you want an ETF that invests in a single AI stock?) Most will flounder in rightful obscurity. That said, each month brings some promising options that investors might choose to track.

Two, or perhaps two point five, to add to your radar:

Fund One: Genoa Opportunistic Income ETF

Genoa Opportunistic Income ETF (XFIX) will try to maximize total return, including both income and appreciation, by identifying undervalued and opportunistic sectors and securities in the U.S. fixed-income markets. The fund is actively managed and will charge 0.45%. The strategy is opportunistic and largely unconstrained – bonds, commercial paper, derivatives, preferred, and convertible shares are all fair game – except that it is capped at 20% non-investment grade and 20% muni bonds. It will be managed by Peter Baden, Chief Investment Officer of Genoa Asset Management, Justin Hennessy, and Marcin Zdunek of North Slope Capital.

In general, I would shy away from funds whose investment pitch comes down to “trust us.” That said, Messrs Baden and Hennessy also run the f/m Genoa Opportunistic Income strategy for private clients. As of their 3/31/2023 fact sheet, the strategy has steadily outperformed the aggregate bond market over extended periods.

The rank column is expressed as a percentile; over the past 10 years, it is in the top 10% of comparable separately managed accounts while year-to-date through 3/31 it is in the bottom 27%. Other data in the factsheet show five-year risk metrics that are broadly favorable to the broad bond markets.

Fund Two: Dynamic Alpha Macro Fund

The Dynamic Alpha Macro Fund (DYMAX) intends to pursue above-market returns. “Macro” refers to major macroeconomic themes such as growth rates, interest rates, and inflation that help shape the portfolio. Approximately 50% of the portfolio will be invested in domestic stocks (via ETFs which will be split 40% growth, 40% high div, and 20% “broad market”) and 50% in a futures trading strategy. That strategy, currently embodied in a hedge fund, will opportunistically target six asset classes: currencies, debt, equities, energy, metals, and agriculture. The strategy holds both long and short positions.

The fund’s expenses are high (2.39% Investor, 1.99% Institutional) but the Institutional class carries a prospectus minimum of $1,000.

The equity strategy will be managed primarily by Bradley Barrie and the futures strategy by David Johnson. Mr. Barrie has earned his CFP and ChFC credentials, is the founder of the fund’s adviser and, in 2017, founded Dynamic Alpha Group which assisted financial advisors with investment portfolio creation and management. Mr. Johnson manages the GCM hedge fund which, de facto, represents 50% of the portfolio. Mr. Johnson began his career at NASA as a systems engineer on the Space Shuttle program and worked for 22 years at Honeywell Space System as an engineer and manager. You might be surprised as to how many investment managers are trained in engineering, mathematics, or computer science rather than in traditional finance programs. Both managers are Star Trek fans and have met Captain Kirk personally.

I spoke with the team for the better part of an hour in June 2023. They make sensible arguments – that in investing, the whole can be greater than the sum of its parts if the parts are (a) separately attractive and (b) uncorrelated – and claim that Mr. Johnson’s hedge fund has a substantial and impressive performance record. They are working with two sets of compliance teams to figure out how much of that information they can share and with whom. It’s possible, for example, that they’ll be forbidden from sharing with poor unsophisticated “retail” investors but permitted to provide substantiation to sophisticated advisors and other professionals.

They have concluded that the hedge fund strategy on its own is likely “too spicy” for either the average retail investor or average advisor, but that the blend of the two strategies would be much more palatable. In the ideal world, they might aspire to produce – over reasonable time periods – something near or above the returns of the S&P 500 with 50% of the downside. They recognize the work of the Standpoint Multi-Asset Fund team, about whom we’ve written (Standpoint Multi-Asset Fund: Forcing Me to Reconsider, 2021), as representative of the potential of the blended strategy.

We’ll be interested to see what performance data they’re permitted by regulators to share.

While they understood the general marketing attractiveness of launching this strategy in an ETF wrapper, their strategy is not well fit to the disclosure and reporting requirements even of a semi-transparent ETF.

The fund’s expenses are high (2.39% Investor / 1.99% Institutional), which is typical of such strategies. What is not typical is that the Institutional class has a $1,000 minimum.

That makes the appeal of the Investor class a bit fuzzy to me, but we take wins where we can get them.

Almost making the cut: Polen Capital Global Growth ETF

Polen Capital Global Growth ETF (PCGG) will be the ETF version of the Polen Growth Growth Fund. It will be a non-diversified, actively-managed exchange-traded fund holding 25 to 40 large-cap stocks, including those in emerging markets. Same management team, and they integrate “material environmental, social, and governance (ESG) factors” into their evaluation of a company’s long-term financial sustainability.

Since its inception, the fund has sort of smoked the competition.

Comparison of Lifetime Performance (Since 201501)

  Annual returns Max Drawdown Standard deviation Downside deviation Ulcer
Index
Sharpe
Ratio
Polen Global Growth 10.4% -35.6 15.9 10.7 10.7 0.58
Global Large-Cap Growth Category Average 9.0 -35.5 17.3 11.5 11.3 0.46

Source: MFO Premium fund screener

There are two yellow flags that made me hesitate. First, the robo-Morningstar recently downgraded the fund’s rating from “neutral” to “negative.” I am skeptical of the robo-judgment but I also realize that it’s incorporating data points that might be material but might not yet be immediately apparent to me. Second, the fund’s three- and five-year record against its peers substantially lags its long-term record.

Polen generally is very, very solid. I’d be hopeful about the ETF and hopeful for the prospect of less-expensive access to the strategy. I say “hopeful” because ETFs are generally marketed on price, but the draft prospectus does not list an expense ratio yet.

Briefly Noted…

By TheShadow

Updates

Fido’s conversion

Fidelity converted its “disruptive” funds to ETFs. They are Fidelity Disruptive Automation (FBOT), Fidelity Disruptive Communications (FDCF), Fidelity Disruptive Finance (FDFF), Fidelity Disruptive Medicine (FMED), and Fidelity Disruptive Technology (FDTX). As a group, they are not terribly compelling. They began trading this week. 

Next up: the conversion of its six Enhanced Index funds into ETFs, likely in November 2023.

The Polar Plunge

According to CityWire, FPA, and Polar Capital have agreed to settle their reciprocal lawsuits over the failed transition of two FPA funds, rechristened Phaeacian Partners, to Polar. “Pursuant to the terms of the settlement agreement, Polar and First Pacific are each required to dismiss all claims against the other.” That settlement does not, however, resolve the conflict between Polar and manager Pierre Py – they claim that his decision to live in Switzerland rather than Los Angeles is to blame – nor does it bring Mr. Py and his team closer to returning as professional investors. That’s his stated intent and he is really good. We’ll keep watch.

T. Rowe tweaks

T Rowe Price is updating its target date funds lineup. Price offers three distinct sets of target-date funds:

Target funds, with names such as Target 2035.

Retirement funds, with names such as Retirement 2035.

Retirement Blend funds, with names such as Retirement Blend 2035.

All are funds-of-funds. Here are the key differences:

Retirement funds: relatively aggressive glide path, highly diversified portfolio, primarily actively managed funds. (Full disclosure: a large chunk of my retirement portfolio is invested in T. Rowe Price Retirement 2025.)

Retirement Blend funds: relatively aggressive glide path (the same as Retirement’s), diversified portfolio, a mix of active and passive funds.

Target funds: relatively less aggressive glide path, highly diversified portfolio, primarily actively managed funds.

We can use a single target date from each series to highlight the differences.

  Rating Equity E.R.
Target 2035 Four stars 70% 0.57%
Retirement 2035 Five stars 80% 0.59%
Blend 2035 Unrated 80% 0.41%

Two developments were just announced. First, Price is adding two hedge-like funds to the roster of funds that might be included. Those are T Rowe Price Dynamic Credit and T Rowe Price Hedged Equity. That highlights one of the attractions of the Price target date series. They are research-driven and incorporate lots of small slices of assets, including hedging assets, that most of their competitors cannot or will not duplicate. Second, in 2024, the Retirement I fund series is being folded into the Retirement series. The latter change is mostly an administrative matter that reflects changing regulations about fund share pricing. It should have no impact on investors.

Briefly Noted . . .

American Beacon AHL Multi-Alternatives Fund has filed a registration filing. The fund will execute two complementary strategies: a managed futures strategy and a target risk strategy. A target risk strategy asks, “In which assets can we now invest to get the highest return without exceeding our level of targeted risk”? In this case, the managers will try to invest opportunistically across equities, bonds, interest rates, corporate credit, and commodities which the goal of making as great a return as possible without subjecting investors to more than 10% annualized across any 12-month period. Expenses vary contingent upon each investment share class.

The merger of FlexShares International Quality Dividend Defensive Index Fund and FlexShares International Quality Dividend Index Fund has been suspended. The reason for the cancellation of the proposed reorganization is that, following the reconstitution of the underlying indexes of IQDE and IQDF, there was no longer sufficient overlap in the two portfolios to support a tax-free reorganization.

SMALL WINS FOR INVESTORS

Driehaus Micro Cap Growth Fund reopened to existing investors, provided you meet the stated conditions, on July 10. Eligible buyers: current fund shareholders, participants in retirement plans with the fund as an option, and advisers whose clients already have fund accounts. The roster of people eligible to open a new account is limited to Driehaus employees, investors who exchange shares of another Driehaus fund for shares of Micro-cap, and (don’t fully understand this one) advisors “whose clients have Fund accounts.”

The fund is rated five stars and it has pretty much smushed the competition since launch.

Comparison of Lifetime Performance (Since 201312)

Name Annual return Standard deviation Ulcer Index Sharpe Ratio Sortino Ratio Martin Ratio MFO Rating
Driehaus Micro Cap Growth 14.7% 24.8 14.8 0.55 0.86 0.92 5
Small-Cap Growth Category Average 7.4 19.5 12.1 0.33 0.49 0.57 1

It’s clearly a “returns story” much more than a “risk story,” but the returns have been pretty spectacular.

Columbia Small Cap Growth Fund is reopening to new investors on July 31, Morningstar rates the fund four stars. The fund last closed to new investors on June 1, 2021. It has a rocky three-year record but is rock-solid for all of the other time periods we track.  The fund launched in 1996 and its longest-tenured manager has been on board since 2006. The 10-year record seems broadly representative of its performance.

Comparison of 10-Year Performance (Since 201306)

  Annual return Standard deviation Ulcer Index Sharpe Ratio Sortino Ratio Martin Ratio MFO Rating
Columbia Small Cap Growth 10.8 21.7 15.9 0.45 0.69 0.62 2
Small-Cap Growth Category Average 8.8 19.2 11.8 0.41 0.61 0.71 1

As with Driehaus, whose performance is not directly comparable because it’s a much younger fund, the story here is about the magnitude of excess returns swamping the magnitude of excess risk (both are high), leading to really solid risk-adjusted returns.

CLOSINGS (and related inconveniences)

Nary a one!

OLD WINE, NEW BOTTLES

Abrdn is set to acquire four closed-end health-related funds from Tekla. Lest you think “closed-end funds, aren’t those like Studebakers?” we’ll note that the performance of the Tekla CEFs has been quite solid.

In case you’re thinking, “Wow! How did you get detailed information on closed-end funds so quickly,” you need to check out MFO Premium. It’s the only tool costing less than a car with also allows side-by-side comparisons of mutual funds, ETFs, and closed-end funds.

Ask: what multi-asset fund has the best risk-return tradeoff?

Bink:

Source: MFOPremium.com screener

Here’s a screen of all multi-asset funds, sorted by Sharpe ratio. You’ll notice that the first two are closed-end funds that are vastly outperforming the field, the third is a young fund that we’ve profiled, while #4 and 6 are T Rowe Price Cap App and a clone.

Amplify ETFs is acquiring the assets from ETF Managers Group, a thematic boutique of … idiosyncratic offerings. Here’s the performance of the funds since inception.

Source: MFOPremium.com screener

Perhaps the columns to focus on might be “APR versus peers” – the amount by which they lead or trail the average fund in their category – and “MFO Rating,” a quick snapshot of risk-adjusted returns where blue/5 cells are the very best (see any?) and red/1 cells are the very worst (ummm … 10?).

Brown Advisory Total Return Fund has been reorganized into the Brown Advisory Sustainable Bond Fund effective as of the close of business on June 23, 2023.

The Board of Trustees of FundX Investment Trust has approved converting FundX Flexible Income Fund and FundX Conservative Upgrader Fund into ETFs. There will be no change to each Fund’s investment objective, investment strategies, or portfolio management as a result of the reorganizations.

OFF TO THE DUSTBIN OF HISTORY

The AlphaMark Fund will be liquidated on or about July 31.

Delaware Ivy Funds is liquidating its Ivy Emerging Markets Local Currency Debt and International Small Cap Funds. The liquidations will occur on or about August 31, 2023.

Frontier MFG Select Infrastructure Fund will be liquidated on August 23.

Lazard Global Fixed Income Portfolio will be liquidated on or about July 31.