


 Matthew Kenigsberg, Vice President of Investment & Tax Solutions at Fidelity Investments, summarizes the benefits of managing the impact of taxes on investments well in “Are you invested in the right kind of accounts?”
“You can’t control market returns, and you can’t control tax law, but you can control how you use accounts that offer tax advantages—and good decisions about their use can add significantly to your bottom line…”
The article goes on to say that investors should have a strategy for the mix of investments they want to own based on goals, financial situation, risk tolerance, and investment horizon.
I read an earlier edition of Retire Secure!: A Guide To Getting The Most Out Of What You’ve Got by James Lange ten years ago and it made a big impact on my saving and investing. Mr. Lange is a CPA, tax attorney, and financial planner. First, I followed his advice and created a budget for my expected lifetime. It pointed out that when I planned to start drawing Social Security at age 70 and had to take Required Minimum Distributions (RMD) that I would be in a higher tax bracket than I expected. Secondly, I switched savings to a Roth 401(k) instead of Traditional 401(k) in order to have earnings grow without RMDs and for benefits of inheritance. The Secure Act has some benefits such as raising the age that RMDs take effect from 70 and a half to 72, but it also has some negatives such as requiring heirs to withdraw the assets from an inherited IRA over 10 years. This reduces the benefits of a Roth IRA or 401(k) over a traditional IRA but does not eliminate them.
Assessing Retirement Readiness
Fidelity has an excellent retirement planning tool, recommends saving 15 percent of your income annually, and to start saving as soon as you can. Their rule of thumb is to have 10 times your income saved by age 67. The median household income is around $55,000 which implies median retirement savings of $550,000 or higher by retirement age. A typical, general target is to save one million dollars or more.
As savers and investors, we have multiple and diverse goals in life which may include raising a family, saving for retirement, children’s education, paying down debt, buying a home and paying off the mortgage, and taking that vacation. What is apparent is that people have not saved enough for retirement. The personal savings rate now stands at over 7 percent and was last at 15 percent in 1975. Chart #1 shows that only 33 to 39 percent of people aged 50 to 70 have more than $250,000 saved in their retirement savings accounts. It is a sacrifice to save for retirement, but it can be done as suggested by “Yes, You Can Save $1 Million For Retirement With A $50,000 Salary—Here’s How.” (CNBC Make It)
Chart #1: Retirement Savings by Age
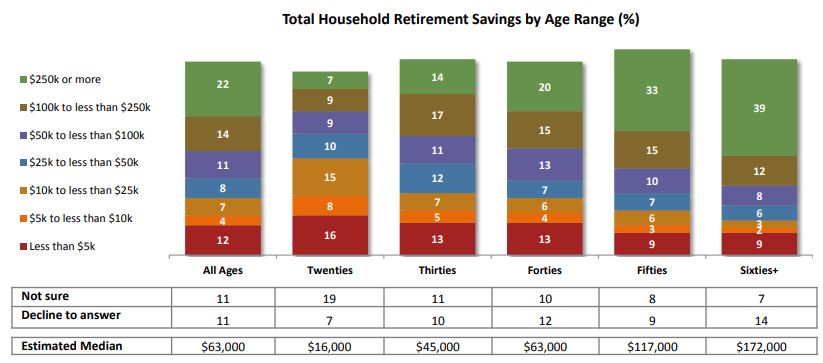
One point in the chart above is that the values are from retirement accounts which do not highlight the tax liability of the retirement accounts. A hundred thousand dollars in a Roth IRA has already had taxes paid, while the same amount in a Traditional IRA still owes the taxes when the funds are withdrawn. One question is whether your tax rates are higher now, or will be in the future.
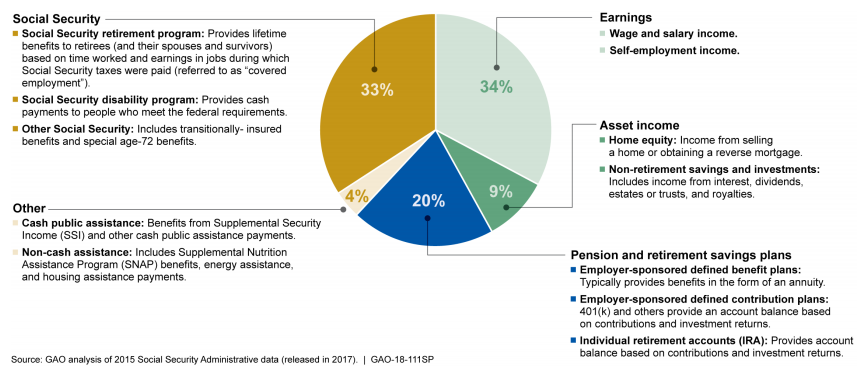
Chart #2 is from The Nation’s Retirement System by the U.S. Government Accountability Office. It shows that Social Security will provide a third of the income for retirees which is more than the 20 percent provided by pensions and retirement savings. People are working longer and a third of the income comes from employment after age 65.
Chart #2: Aggregate Income, by Source, for Households Age 65 or Older, 2015
Taxes and/or Inflation Will Be Higher
The taxes that we pay and inflation will be changing to some extent over the next 20 years. Take a look at the busy Chart #3 below. Coming out of World War II, taxes were high (red and blue areas) to pay down federal debt (solid black line). Inflation during the 1960s and 1970s played a major role in reducing federal debt as a percentage of gross domestic product. In the 1980s, federal debt began to rise due to lower corporate taxes (red area), rising social benefits (orange line), fighting two wars without raising taxes, and the stimulus to fight the 2009 financial crisis. The dashed black represents the top tax bracket.
Chart #3: Highest Tax Bracket, Federal Debt to GDP, Government Social Benefits to GDP

Sources: Created by the Author Based on St. Louis Federal Reserve & Tax Policy Center
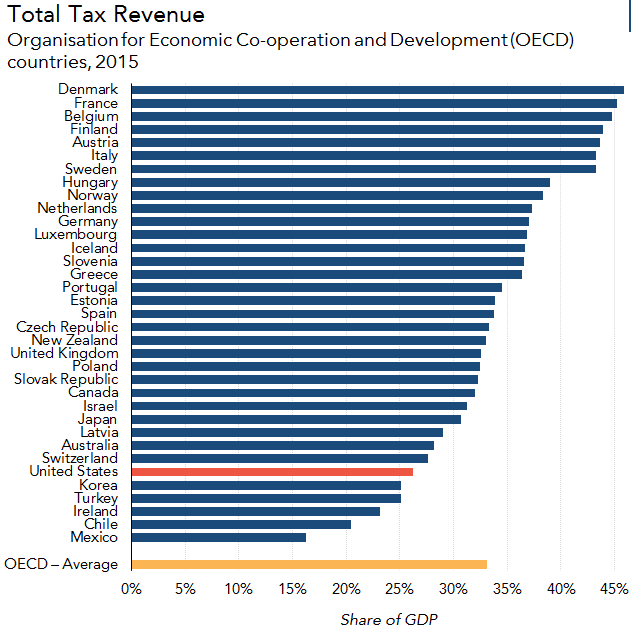
Direct comparisons of U.S. corporate rates to other developed countries is subjective because of complex laws and the diverse sources of income such as property taxes, payroll taxes, value-added taxes, and goods and services taxes (Wikipedia). According to the Tax Policy Center, U.S. taxes are low as a percent of other developed countries.
Chart #4: U.S. Taxes Compared to Other Countries
One can argue whether social benefits are too high or taxes are too low. There should be little doubt that large deficits are not sustainable.
Chart #5 shows the share of net worth held by the Top 1 percent of the population which owns nearly 33 percent of the net worth in the US. The top 10 percent own nearly 70 percent of the net worth and paid 69% (2016) of total income taxes. The bottom 50 percent own 2 percent. There are several explanations for this such as people nearing retirement own more than those starting their careers. Education levels play a large role in wealth accumulation. These metrics don’t include sales and other taxes which disproportionally are a higher percentage of disposable income for lower income people.
Chart #5: Share of Total Net Worth
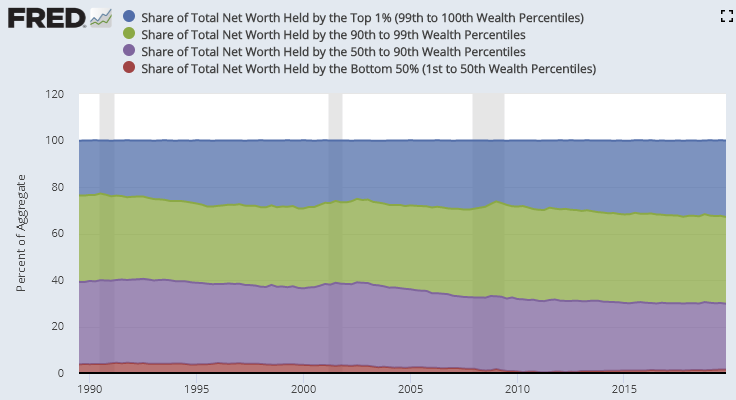
Source: St. Louis Federal Reserve (FRED)
My views are in alignment with Zach Gray in To Help Avoid a Tax Surprise, Diversify Your Retirement Accounts published in Kiplinger. One should take into the types of accounts when diversifying investments.
Current Taxes
Returns from stocks held for more than one year are classified as long term capital gains, which for most people are taxed at 15% as shown in Table #1. This is favorable compared to 22% to 37% for ordinary income. RMDs from Traditional IRAs and 401(k)s will be taxable income instead of at Capital Gains Rates. Conversions of Traditional IRAs to Roth IRAs may be beneficial during the window after retirement and before age 72 if income is lower. This reduces the amount subject to RMD’s at age 72 and may lower taxable income at age 72. Conversions to Roth IRAs may be taxable if they do not meet the five-year rule.
Table #1: Capital Gains Brackets
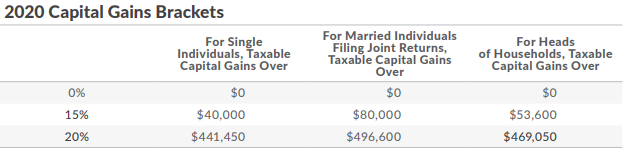
Source: Internal Revenue Service
Table #2: Tax Brackets
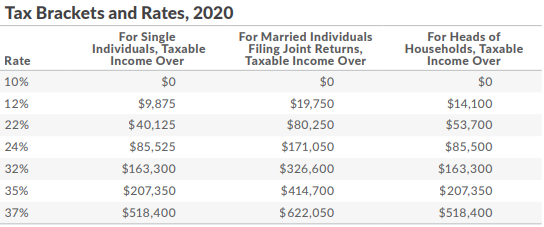
Source: Internal Revenue Service
The Net Investment Income Tax, sometimes called the Medicare surtax, is an additional 3.8% on investment income including interest, dividends, and realized capital gains for those whose MAGI is above thresholds such as those married filing jointly of $250,000.
Social Security and Medicare Taxes and Costs
Taxes
Up to 85% of Social Security benefits may be taxable when a couple files as individuals and the combined income is more than $34,000 or when filing jointly and the combined income is more than $44,000. Up to 50% for lesser amounts may be taxable for lesser incomes.
Medicare
The Social Security Administration uses the most recent tax return provided by the IRS to estimate your total adjusted income and tax-exempt interest income (M0dified Adjusted Gross Income, or MAGI). Monthly Medicare Premiums are shown for 2020 on an annualized basis for a couple based on their MAGI (an individual would be half the amount). Premiums are increased based on Income-Related Monthly Adjustment Amounts (IRMAA) in abrupt, cliff-like increments. Let’s say that due to a one-time event at retirement such as bonuses or rollover to a Roth IRA, your MAGI is $218,001. That extra $1 raises you and your spouse’s annual Medicare Part B premium $2085.20 and Part D by $463.40. The same jump occurs at $174,001, $272,001 and $326,001. Beware of the Cliffs!
You can adjust your premium later if your MAGI drops by contacting the SSA, and each year it is automatically recalculated based on the previous year’s Federal income tax information.
Table #3: Medicare Premiums
| Individual | Married Filing Jointly | Part B ($3470.40 plus IRMAA increase) (Annual per couple) |
Pres. Drug Plan Premium + (increase) |
| < $85,000 | < $174,000 | $3,470.40 | $0 |
| $87,000 to $109,000 | $174,000 to $218,000 | $4,857.60 | $292.60 |
| $109,000 to $136,00 | $218,000 to $272,000 | $6,942.80 | $756.00 |
| $136,000 to $163,000 | $272,000 to $326,000 | $9,024.00 | $1,216.80 |
| $163,000 to $500,000 | $326,000 to $750,000 | $11,104.80 | $1,680.00 |
| >= $500,000 | >= $750,000 | $11,798.40 | $1,833.60 |
Social Security as Insurance
One lesser-known aspect of Social Security is that in addition to retirement benefits, there are survivor benefits similar to insurance. Spouses (even ex-spouses) may qualify for half of the amount of the other spouse’s Social Security Benefits. Surviving spouses may apply for Social Security benefits upon the death of their loved one and receive the greater of their own Social Security benefits or 100 percent of his or her benefits. Delaying retirement increases these benefits to the surviving spouse.
There are that over six million state and local government employees are not covered by Social Security in their public-sector pensions. These public-sector employees that are subject to the Government Pension Offset have two-thirds of their pension deducted from their spouses. In some cases, spousal benefits may be low due to the two-thirds reductions. Delaying collecting social security until age 70 can increase survivor benefits significantly.
Individual Retirement Accounts
Traditional IRA vs Roth IRA.
The Traditional IRA and Roth IRA both have contribution limits of $6,000 in 2020 if you are under 50 years of age or $7,000 if you are over 50. However, the Roth IRA has a limit of maximum modified adjusted gross income of $193,000 if you are married filing jointly, but partial contributions are possible up to a MAGI of $203,000. Contributions are made to a Roth IRA after taxes and the earnings grow tax-free and no minimum distributions are required. Traditional IRAs are made pre-tax and taxes are deferred until age 72, under the new Secure Act, when required minimum distributions are required.
For those who defer drawing Social Security until age 70 and who must now take required minimum distributions at age 72, the additional income can put a person into a higher tax bracket and a higher Medicare bracket.
Traditional IRAs work well for someone who is expecting to have lower taxes in retirement. The average life expectancy of someone 65 years old is to live another 21 years so Roth IRAs are the gift that keeps on giving. If taxes go up or required minimum distributions push the investor into a higher tax bracket then a Roth IRA is probably a better option than a Traditional IRA. There are strategies suggested by Charles Schwab for avoiding higher income brackets such as taking withdrawals before age 72, converting to a Roth IRA, or making charitable distributions. They point out, “…Roth withdrawals aren’t subject to income tax, assuming you’ve held the account for at least five years.”
The window between retirement and required minimum distributions at age 72 can be ideal for a conversion from a Traditional IRA to a Roth IRA as described by Charles Schwab:
“A Roth IRA conversion can be especially advantageous during your initial years of retirement, when RMDs haven’t yet kicked in and you’re most likely to be in a lower tax bracket vis-à-vis your working years.”
Be careful to evaluate the impact of conversion to Roth IRAs on Medicare Premiums.
401(k) Plans
For employees working for a company, there are often 401(k) plans which have employee deferral limits of $19,500 in 2020. The 403(b) is often available to employees of public schools, colleges, universities, churches, and charitable entities and have employee deferral limits of $19,500 in 2020. Many 401(k) and 403(b) plans allow for employer contributions. For Business Owners with no employees, there are One-Participant 401(k) plans, and SEP, SIMPLE, and Qualified Plans for small businesses.
Backdoor Roth
A backdoor Roth is an informal name of a process for high-income earners to contribute more to a Roth IRA. According to Investopedia:
A backdoor Roth can be created by first contributing [after-tax dollars] to a traditional IRA and then immediately converting it to a Roth IRA (to avoid paying taxes on any earnings or having earnings that put you over the contribution limit).
Reducing Taxes
The following contains some useful sources of information on reducing taxes and my summary of the articles.
-
Listen to Advisers: CPA, Fidelity, Vanguard, Charles Schwab
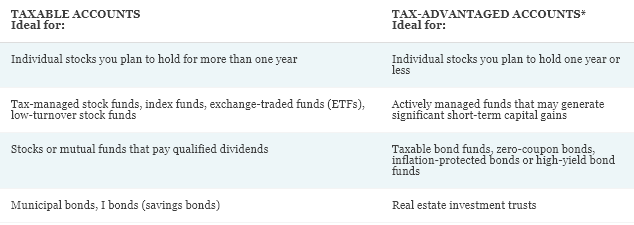
Understanding the impact of taxes is a special skill set that investors may not possess. I suggest using an advisor in addition to research through brokerages such as the table from Charles Schwab below:
Table #4: Optimal Invests for Taxable and Tax-Advantaged Accounts
-
Kiplinger identifies show shortfalls of many investors saving for retirement and recommends diversifying across accounts that taxed differently.
-
Owning Tax Efficient Funds in Taxable Accounts
Bogleheads looks at the tax efficiency of investments and which types of accounts they should be placed in.
-
Invest in Tax-Advantaged Accounts
WealthFit provides a list of types of tax-advantaged accounts.
-
Reducing Adjusted Gross Income Own a home, HSA, Energy Efficient Home Improvements
The Balance provides a list of ways to reduce your adjusted gross income which can reduce taxes.
-
Municipal Bonds and Treasury Bonds
Investopedia has some tips on being tax efficient such as investing in municipal and treasury bonds.
Tax Efficient Funds
Morningstar has a 3 Year Tax Cost Ratio which they define as:
“This represents the percentage-point reduction in an annualized return that results from income taxes. The calculation assumes investors pay the maximum federal rate on capital gains and ordinary income. For example, if a fund made short-term capital-gains and income distributions that averaged 10% of its NAV over the past three years, an investor in the 35% tax bracket would have a tax cost ratio of 3.5 percentage points. (The 35% tax rate was used for illustrative purposes because, according to current tax law, the maximum income-tax rate will fall to that level. However, our tax-cost calculation uses the maximum income-tax rate that applied during the year in which the distribution was made.)”
Below are two tax-advantaged funds that I track. The Morningstar Tax Cost Ratio is 0.58 for VTMFX and 0.45 for VTCLX. These would be suitable for many taxable accounts. VTMFX also has a low Ulcer Index which measures the depth and length of drawdowns.
Table #5: Tax-Efficient Funds
| Fund | Symbol | APR | MAX DD% | Ulcer Index | Martin Ratio | MFO Risk | MFO Rating | Yield |
| Vanguard Tax-Managed Balanced | VTMFX | 2.5 | -11.1 | 2.9 | 0.2 | 3 | 5 | 2.25 |
| Vanguard Tax-Managed Capital Appr | VTCLX | 0.2 | -20.1 | 5.9 | -0.3 | 4 | 4 | 1.96 |
Model Portfolios
I created three model portfolios that I am following with my accounts as described in Developing a Low-Risk Vanguard Portfolio for This High-Risk Environment and Developing a Low-Risk Fidelity Portfolio for This High-Risk Environment. Tracking the performance over time depends upon dividends, rebalancing strategy, and changes. I use Morningstar Portfolios for this purpose. The tax efficiency of these funds is shown in the table. I have these in tax-advantaged accounts. This month, I sold First Trust Preferred Sec & Inc (FPE) in the Fidelity Conservative Portfolio and iShares Global Utilities ETF (JXI) in the Fidelity Moderate Portfolio during this rally to reduce risk in my model portfolios. Most of my short term funds are external to these portfolios.
An investor should understand what he is buying. I am reminded of this each time I buy something that I thought I understood before it went sour. That is why I put a small account in the Schwab Intelligent Investor (Robo-Adviser Service) shown in Tables #7 and 8. My target fund to outperform during the late stage of the business cycle and recessions is the Vanguard Wellesley Income Fund (VWIAX). The three model portfolios that I follow have done as well or better than VWIAX year to date. The Schwab Intelligent Portfolio has done worse for this short time period than the model portfolios largely because of higher exposure to small cap stocks. Fidelity has tax-managed accounts that I have not covered in this article because I don’t understand the strategy or if the benefits outweigh the extra account costs. I will continue to research these options.
Table #6: Morningstar Portfolio (April 24)
| Portfolio | YTD | Tax Cost Ratio | Cash | U.S. Stocks | Foreign Stock | Bonds | Other |
| BarCap US Agg Bond | 5.0 | 1.10 | |||||
| Vanguard Conservative | -3.2 | 0.96 | 3 | 17 | 12 | 62 | 6 |
| Fidelity Conservative | -3.0 | 0.96 | 2 | 16 | 15 | 59 | 9 |
| Fidelity Moderate | -3.3 | 0.93 | 9 | 20 | 20 | 41 | 10 |
| S&P 500 (SPY) | -11.7 | 0.70 |
I use Mutual Fund Observer to identify lower risk funds with higher risk-adjusted returns to include in model portfolios. The metrics are for the past two years except for the year to date performance. They are based on the target allocations prior to selling FPE and JXI.
Table #7: Mutual Fund Observer Target Portfolio (March 31st)
| Portfolio | YTD | APR | MFO Risk | Ulcer | MaxDD | Martin Ratio |
| Vanguard Conservative | -6.8 | 2.4 | 2 | 1.8 | -7.7 | 0.24 |
| Fidelity Conservative | -5.9 | 3.3 | 2 | 1.8 | -7.1 | 0.77 |
| Fidelity Moderate | -7.4 | 3.7 | 2 | 2.2 | -9.0 | 0.79 |
| Schwab Intelligent Portfolio | -9.4 | -0.8 | 2 | 2.5 | -9.7 | -1.1 |
| S&P 500 | -19.5 | 0.9 | 4 | 5.8 | -19.5 | -0.18 |
I use Portfolio Visualizer for visualization and a double check as shown in Table #8. “Other” often includes real estate and commodities. For anyone interest more in these model portfolios, here is the link.
Table #8: Portfolio Visualizer Adjusted Portfolio (March 31st)
| Portfolio | Return | Sortino Ratio | Cash | US Stocks | Foreign Stocks | US Bonds | Foreign Bonds | Other |
| Vanguard Conservative | -6.9% | -2.3 | 3.3 | 18.1 | 13.5 | 43.1 | 18.4 | 5.7 |
| Fidelity Conservative | -6.2% | -2.2 | 3.6 | 16.3 | 17.3 | 45.2 | 9.4 | 8.3 |
| Fidelity Moderate | -7.6% | -2.1 | 11.4 | 20.4 | 21.8 | 32.7 | 4.2 | 9.5 |
| Schwab Intelligent Portfolio | -9.6% | -2.7 | 2.9 | 19.8 | 17.1 | 49 | 8.7 | 2.5 |
| Vanguard Wellesley Income | -7.4% | -2.3 |
Closing
The information contained in this article is research that I have done for personal finances and I do meet with a financial planner at least once a year. We are at the beginning of a recession which typically lasts one or two years. There are many unknowns such as COVID-19 and the massive stimulus. I believe that we are experiencing a bear market rally and there will be better times to add riskier assets to portfolios over the next year or two. I remain cautious at this time.
The picture of the hawk was taken outside my backdoor as the couple decides if they want to build a nest in the tree and raise their chicks. Several years ago we were able to enjoy the young hawks being raised and trained to hunt.
I wish you a safe and healthy 2020.