Monthly Archives: February 2024

February 2024

By David Snowball

Dear friends,

February is a fraught month, historically. For Romans, it once did not exist. And then it did, as the last month of the year, with the new year beginning when the crops were first sewn and all eyes looked to the future. Februalia, the festival of purification, was the last chance to put the misdeeds of the past behind us and to be prepared to build a future upon a solid foundation.

It’s also the month in which Augustana launches its Spring semester; as I ponder the snow piles on campus, I could imagine a more vernal moment for the start.

In the Chinese lunisolar calendar, 2024 is the Year of the Dragon with New Year’s celebrated on February 10. The Dragon is the only mythic being in the Chinese calendar. It is the most propitious of all years. Brilliant, relentless, and bold, they follow the Year of the Rabbit. Timidity, doubt, and hesitation are supplanted by growth and good fortune. 

But 2024 is not represented by just any Dragon. The heavenly branch is for the Wood Dragon, a symbol of the Imperium. Of all its kindred, the Wood Dragon alone thrives on humility. Generous and compassionate, honorable and loyal, they do not wield that vast power as dictators. Power flows from them, a gift freely given to the wise. Good people are drawn to the Wood Dragon, not quite knowing why but sensing the aura of health and hope that surrounds them. 

And so, we’ll offer a word or two on purification (of my portfolio, at the least) and another few on optimism and generosity.

In this month’s Observer …

Lynn Bolin takes on the conventional wisdom, fed by 2023’s unconventional market, that the 60/40 portfolio is a relic of the past. In a distinctive essay, he steps back to think about the appeal of “The Patriotic Millionaires.” They’re a group of 200 or so high net-worth individuals who have committed unusual acts of patriotism: “raising the minimum wage, combatting the influence of big money in politics, and advancing a progressive tax structure.”

I share three pieces for your delectation:

In celebration of the National Football League’s annual player awards, MFO recognizes the Offensive Player and Rookie of the Year, the Defensive Player and Rookie, the Comeback Player, and the Most Valuable Player in the fund world.

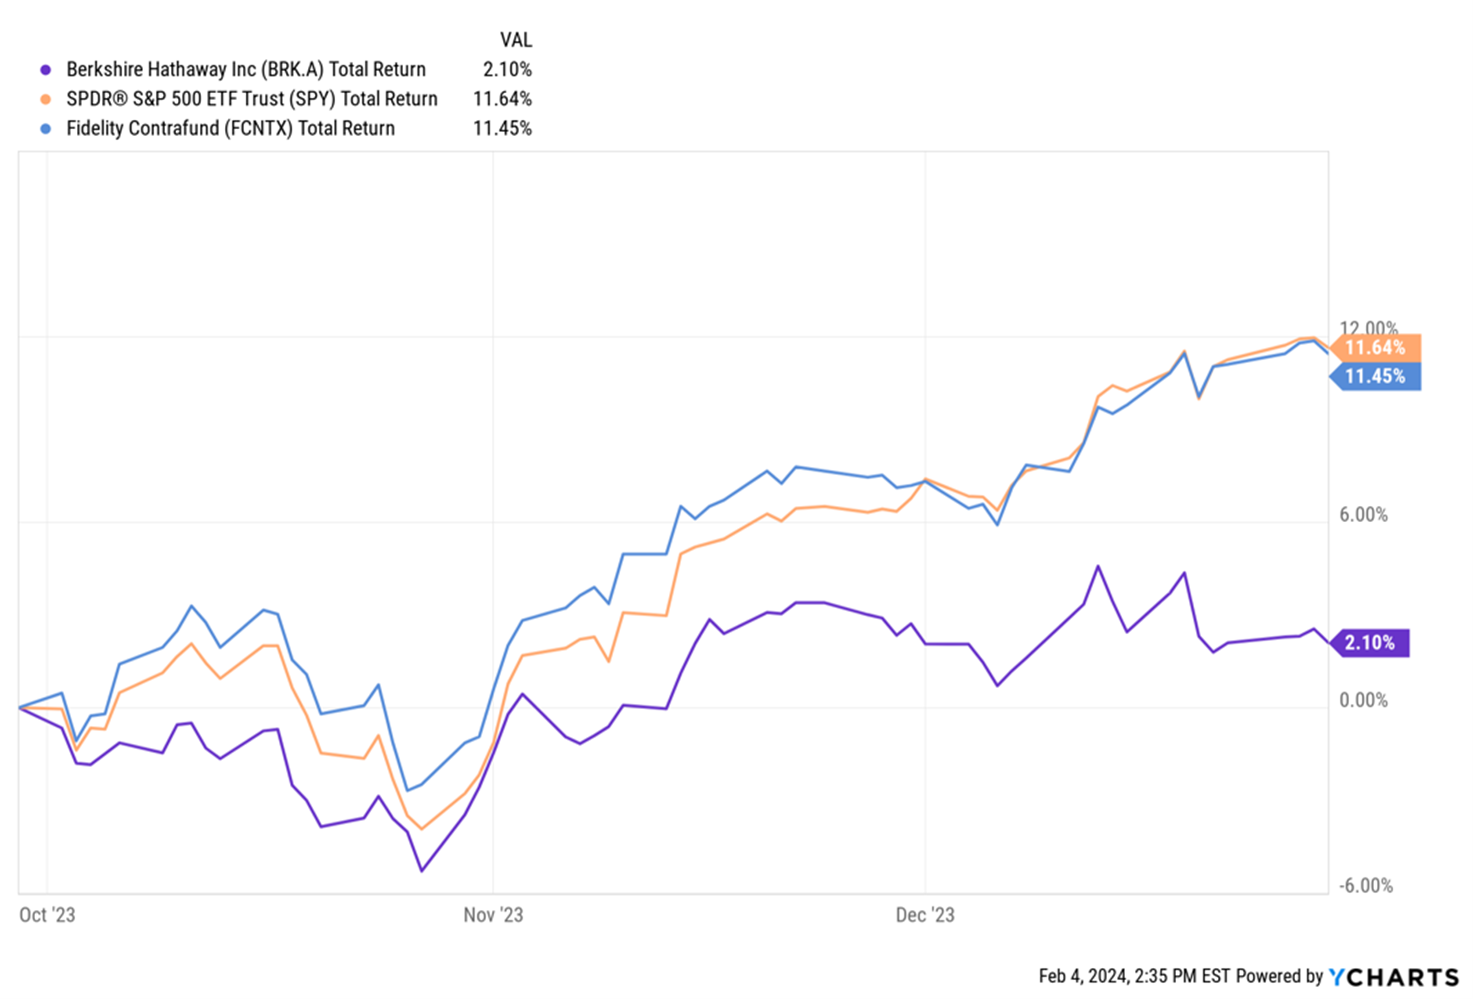
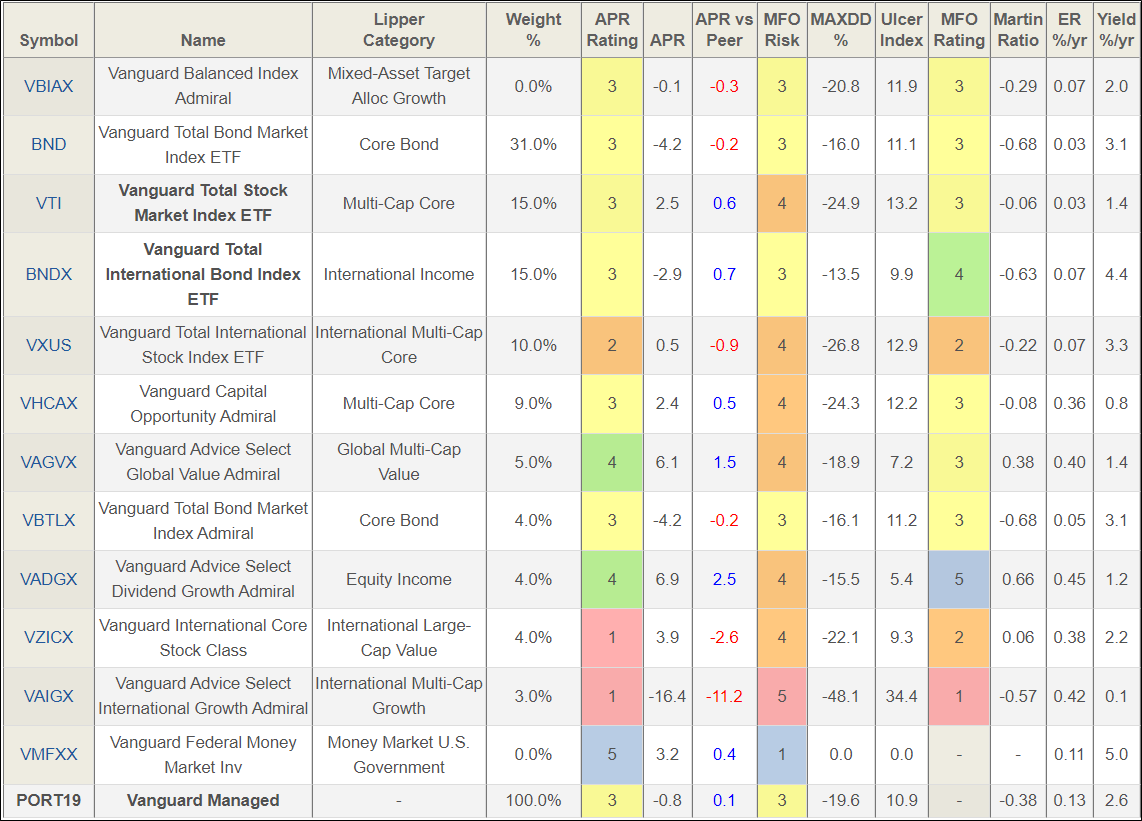
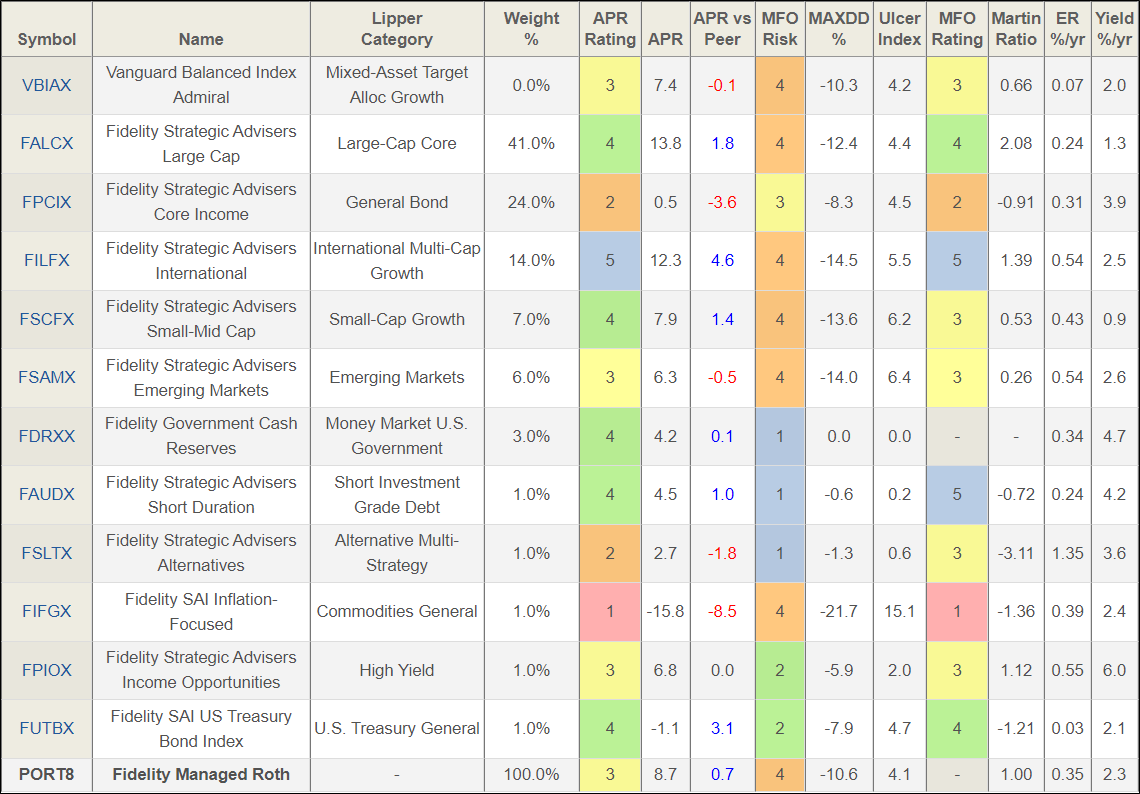
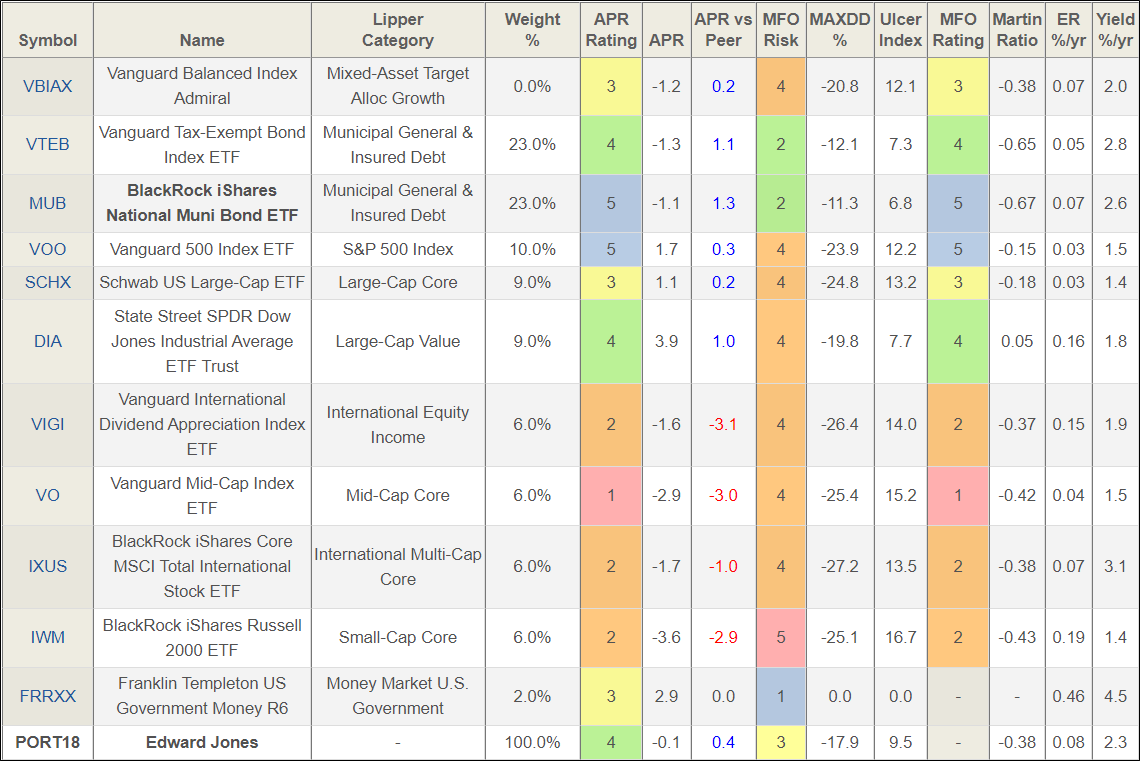
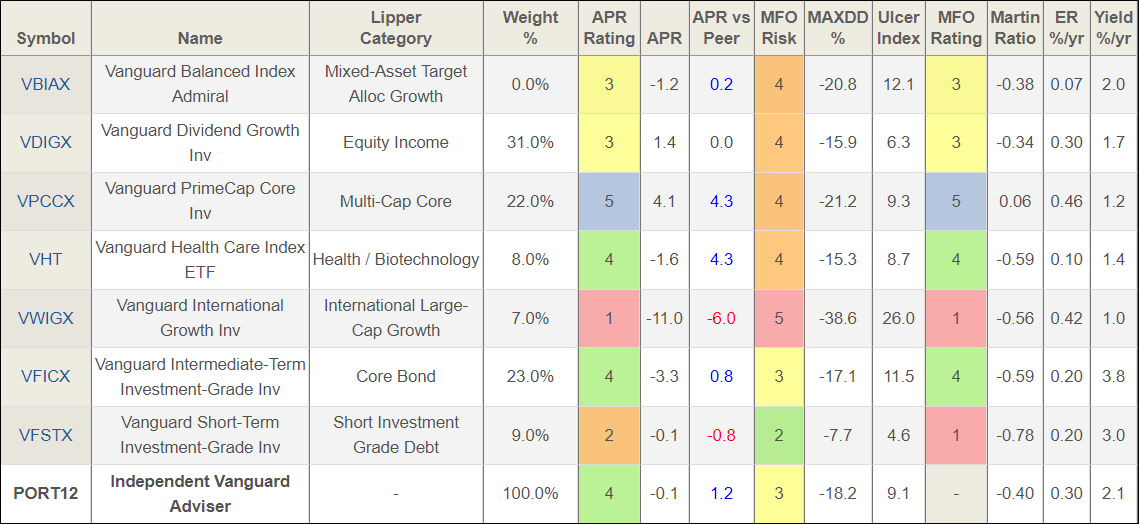
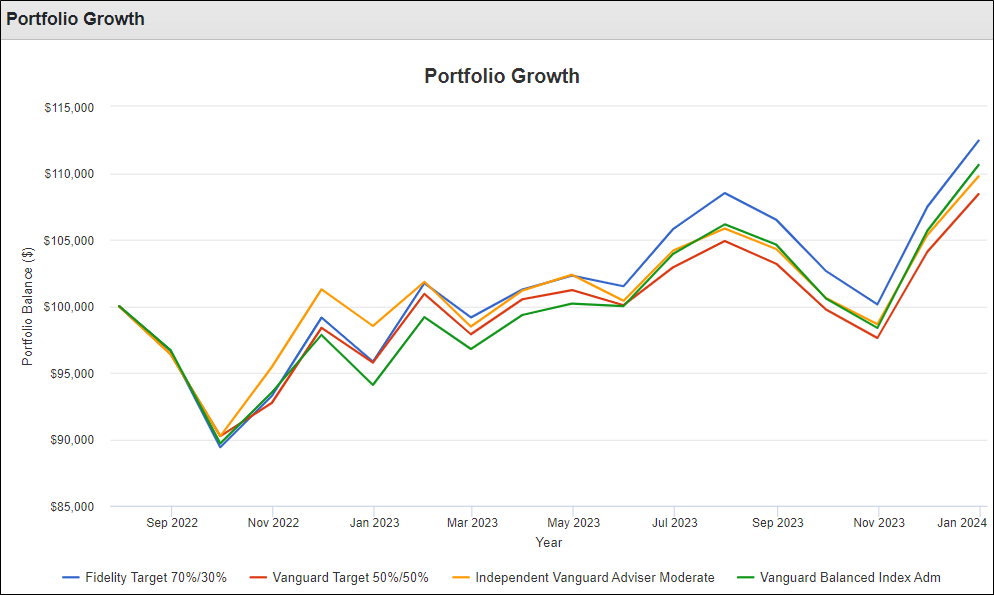
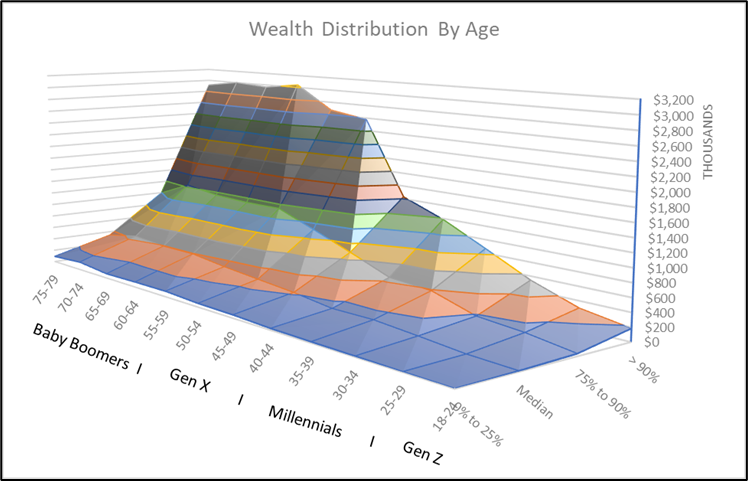
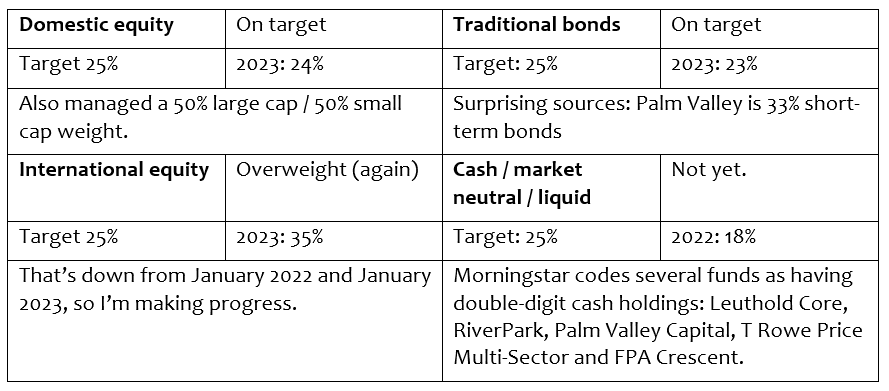
In celebration of nothing at all, I share a quick analysis of the state of my own portfolio: its goals, structure, status, and evolution. It’s an annual event.

Finally, Augie’s January Term allowed me to teach just one course for the month: one set of 18 students meeting with me for three hours a day, five days a week. No committee meetings. No other classes. No department events. The freedom from multi-tasking was surprisingly liberating, and I found myself learning a bunch of new stuff without intending to. And so I’ve shared my gleanings.

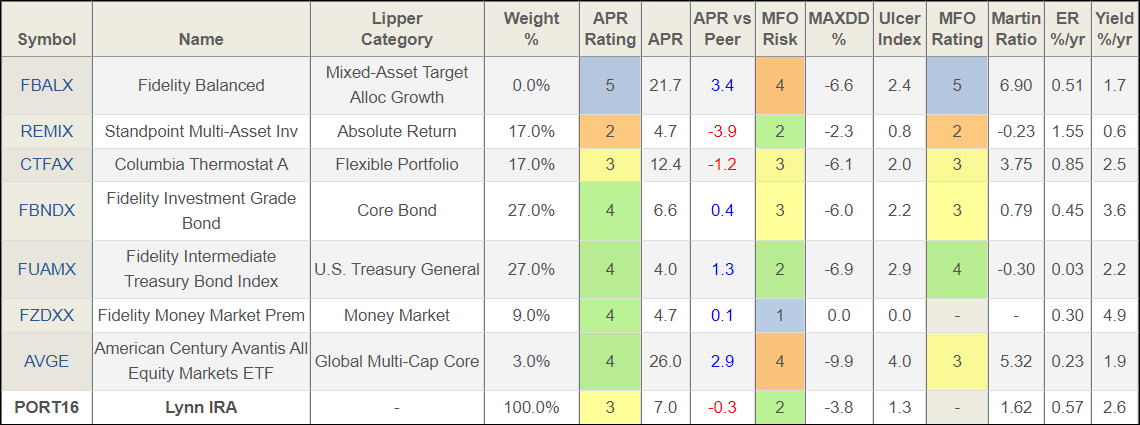
In the spirit of February, Devesh Shah also shares his portfolio review.

The Shadow shines a light on the industry’s maneuverings including new services from Vanguard, the decline of Matthews International, and a whole host of fund disappearances.

Rondure beyond Overseas

Rondure Global Advisors announced the closure and liquidation of one of its two funds, Rondure Overseas. The liquidation is slated for 8 February 2024. The decision to liquidate Overseas struck me as both wise (on the advisor’s part, given the financial reality of underwriting a tiny fund) and sad (because the fund, except in ’23, did exactly what we might hope for: double digit returns in good years, protection in bad ones).

For those who don’t know her, founder/chair/portfolio manager Laura Geritz began her investing career at American Century where she was a global analyst. In 2006 she joined Wasatch Funds as the founding manager for the Wasatch Frontier Emerging Small Countries Fund, and lead manager for both Wasatch International Opportunities Fund and Wasatch Emerging Markets Small Cap Fund. She founded Rondure in 2016 and continues to manage the four-star Rondure New World Fund. In 2023, she made the rare, brave, and principled move to hand off the CEO and CIO responsibilities to others. While she has roots in Kansas, she has lived in Japan, speaks Japanese, and reads cool stuff. Across years and markets, she has been remarkably successful in serving her investors. She and her team are deeply invested, financially and otherwise, in their funds.

I’ve spoken with Ms. Geritz on several occasions: at the launch of Rondure, for a profile of Rondure Overseas, and then again in January 2024 when we chatted about the liquidation of Overseas as an essential part of the process of growing and strengthening Rondure Global.

Some of the highlights:

  1. Overseas, even at its peak in performance, never hit its stride in the market. The fund’s expenses outstripped its revenues, which meant they had to divert resources from areas where they had confidence and saw opportunities.
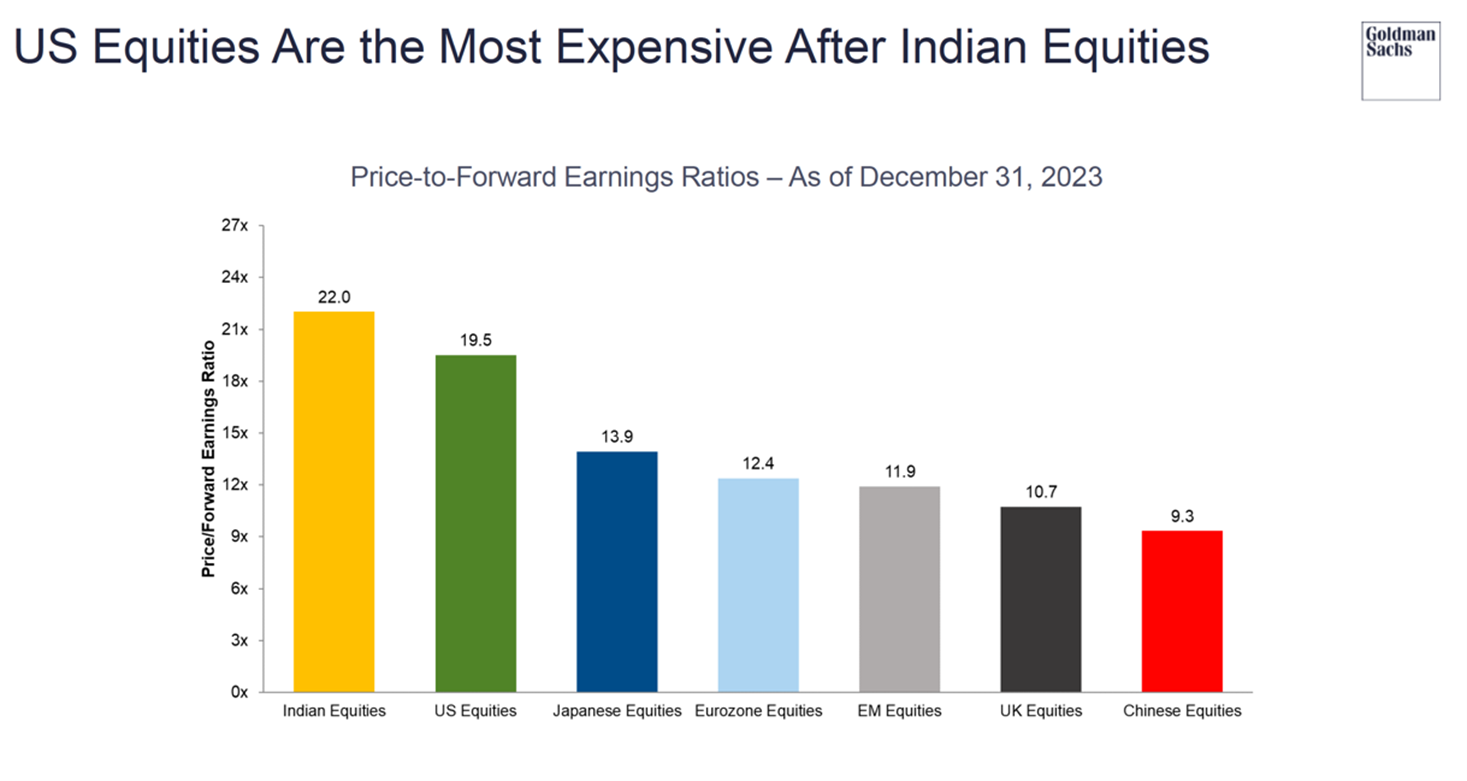
  2. Their portfolios were pretty solid in 2023, but they missed one major opportunity: Taiwan. Rondure looks for the intersection of quality and value, and Taiwan offered both. They hesitated primarily because they suspected that much of Taiwan’s corporate gains were driven by the post-pandemic revenge spending / work-from-home trade, which was unlikely sustainable. By many measures, corporate performance did deteriorate, but corporate share prices still soared to a 40% gain in 2023.
  3. China is offering some intriguing possibilities, with many firms selling for less than the value of their cash and other assets. Those are the so-called “net-net” companies where you’d still have a profit if they simply liquidated the day after you bought them; the money they make going forward is icing or gravy or some similar food metaphor. All of which is embedded in “a complete nanny state where power trumps economics.”
  4. Having moved from devoting lots of time to the corporate side of the firm, Ms. Geritz has freed up time to do the stuff she’s passionate about: investing and building an investment team.
  5. She sees “a valuation gap between EM and developed markets (especially the US) that has never been wider … We also see catalysts that could charge emerging markets stocks, including a weakening of the US dollar and peaking US interest rates.”
  6. The firm is adding analytic capacity and is looking, in part at the finance program at UC-Irvine, to add one or two remarkable new colleagues.
  7. Knowing my interest in reading, she recommends that I read the novel Snow Country by Yasunari Kawabata. Unless she said Snow Country Tales: Life in the Other Japan by Bokushi Suzuki, which is quite a different matter. My scribbled notes had a hieroglyphic vibe at this point, so I’ll likely declare it a twofer!

I have been reading, though slowly, Annie Duke’s book Quit: The Power of Knowing When to Walk Away. At base, Duke argues that we mythologize dogged determination and fail to notice how very often the failure to say “Well, that’s not working out, let’s do something smarter” leads to calamity. (You might enjoy paging through Barbara Tuchman’s The March of Folly: From Troy to Vietnam which is not her best work but which really highlights the cost of refusing to step back.) And, Duke argues, we understudy and undervalue quitting … aka “resource redeployment.” She writes:

Quitting a course of action is sometimes the best way to win in the long run, whether you’re cutting your losses at the poker table or getting ready to climb another day. Decision-making in the real world requires action without complete information. Quitting is the tool that allows us to react to new information that is revealed after we made a decision. Having the option to quit helps you to explore more, learn more, and ultimately find the right things to stick with. (22)

Celebration!

Taylor Larimore celebrated his 100th birthday on January 25, 2024. Taylor is an amazing soul and veteran of the Battle of the Bulge (1944). Dubbed “King of the Bogleheads,” by Jack Bogle no less, Taylor is the long-time champion of the online Boglehead community which embraces the power of low-cost, diversified, passive investing. He co-authored The Boglehead’s Guide to Investing (2e, 2021), edited The Boglehead’s Guide to Retirement Planning (2011), and was selected as one of Money Magazine’s everyday heroes in Champions of the small investor (3/2012). I can say with some confidence that should I live another 100 years, I wouldn’t reach Taylor’s plateau of service.

Taylor is member #2788 at MFO. From what I can tell, he dropped by in 2018, offered a brief prayer for our souls (and our portfolios), and headed back to saner climes.

We thank Taylor for all he’s done for tens of thousands of small investors and wish him a 2024 full of joy, good health, prosperity, and mischief.

Thanks, as ever …

Old Joe’s profile pic

To Hank and Old Joe, two of the founding members of the MFO discussion board in 2011. This past month each contributed their 10,000th comment to our board.

Crash, at 8100 comments, is on-deck. We cheer his sagacity onward and upward.

Hank’s profile pic

On the whole, OJ seems about as puzzled by Hank’s profile pic as we all are.

And thanks for the coffee cake from Dan (yum! – toasted in the fry pan with a little butter), Chip doles a bit out to me each day. Thanks, too, to Donald from Seattle, Poody (who, like me, wants to learn Premium search tools!), Allen of Georgia, Wayne from Starkville, Amruta of Missouri, a very generous Anonymous (many thanks!), Andrew from Akron, Matthew of Nebraska, Ian from Brentwood, John of PA, and Marty from the Tar Heel State (we’re past COVID for now, thanks for the good wishes, and we’ll share a bit more about assets than about our political leaders).

And, as ever, our Faithful Regulars: Wilson, S & F Investment Advisors, Gregory, William, the other William, Stephen, Brian, David, and Doug.

As ever,

david's signature

No, The 60/40 Portfolio Is Not Dead

By Charles Lynn Bolin

The reported death of the 60/40 portfolio is premature. It did suffer some serious illness as the stock market fell and interest rates rose last year. I help family and friends work with Financial Advisors to set up managed portfolios of mutual funds and exchange traded funds at Edward Jones, Fidelity, and Vanguard. Jeff DeMaso from The Independent Vanguard Advisor was kind enough to provide a Moderate Portfolio for this article. In this article, I am describing one managed Traditional IRA portfolio (50/50), one managed Roth IRA portfolio (70/30), one managed tax efficient portfolio (50/50), one self-managed Traditional IRA portfolio with varying allocations, and the Moderate Portfolio from Mr. DeMaso.

Financial Advisors will charge 0.3% to over 1% of the assets in management fees. These management fees are not subtracted from the performance of the portfolios in this article. The investor works with these Advisor to determine characteristics of these portfolios such as risk levels and allocations to active or index funds. I include Vanguard Balanced Index Admiral Fund (VBIAX) in each of the portfolios with no allocation as a baseline for comparison.

If an investor owns both Traditional and Roth IRAs then the risk should be higher in the Roth IRA where taxes have been paid than the Traditional IRA where taxes are yet to be paid. After tax accounts may vary according to whether the investor views them as long-term where a total stock market index fund will work well, or shorter term where the portfolio will include municipal bond funds. After-tax portfolios may also employ active tax loss harvesting strategies.

This article is divided into the following sections:

HIGH VALUATIONS HOLD ME BACK

I identify mostly with the philosophy of Howard Marks, co-founder of Oaktree Capital Management, who wrote in Mastering the Market Cycle: Getting the Odds on your Side:

“In my view, the greatest way to optimize the positioning of a portfolio at a given point in time is through deciding what balance it should strike between aggressiveness/defensiveness. And I believe the aggressiveness/ defensiveness should be adjusted over time in response to changes in the state of the investment environment and where a number of elements stand in their cycles.”

While the economy is surprisingly resilient in spite of high yields and an inverted yield curve, I remain conservative. The price-to-earnings ratio is in the upper 15% compared to the last eighty years – higher than all but the Dotcom Bubble and Great Financial Crisis as shown in Figure #1 from S&P 500 PE Ratio – 90 Year Historical Chart. High valuations and high yields that are likely to fall in the second half of the year favors a tilt towards bonds with longer durations, in my opinion.

Figure #1: S&P 500 PE Ratio – 90 Year Historical Chart

Source: Macrotrends

I prefer using the Cyclically Adjusted Price to Earnings (CAPE) Ratio. Ed Easterling, founder of Crestmont Research provides a good summary in Stock PE Summary (Quarterly) and a good description in Stock PE Report (Annual).

“Today’s normalized P/E is 32.1; the stock market remains positioned for below-average long-term returns. The valuation level of the stock market is above average. Relatively high valuations lead to below-average returns. Further, the valuation level of the stock market is relatively high given the currently elevated inflation rate and interest rate environment.”

VANGUARD MANAGED TRADITIONAL IRA 50/50

Below is a Vanguard-managed Traditional IRA that was set up to be approximately 50% stock and 50% bonds and consists of a mixture of index and actively managed funds. Vanguard uses largely a buy-and-hold strategy. Management fees are 0.3%, but services increase for balances over $500,000.

Figure #2: Vanguard Managed Traditional IRA – 25 months

Source: Author Using Mutual Fund Observer Portfolio Tool

The Vanguard Managed Traditional IRA (50/50) is approximately:

US Stocks: 29%
International Stocks: 20%
US Bonds: 32%
International Bonds: 17%
Cash: 2%
Other: 0%

FIDELITY MANAGED ROTH IRA 70/30

Below is a Fidelity-managed Roth IRA that invests according to the business cycle. Fidelity is very flexible working with clients to set up portfolios. The target allocation is 70% stocks, but it varies with Fidelity’s perception of the market outlook. Fidelity states that “Fees will vary based on the products and services you select; however, you’ll be informed of the fees before you make a decision—all part of our commitment to being transparent.”

Figure #3: Fidelity Managed Roth IRA – 17 months

Source: Author Using Mutual Fund Observer Portfolio Tool

The Fidelity Managed Roth IRA (70/30) is approximately:

US Stocks: 47%
International Stocks: 20%
US Bonds: 25%
International Bonds: 3%
Cash: 3%
Other: 2%

EDWARD JONES 50/50 TAX EFFICIENT PORTFOLIO

This is a portfolio that was set up with and managed by Edward Jones to be a tax-efficient portfolio to minimize taxes with moderate growth potential.

Figure #4: Edward Jones Managed Tax Efficient Portfolio – 24 Months

Source: Author Using Mutual Fund Observer Portfolio Tool

The Edward Jones Tax Efficient Portfolio (50/50) is approximately:

US Stocks: 40%
International Stocks: 12%
US Bonds: 46%
International Bonds: 0%
Cash: 2%

AUTHOR’S TRADITIONAL IRA

I follow the bucket approach and use Financial Advisors to manage the Bucket #3 with long-term investments. I manage the short-term Bucket #1 and intermediate-term Bucket #2. I have created a hypothetical portfolio to reflect the Bucket #2 using bond funds instead of the bond ladders that I own. I own several funds that have been written about in the Mutual Fund Observer newsletters. David Snowball wrote Standpoint Multi-Asset Fund: Forcing Me to Reconsider and I wrote One of a Kind: American Century Avantis All Equity Markets ETF (AVGE). Information about the Thermostat Fund (COTZX/CTFAX) can be found at the Columbia Thermostat website and Morningstar. My next purchases will be of AVGE as bonds mature and I want to increase allocations to stock.

Figure #5: Author’s Investment Bucket #2 Intermediate IRA Portfolio – 15 Months

Source: Author Using Mutual Fund Observer Portfolio Tool

The Author’s Intermediate Investment Bucket Portfolio (varies) is approximately:

US Stocks: 10%
International Stocks: 4%
US Bonds: 66%
International Bonds: 3%
Cash: 15%
Other: 1%

INDEPENDENT VANGUARD ADVISOR PORTFOLIO

Jeff DeMaso from The Independent Vanguard Advisor provided a Moderate Portfolio for this article. The Independent Advisor maintains model portfolios for the Do-It-Yourself investors who want to stay on top of the market and happenings at Vanguard.

Figure #6: The Independent Vanguard Advisor Moderate Portfolio – 24 Months

Source: Author Using Mutual Fund Observer Portfolio Tool

The Independent Vanguard Advisor Moderate Portfolio (60/40) is approximately:

US Stocks: 55%
International Stocks: 11%
US Bonds: 26%
International Bonds: 6%
Cash: 2%
Other: 0%

COMPARISON OF THREE PORTFOLIOS

I used Portfolio Visualizer to compare the Vanguard Managed Traditional IRA, Fidelity Managed Roth IRA, and The Independent Vanguard Advisor Moderate Portfolio. The link to Portfolio Visualizer is here. The allocations to the latter two will vary as the managers see opportunities and risks. The fees from the Vanguard and Fidelity portfolios have not been subtracted from their performance. The chart starts in August 2022 due to the short life of AVGE. One final comment is that the allocations are different for the three different portfolios. During this time period portfolios with higher allocations to stocks performed better before fees are subtracted.

Figure #7: Performance of Fidelity, Vanguard and Independent Vanguard Advisor

Table #1: Performance of Fidelity, Vanguard and Independent Vanguard Advisor

Source: Author Using Portfolio Visualizer

Closing

My current thought is to look for opportunities to increase my allocations to stocks in tax-efficient portfolios to take advantage of lower capital gains rates, and more Roth Conversions before the Tax Cuts and Jobs Act of 2017 sunsets at the end of 2025. Depending upon market conditions.

Financial Discoveries: 10 Cool Things I Learned in January

By David Snowball

College professors are, quintessentially, learning machines. Give us 15 minutes of peace, and we’ll sink happily into piles of data, stacks of books, beckoning journal articles, or quiet processing.

And the reality of the matter is that almost no one gives anyone 15 minutes of peace these days.

Why 15 minutes? Read Mihaly Csikszentmihalyi, Flow: The Psychology of Optimal Experience (2008). Flow is a state of complete immersion in a project, and it seems to take us 15 minutes or so to get in the flow. Every “do you have just a minute?” kicks us back out and costs us another 15 minutes to get back.

Augustana’s January Term is, in that sense, a godsend. I teach one high-engagement course to 18 students. We meet five days a week for two 90-minute blocks each day. In exchange, the college demands nothing else of me: no retreats, no meetings, no committees, no social events, nothing. And so I had a chance to focus and to learn.

For what interest it holds, here are ten things I learned that you might benefit from.

  1. The market value of The Magnificent Seven stocks exceeds the combined value of the Canadian, Japanese, and British stock markets

    Those seven (bow, peasant) are worth more by a third than the entire Chinese stock market and more by 400% than all of the stocks in the Russell 2000 (Evie Liu, “Apple, Tesla, and the Rest of the Magnificent 7 Are Larger Than Entire Countries’ Stock Market,” Barron’s via MSN, 1/10/2024).

    That inevitably calls to mind the reverse situation 35 years ago. Edward J. Epstein recalls the scene for us:

    At its height, in 1989, real estate in Tokyo sold for as much as $139,000 a square foot—more than 350 times as much as choice property in Manhattan. Such valuation made the land under the Imperial Palace in Tokyo notionally worth more than all the real estate in California. The Japanese stock market, with some shares selling for a thousand times their earnings, similarly skyrocketed. Indeed, in 1989, the notional value of the stocks listed on the Tokyo exchange not only exceeded all the stocks in America but represented 44 percent of the value of all the equities in the world. (“What Was Lost (and Found) in Japan’s Lost Decade,” Vanity Fair, 2/17/2009)

    Shortly thereafter, prices collapsed by 80%. The question for folks whose portfolios are dependent on seven stocks is, are we next?

  2. 2023 was the Year of The Magnificent Seven … and those other 4660 over in the corner.

    Scott Opsal, director of research for the Leuthold Group, reports:

    The Magnificent Seven’s remarkable performance defines the stock market in 2023. This basket of the seven largest companies in the S&P 500 index gained an average of 111% vs. an average gain of 9% for the other 493 companies. The combined impact of huge index weights and outsized performance made 2023 one of the most top-heavy markets in history. (“Fundamentally Magnificent,” 1/25/2024)

    The question is, “Are those prices disconnected from reality?” Leuthold’s surprising answer was, “No, not really.”

    One key feature of an investment bubble is the realization that asset prices are completely divorced from the fundamentals. From this perspective, the Magnificent Seven does not represent a bubble in the least. Rather, the group’s superiority is a testament to the investment results that come from identifying long-lasting trends that can power high earnings growth for a decade or more.

    Common Stocks and Uncommon Profits, the investment classic written by Philip Fisher, is a must-read for every serious investor. Fisher’s premise is that investment success can be achieved by owning a handful of exceptional growth stocks for many years letting their compounding ability work in your favor. If you select these investments wisely, with the passage of time, the original purchase price becomes almost irrelevant. The Magnificent Seven stands as a proof of concept for this philosophy, and we wonder if the book’s publisher might be inclined to release a new edition with a bonus chapter on this extraordinary market story that has earned a place in stock market history.

  3. Perhaps it’s time to consider the S&P 493?

    It’s the optimist’s play on passive investing. Standard & Poor’s has several versions of the S&P 500; the best known has the 500 (or s0) stocks weighted by their market capitalization so that the largest stocks – the Magnificent Seven, currently – almost entirely determine the index’s result. For short periods, that seems a magnificent strategy. More often, and over time, the better strategy is to invest in the same 500 stocks but weight your portfolio equally between all of them. That strategy imbues your portfolio with two biases: it favors slightly smaller stocks and somewhat cheaper sectors of the market.

    The market-cap-weighted S&P 500 hit a record high in late January 2024. The equal-weighted S&P 500 strategy suffered an epic setback relative to the S&P 500 in 2023.

    Source: The Leuthold Group

    But, as Morningstar notes, the equal-weight S&P 500 provides better diversification and has actually outperformed the cap-weight version by about 1% annually over the course of the 21st century (Sarah Hansen, “Do you have the wrong index funds?” 1/19/2024). It also trades at more reasonable valuations. The WSJ’s Spencer Jakab notes:

    The good news for long-term investors is that the stock market seems to have more of a concentration problem than a price or an earnings one. Mid-cap stocks sport a forward P/E ratio of 14.5 times, and small ones … are at just 14.1 times, according to Yardeni. That is a pretty middle-of-the-road valuation historically and is almost as cheap as that index has been relative to the large cap S&P 500 in more than two decades … Even most large stocks aren’t especially pricey: An equal weighted version of the S&P 500 …is close to its lowest ratio to the more mainstream index since the Global Financial Crisis. (“When Are Stocks No Longer a Good Value?” WSJ, 1/30/2024)

    Interested investors might look at the behemoth Invesco S&P 500® Equal Weight ETF (RSP). In any case, it might be prudent to hedge a bit on your devotion to The Seven.

  4. The US stock market is shrinking dramatically.

    One inevitable consequence of vast corporate wealth, lax antitrust enforcement, and the incessant need for apparent growth to placate investors is the impulse of huge corporations to consume – merge with, acquire, buy up – smaller ones. Microsoft, for instance, has purchased 225 other corporations since 1986, including 14 valued at over $1 billion each (List of mergers and acquisitions by Microsoft, 2024).

    The rate of consumption has consistently exceeded the rate of creation, and so the US stock market has narrowed. The Fed calculates the number of public corporations per million people to allow fair comparison across time.

    The number of corporations per million of population was between 25-30 in the 1990s and is closer to 13 as of 2019 (inexplicably, that’s the most recent St. Louis Fed report and also the most recent for several other data sources. Statistica estimates that the number of NYSE stocks has fallen by about 500 since then, while the number of NASDAQ-listed ones remains roughly the same.

  5. The world’s five richest men are accumulating wealth at the rate of $14,000,000 / hour.

    The world’s richest men—Elon Musk, Bernard Arnault, Jeff Bezos, Larry Ellison, and Warren Buffett—have doubled their collective wealth to $870 billion since 2020. That’s a rate of $14 million an hour, with little sign of abatement, according to a new study from the UK-founded charity organization Oxfam.

  6. ARK is destroying wealth almost as fast.

    In a nice cautionary tale, Morningstar’s Amy Arnott tried to track down the landmines on which investors have most insistently trod. That is, she analyzed Morningstar’s vast trove of data to discover which individual funds and which fund families are lured the greatest number of investors to their doom. She ends up chronicling that antithesis of Tweedy, Browne’s famous What Has Worked in Investing.

    The worst of the worst is ProShares UltraPro Short QQQ (SQQQ), a fund that allows investors to bet that the NASDAQ composite is going to fall today. By Arnott’s calculation, investors guessed wrongly: $8.5 billion worth of times. Fourteen of the 15 most destructive funds are ETFs, which are positioned as speculative vehicles as often as investment ones. And, as it turns out, speculation kills.

    But SQQQ is a singular disaster. Arnott also takes a step back to ask what firms have pooled their efforts to produce the greatest collective act of wealth destruction. The answer is Cathie Wood’s ARK ETF Trust.

    ARK, home of the flagship ARK Innovation ETF ARKK, tops the list for value destruction. After garnering huge asset flows in 2020 and 2021 (totaling an estimated $29.2 billion), its funds were decimated in the 2022 bear market, with losses ranging from 34.1% to 67.5% for the year. Many of its funds enjoyed a strong rebound in 2023, but that wasn’t enough to offset their previous losses. As a result, the ARK family wiped out an estimated $14.3 billion in shareholder value over the 10-year period—more than twice as much as the second-worst fund family on the list. ARK Innovation alone accounts for about $7.1 billion of value destruction over the trailing 10-year period. (Amy Arnott, “15 Funds that have destroyed the most wealth over the past decade”, Morningstar, 2/2024)

    Given the number of warnings over seven years from both MFO and Morningstar, that shouldn’t be a surprise. And yet $16 billion remains entrusted to them. There’s a certain irony to the disconnect between the safety of the Ark and the effects of investing with ARK.

  7. Speaking of wealth destruction, 95% of all NTFs have gone to zero.

    Be nice, we just shared a $69 million NFT with you. Beeple, Everydays.

    A widely cited report by dappGambl (“your one-stop shop for unbiased reviews and analysis of cryptocurrency gambling platforms and Web 3.0 projects”)

    Using data provided by NFT Scan, we have compiled a comprehensive analysis of over 73 thousand NFT collections … Of the 73,257 NFT collections we identified, an eye-watering 69,795 of them have a market cap of 0 Ether (ETH).

    This statistic effectively means that 95% of people holding NFT collections are currently holding onto worthless investments. Having looked into those figures, we would estimate that 95% to include over 23 million people who’s (sic) investments are now worthless.

    The estimate of 23 million NFT owners is inconsistent with most published estimates of eight million or so. We haven’t looked into dappGambl’s method for setting the higher figure. Regardless, major ruin.

    NFTs are, at base, a stupid idea whose appeal was to casino-addled speculators. Nonetheless, NFT advocates foresee them rising, like a phoenix from its ashes, to become an $80 billion market in 2025. As we wrote in January 2023, “NFT advocates remain upbeat about the future of their product, which means they remain upbeat about the prospect of separating credulous investors from their wealth. I would decline the opportunity.”

  8. Black Americans are becoming stock investors in record numbers.

    Traditionally, Black Americans have participated in financial markets at far lower levels than have white Americans. There are a dozen good explanations for that decision, but the net effect is that those families did not have access to a powerful source of long-term wealth creation.

    It’s good news that that’s changing. The Wall Street Journal reports:

    Black Americans are the fastest-growing group of student buyers, with young Black investors fueling the surge. Nearly 40% of Black Americans owned stocks in 2022, up from just under a third in 2016 … nearly 70% of Black respondents under 40 years old were investing, compared to about 60% of white respondents in the same age group in 2022. (“Stock’s fastest-growing sector: Black investors,” 1/16/2024)

    On the whole, Black investors are making more modest investments, are more likely to turn to friends and family, and are more likely to rely on social media sources for their financial guidance than white investors.

    A note to young investors of all colors, faiths, and genders: Plan on getting rich slowly. I so wish that there was a reliable alternative to slow and steady gains, but there is not. Anyone who promises you a shortcut to wealth is, I suspect, mostly interested in acquiring your wealth for their gain.

    If you’re 40 or younger, buy a super cheap, passive Total Stock Market or Total World Market index fund or ETF. Commit to automatically adding to it every month. If you’re, say, 40 to 60 years old, balance your investments with a strong tilt toward stocks. For the rest of us, balance your investments with a strong tilt toward bonds. A great guide for a prudent balance is the stock/bond/cash balance built into the T. Rowe Price Retirement funds, which are some of the best in the business.

  9. 50% of inflation was a corporate money grab.

    Rural America is littered with angry billboards on the edges of farm fields and front yards, snarling at President Biden for somehow triggering the global price spasm of 2022. Setting aside the fact that the price jumps did not start in the US, were not unique to the US, and were not attributable to actions taken by the US (cf Markovitz and Marchant, “Why is inflation so high?” World Economic Forum, 2022), we now have a clearer sense of what influenced the magnitude of the spike.

    Greed. (Duh.) From early on, we could see that the rise in the cost of corporate inputs (labor, energy, materials) was only half as great as the rise in consumer prices. A recent report by the public advocacy group Groundwork Collaborative attributes 53% of the price bump to the decision by corporate managers to use “the inflation crisis” as a cover to bump up earnings and cause, well, the inflation crisis.

    Among the report’s key findings:

    From April to September 2023, corporate profits drove 53% of inflation. Comparatively, over the 40 years prior to the pandemic, profits drove just 11% of price growth.

    While prices for consumers have risen by 3.4% over the past year, input costs for producers have risen by just 1%. For many commodities and services, producers’ prices have actually decreased. Corporations have failed to pass these savings to consumers.

    That’s bad news to consumers, especially those of us who eat … ummm, groceries which rose more than prices in other sectors and which disproportionately hits less affluent families despite efforts by the Biden administration to buffer the impact.

    There is good news and bad for investors. The ability to transfer more money from consumers to corporations boosted corporate profits (the “earnings” in the price-to-earnings ratio) and made stock prices appear more reasonable. The inability to continue that particular act of legerdemain means that markets might appear increasingly overvalued.

  10. Potatoes became popular in Europe as a tax minimization strategy

    Here’s the speculation:

    During the 17th and 18th centuries, wheat was the biggest crop in Europe. It was very visible, took up lots of space, and was easy to tax. As a way to avoid being taxed on their food, people started growing potatoes in their gardens. Above ground, it’s an unassuming plant that doesn’t draw much attention to itself. (Greg Byer, “19 surprising facts about the history of potatoes,” 2024)

    Admittedly, more serious scholars attribute the potato’s rising popularity in the face of the peasants’ conservative reticence to “clever propaganda” (Rebecca Earl, “Promoting Potatoes in Eighteenth-Century Europe,” Eighteenth Century Studies, 2017). By some estimates, my Irish forebears ate 5.5 kilos of potatoes a day, with a single acre of land producing enough nourishment for an Irish-sized family (“How the humble potato changed the world,” BBC Magazine, 2020). Professor Earl even suggests that the whole of modern civilization is driven by the majestic spud (“How the humble potato fueled the rise of liberal capitalism,” The Conversation, n.d.)

    Well, yes, I do read articles on the history of potatoes. But only after I finish ones on the global history of cheese.

Patriotic Millionaires and the Uncertainty of Taxes

By Charles Lynn Bolin

Our new Constitution is now established, and has an appearance that promises permanency; but in this world nothing can be said to be certain, except death and taxes.

Benjamin Franklin, in a letter to Jean-Baptiste Le Roy, 1789

I read  Tax the Rich!: How Lies, Loopholes, and Lobbyists Make the Rich Even Richer by Morris Pearl and Erica Payne at the Patriot Millionaires. They are a group of over 200 “high net worth individuals with annual incomes over $1 million and/or assets over $5 million who are committed to raising the minimum wage, combatting the influence of big money in politics, and advancing a progressive tax structure.” They believe that the tax system should be reformed so that the rich pay their fair share of taxes. Are the Patriotic Millionaires correct?

Source: Getty Images, Tasos Katopodis

This article is divided into the following sections:

Media Bias

Taxes are an emotionally and politically charged topic and misinformation is abundant. Media Bias / Fact Check is “dedicated to educating the public on media bias and deceptive news practices.” Their methodology rates sources based on Bias, Factual Reporting, and Credibility Rating. The Patriotic Millionaires is rated Left-Center with High Factual Reporting and High Credibility. In this article, I choose media sources that are rated by Media Bias / Fact Check as High Factual Reporting and High Credibility to evaluate the impact of taxes across the wealth groups.

“Tax The Rich!” has an interesting chapter on ten “lies” that the authors perceive as misinformation. Lie #6 is about rich people’s charity for which they provide some facts:

The twenty richest Americans donated about $8.7 billion to charity in 2018 – less than 1% of their net worth. Take away Bill Gates and Warren Buffet, the most generous of the top twenty, and the other eighteen ended up giving just $2.8 billion, or 0.32% of their total net worth. That’s less than the national average – 0.33% of household worth.

Patriotic Millionaires

United Press International published Hundreds of Millionaires, Billionaires Urge Politicians at Davos to Tax Their Wealth describing 268 millionaires and billionaires from seventeen countries that urged world leaders at The World Economic Forum to tax their wealth. Their letter stated that the reasons they thought they should pay more in taxes were:

  • Proud to pay more to tackle extreme inequality.
  • Proud to pay more to help reduce the cost of living for working people.
  • Proud to pay more to better educate the next generation.
  • Proud to pay more for resilient healthcare systems.
  • Proud to pay more for better infrastructure.
  • Proud to pay more for a green transition.
  • Proud to pay more taxes on our extreme wealth.

Patriotic Millionaires was one of the organizations supporting the letter. The article describes a survey conducted by Survation on behalf of Patriotic Millionaires, which polled over 2,300 respondents from G20 countries who hold more than one million dollars of investable assets. It found that 74% of millionaires support higher taxes on wealth to help address the cost-of-living crisis and improve public services.

Some of the ways the authors of “Tax the Rich!” describe the tax system favoring the rich are:

  1. Carried Interest: “The Billionaires’ Loophole”
  2. The Estate Tax: How We Created an American Aristocracy (Between 35% and 45% of all wealth in America is inherited.) 
  3. Sidestepping Taxes: The Stepped-Up Basis (80% of the benefit goes to the Top 0.1% of households.)
  4. Annuity Trusts: Don’t Trust This System 
  5. Let’s Play Switch and Swap: The 1031 Like-Kind Exchange 
  6. Help the Rich by Pretending to Help the Poor: Opportunity (for Rich People) Zones 
  7. Just Passing Through: The Pass-Through Deduction (A NBER “paper suggests that nearly 75% of all pass-through income is really just normal personal income funneled through a shell business…” “85% of the “the pass-through income goes to the top 20% of taxpayers, and more than 50% goes to the top 1%”).

Composition of Federal Taxes

The following chart is from Who Pays, and Doesn’t Pay, Federal Income Taxes in the U.S.? by the Pew Research Center which shows that over the past forty years individual income, Social Security, and Medicare taxes have increased while corporate and excise taxes have declined as a share of Federal taxes.

Figure 1#: Source: Changing Composition of Federal Tax Sources

Source: Pew Research Center: Office of Management and Budget

Inequality

According to the St. Louis Federal Reserve FRED website, the wealthiest 0.1% of households (approximately 131,000) own $19.7 trillion dollars (13.8% of total household net wealth) compared to $9.3 trillion (6.5% of total household net wealth) for the bottom 50% of households (approximately 65,000,000). The net worth of those in the Forbes 400 List is $4.5 trillion or over 3% of all household net wealth in America. The net worth of the richest 20 in the Forbes 400 list is $1.9 trillion or 1.3% of the total household net wealth in America.  

According to 6 Facts About Economic Inequality in the U.S. by the Pew Research Center income inequality in the U.S. is the highest of all the G7 nations and the wealth gap between America’s richest and poorer families more than doubled from 1989 to 2016.

American Perceptions

The Pew Research Center found that over 60% of respondents to a survey believe that corporations and the wealthy aren’t paying their fair share of taxes. Very few think the poor aren’t paying their share of taxes. Democrats and Democratic Leaners strongly feel (77%) that corporations and wealthy people do not pay their fair share. By contrast, 43% or more Republicans and Republican Leaners feel that the wealthy and corporations are not paying their fair share of taxes. This is consistent with surveys by GALLUP and Reuters/Ipsos.

Figure 2#: Survey of American’s Frustration with the Federal Tax System

Source: Pew Research Center

Wealth vs Income

USA Facts produced this fascinating chart of income versus wealth below. The wealth of the Bottom 60% by income group is mostly held in real estate (home), other assets (i.e. vehicles, appliances, etc.), and retirement accounts while the wealthiest income groups increasingly own stocks and mutual fund shares and private businesses. 

Figure 3#: Components of Wealth by Income Inequality

Source: USA Facts: Federal Reserve

I created the following chart from the Board of Governors of the Federal Reserve System Distributional Financial Accounts to show how the distribution of wealth has changed over time. The share of the wealth of the wealthiest 1% grew from 23% to 31% during the past three decades while the share of the wealth of the 50% to 99% groups has fallen from 73.6% to 66.9%. 

Figure 4#: Share of Wealth Over Time

Source: Author: Board of Governors of the Federal Reserve System

I created the next chart from data provided by the Federal Reserve Survey of Consumer Finances to show the wealth distribution by age. The Baby Boomers and older Gen X are the wealthiest Americans (Top 90%).

Figure 5#: Wealth Distribution by Age

Source: Author: Survey of Consumer Finances

Capital Gains and Wealth Taxes

Some advocate having a wealth tax because stock can be held tax-free until sold when it is taxed at the lower capital gains rate of 20%. By contrast, those working for wages or salary have their incomes taxed at the progressive rates for ordinary income. According to “Tax the Rich!”, 69% of capital gains are earned by the wealthiest 1%. They propose progressive tax rates on capital gains for those with incomes over $1 million.

Stock Buy Backs

President Biden implemented a 1% excise tax on share buybacks. John Foley at Reuters explains the controversy over share buybacks in Biden’s Buyback Tax Shows Who Really Runs America which I summarize as:

  • “While dividends are taxed as income, shares sold in a buyback incur capital gains tax that applies only to the owner’s overall profit.” 
  • Foreign investors, including hedge funds based in tax havens like the Cayman Islands, generally pay no U.S. tax on capital gains, but a 30% tax on dividends. Foreign investors hold around 30% of U.S.-listed stock.
  • If companies had paid out $882 billion as dividends rather than in buying back stock the government would have gained up to $80 billion in extra tax revenue.
  • Biden’s reforms failed to tackle the biggest problem with share buybacks, which is that they allow very wealthy Americans to amass fortunes and pass them on to their heirs while sheltering from tax.

IRS Audits

In Trends in the Internal Revenue Service’s Funding and Enforcement, the Congressional Budget Office said the IRS estimates that the annual tax gap is several hundred billion dollars per year. Between 2010 and 2018, inflation-adjusted funding for the IRS fell by 20% adjusted for inflation. The authors of “Tax the Rich!” say that “From 2001 to 2019, the proportion of millionaires who were audited dropped from 12% to just 3%, while fewer than 1% of all corporations are now audited each year.”

The Associated Press reported that the IRS has recovered $462 million in back taxes over the past two years from delinquent millionaires. The IRS leadership attributed it to increased funding under the Inflation Reduction Act.

Tax Distribution

Federal Tax Rates

The Pew Research Center analyzed data from the IRS’s Statistics of Income Program to produce the following chart. It shows that most income groups had a reduction in the average effective federal income tax rate during the past two decades. 

Figure 6#: Federal Income Tax Is Progressive as a Whole, But Less So at the Top

Source: Pew Research Center: IRS’s Statistics of Income program

The Tax Foundation published Summary of the Latest Federal Income Tax Data, 2023 Update describing that the “top 1 percent of taxpayers (AGI of $548,336 and above) paid the highest average income tax rate of 25.99 percent—more than eight times the rate faced by the bottom half of taxpayers.”

While taxes paid can fluctuate, 25.99% paid by the Top 1% is significantly below the 42% from the 1950s when the debt to GDP ratio was high after World War II.

The Congressional Budget Office published Trends in the Distribution of Household Income From 1979 to 2020 that shows that prior to 2020, the Top 1% paid about 25% of the Federal taxes including individual income taxes, payroll taxes, corporate income taxes, and excise taxes, and the next 19% pay approximately 45%.

State and Local Burdens

The following chart from the Tax Foundation estimates average Federal and state/local tax burdens in 2019 by household income levels. State taxes tend to be regressive having a greater impact on lower income groups. Average total Federal, State, and Local income tax burdens are 24.6% for the bottom income group and 34.5% for the Top income group.

Figure 7#: Household Federal and State/Local Tax Burdens

Source: Tax Foundation: BEA, SSA, USCB, CMS, and VA

Corporate Taxes

The wealthiest 1% own over half of all stocks. The Patriotic Millionaires in “Tax the Rich!” list five methods that corporations use to reduce their taxes:

  1. Multinational Money Games: International Profit Shifting
  2. Giving Away the Store: Our New Territorial Tax System
  3. Over There, Over There: Relocating Assets Overseas
  4. Stocking Up on Loopholes: Stock Options for Executives
  5. Look Fast! Oh, You Missed it: Accelerated Depreciation

According to S&P Dow Jones Indices, in 2018 approximately 29.1% of the revenue of the companies in the S&P 500 came from international sources. CBS News reported 60 profitable companies in 2018 that paid no Federal taxes. For 2020, the Institute on Taxation and Economic Policy listed that “55 of the largest corporations in America paid no federal corporate income taxes in their most recent fiscal year despite enjoying substantial pretax profits in the United States.” They add that “it appears to be the product of long-standing tax breaks preserved or expanded by the 2017 Tax Cuts and Jobs Act (TCJA) as well as the CARES Act tax breaks”.

Yellen Says 100,000 Firms Have Joined a Business Database Aimed at Unmasking Shell Company Owners by the Associated Press describes that 100,000 businesses have joined a new database that collects “beneficial ownership” information on firms as part of a “new government effort to unmask shell company owners.” The National Bureau of Economic Research published International Tax Avoidance by Multinational Firms that states that according to recent estimates, “close to 40 percent of multinational profits — profits booked by firms outside of their headquarters’ country — are shifted to tax havens.” 

Tax Reform 

The Patriotic Millionaires offer six solutions to reform the tax system:

  1. Equalize Capital Gains and Ordinary Income Tax Rates for Incomes Over $1 Million
  2. End the Bracket Racket: Create Lots of Brackets at Much Higher Rates
  3. Tax The Rich!: Implement a Wealth Tax
  4. Stop Letting Investors Delay Tax Payments on Capital Gains: Mark-to-Market Taxation
  5. Make Corporations Pay Taxes Where They Really Make Their Profits: End Profit Shifting
  6. Make Sure They Actually Pay: Fund the IRS

The Organisation for Economic Co-operation and Development (OECD) published Summary Economic Impact Assessment Global Minimum Tax in January 2024, describing a 15% Global Minimum Tax (GMT) on multinational enterprises with revenues above EUR 750 million wherever they operate. It was agreed to by over 135 member jurisdictions in October 2021. “Since then, the implementation of the GMT has progressed with around 55 jurisdictions already taking steps toward implementation and with the rules coming into effect in 2024.”

Closing Thoughts

Are the Patriot Millionaires correct? My analysis of the data leads me to agree with the Patriot Millionaires that aligning the tax system to be fairer to the employed wage earner is appropriate. I have signed up for the Patriotic Millionaires newsletter to receive updates.

Snowball’s Indolent Portfolio, 2023

By David Snowball

Someone will always be getting richer faster than you. This is not a tragedy.

I’ve heard Warren say a half a dozen times, “It’s not greed that drives the world, but envy.”

Envy is a really stupid sin because it’s the only one you could never possibly have any fun at. There’s a lot of pain and no fun. Why would you want to get on that trolley?

Charles Thomas Munger (1924-2023)

Each year I share with readers my unenviable portfolio. By design, my portfolio is meant to be mostly ignored for all periods because, on the whole, I have much better ways to spend my time, energy, and attention. For those who haven’t read my previous discussions, here’s the short version:

Stocks are great for the long term (think: time horizon for 10+ years) but do not provide sufficient reward in the short term (think: time horizon of 3-5 years) to justify dominating your non-retirement portfolio.

An asset allocation that’s around 50% stocks and 50% income gives you fewer and shallower drawdowns while still returning around 6% a year with some consistency. That’s attractive to me.

“Beating the market” is completely irrelevant to me as an investor and completely toxic as a goal for anyone else. You win if and only if the sum of your resources exceeds the sum of your needs. If you “beat the market” five years running and the sum of your resources is less than the sum of your needs, you’ve lost. If you get beaten by the market five years running and the sum of your resources is greater than the sum of your needs, you’ve won.

“Winning” requires having a sensible plan enacted with good investment options and funded with some discipline. It’s that simple.

My portfolio is built to allow me to win. It is not built to impress anyone. So far it’s succeeding on both counts. I built it in two steps:

  1. select an asset allocation that gives me the best chance of achieving my goals. Most investors are their own worst enemies, taking too much risk and investing too little each month. I tried to build a risk-sensitive portfolio which started with the research on how much equity exposure – my most volatile niche – I needed. The answer was that 50% equities historically generated more than 6% annually with a small fraction of the downside that a stock-heavy portfolio endured.
  2. Select appropriate vehicles to execute that plan. My strong preference is for managers who:
    • have been tested across a lot of markets
    • articulate distinctive perspectives that might separate them from the herd
    • are loath to lose (my) money
    • have the freedom to zig when the market zags, and
    • are heavily invested alongside me.

My target asset allocation: 50% stocks, 50% income. Within stocks, 50% domestic, 50% international; 50% large cap, 50% small- to mid-cap. Within income, 50% cash-like and 50% more venturesome. I have an automatic monthly investment flowing to five of my nine funds. Not big money, but a steady investment over the course of decades.

So here’s where I ended up:

As it turns out, I inadvertently recreated the famous Vanguard Wellington balanced fund, as least for 2023:

Equity 2023 return Max drawdown Standard deviation Ulcer
Index
Sharpe
Ratio
Martin
Ratio
Yield

Snowball 2023 59% 14.3 -6.1 10.3 2.2 0.90 4.13 2.1%
Vanguard Wellington 66 14.3 -6.0 11.1 2.5 0.84 3.70 2.2

My non-retirement portfolio is invested in ten funds. Here’s the detail for the non-retirement piece:

  M-star Lipper Category 2022 weight 2023 weight 2023 return APR vs Peer MAXDD %
FPA Crescent 4 star, Gold Flexible Portfolio 22.0% 23 20.3 8.5 -6.2
Seafarer Overseas Growth and Income 5 star, Silver Emerging Markets 17.0 16 14.3 2.4 -11.3
Grandeur Peak Global Micro Cap 4 star, Bronze Global Small- / Mid-Cap 15.0 16 12.5 -2.4 -12.6
T Rowe Price Multi-Strategy Total Return 3 star, NR Alternative Multi-Strategy 9.0 10 5.1 -1.8 -0.4
Palm Valley Capital 3 star, neutral Small-Cap Growth 8.0 9 9.5 -7.7 -1.0
T Rowe Price Spectrum Income 3 star, Bronze Multi-Sector Income 7.0 6 7.9 0.1 -4.3
RiverPark Short Term High Yield 3 star, negative Short High Yield 6.0 6 5.6 -4.5 -0.2
Cash @ TD Ameritrade     6.0 <1.0 0 o
Brown Advisory Sustainable Growth 4 star, Silver Multi-Cap Growth 5.0 6.0 38.9 6.5 -9.6
Matthews Asian Growth & Income     5.0 0.0
RiverPark Strategic Income 4 star, negative Flexible   4.0 9.4 -2.4 0.5
Leuthold Core 5 star, Silver Flexible   4.0 11.7 -0.1 -4.2

Things to notice:

  1. Portfolio weights are virtually unchanged from 2022 to 2023.

    That reflects the fact that my strategic allocation hasn’t changed.

  2. I liquidated Matthews Asian Growth & Income.

    That’s a fund I bought when Andrew Foster was still the manager; it is an absolute model of sanity and reliability. Recently Matthews International has undergone a vast number of changes, with new executives and media people coming in, managers flowing out, funds being liquidated and ETFs being launched. Over the past five years, the fund has earned just under 1% a year. I concluded that (a) I was overweight on international and emerging stocks and (b) MACSX had the dimmest prospects going forward.

  3. I deployed most of my cash.

    The cash at Schwab wasn’t strategic, it was just a residue of an earlier transaction awaiting a new home. And I found one. Or two.

  4. I added Leuthold Core.

    I’ve always admired LCORX. The managers are exceptionally dedicated and risk-conscious. While it sits in the same “box” as FPA Crescent, its quantitative discipline sets it apart. It adds some fixed-income exposure to my portfolio and complements my own cautious style.

  5. I added RiverPark Strategic Income.

    I noted in our March 2023 issue I was in search of additional fixed-income exposure, and I’ve resolved to find a fund whose performance is not tied to the fate of the broad fixed-income market. That reflects two facts:

    1. My long-term strategic allocation is out of whack – I’m too exposed to international stocks and too little exposed to fixed income, so more fixed income is good.

    2. I think most bond strategies are stupid. Or, at the very least, they are mostly dependent for their success on a very hospitable external environment, which I doubt will describe the remainder of this decade.

    That led me to explore funds that bore the name “strategic income.” They were drawn from a half-dozen Lipper categories and used a dozen strategies, all with the goal of generating income independent of the broad investment grade bond market.

    Four funds stood out for their risk-adjusted performance over the past five years, including Osterweis Strategic Income and RiverPark.

The retirement addendum

My retirement funds are gloriously boring. The vast bulk of my assets are in two target-date funds. T. Rowe Price Retirement 2025, a low-cost five-star fund that regularly clubs its competition, and TIAA-CREF Lifecycle 2025 Retirement, a low-cost four-star fund that was the best Augie was offering. The latter fund will soon be renamed “Nuveen.”

The key driver of my retirement at this point is momentum. While I continue to contribute about 18% a year to retirement (leave me alone: I have a used Toyota, a small house, and a modest appetite), I’m close enough to the goal line that market forces rather than my additions are driving things. After the first day on which I lost $20,000, I stopped looking.

I have about 5% of my retirement in T. Rowe Price Emerging Markets Discovery, an EM value find, and about 5% in TIAA Real Estate Account. Real Estate had the second down year in its history in 2023 and I could imagine moving that money into a fixed annuity instead.

Bottom Line

You have no reason to envy my investments. I have no reason to envy yours. I don’t know how much my brother-in-law’s portfolio made. I don’t care whether I beat the market, I care about whether I have a good life and make a difference in the lives of others. My early modeling said that I needed to earn 6% a year, minimum, to have the resources to do all that. Happily, I’ve gotten there.

Touchdowns and Turnovers: MFO’s All-Star Picks for the Best US Equity Funds of 2023

By David Snowball

Touchdowns and Turnovers: MFO’s All-Star Picks for the Best US Equity Funds of 2023

Who will be the NFL MVP? The money is on Lamar Jackson of the Baltimore Ravens, declared “undeniably one of the most electric players in the league.” The 27-year-old had a passer rating of 102.7 with 3,678 yards, 24 touchdowns against seven interceptions, and played in all 16 games. He was magical. (At least until he faced the Steelers against whom he sports a 1-3 record or got to the playoffs.) For his accomplishments, he earned a quarter-billion-dollar contract.

Sadly, Mr. Jackson isn’t making you any money. Happily, another MVP Jackson might: Jackson Square Large-Cap Growth, a fund whose TDs-to-turnovers ratio in 2023 was untouchable.

Likewise, C.J. Stroud was recognized as the league’s Rookie of the Year. But no rookie in the fund world put up more compelling numbers than American Funds Capital Group US Value ETF.

In the spirit of Awards Season, MFO is proud to present its US Equity Fund Awards for 2023. Lots of people offer fund awards, but they’re mostly boring and based on stuff you could discern at a glance: “highest one-year returns by an emerging markets equity fund, highest three-year returns by an emerging markets equity fund …” We will instead follow the NFL’s lead and award:

  • Defensive Player of the Year
  • Defensive Rookie of the Year
  • Offensive Player of the Year
  • Offensive Rookie of the Year
  • Most Valuable Player of the Year

Finally, we will announce the rosters for the two Rookie All-Pro Teams.

Why offer awards?

These are not buy recommendations. These are funds that, in most cases, you’ve never heard of (though we have written about several). They represent an opportunity to learn about new strategies, discover new managers, and perhaps refresh your portfolio for 2024. Our selection criteria, detailed before each category, focused solely on 2023 performance. That’s the “of the Year” part. Some have faltered in the past, some might never see this level of performance again.

So two things: (1) it’s fun, people! Have some fun! And (2) it’s an excuse to learn something new. Embrace it!

Eligible funds included all US equity funds including OEF, ETF, and CEF investment funds; it excludes insurance products, funds with narrow sector focuses or reliance on cryptocurrencies, and funds made for trading or speculation. Finally, the funds had to be accessible to retail investors. That excluded funds with institutional minimums (GMO, for instance, has several promising new funds) or funds available only to a particular client group (for example, funds only available to a firm’s fund-of-funds).

MFO Rookie funds are those in existence for more than one year but less than two.

Defensive Player of the Year

Criteria: eligible funds placed in the lowest tier for 2023 maximum drawdown while scoring total returns of average to above. Among eligible funds, we looked for the highest return relative to peers.

Winner: Goodhaven Fund (GOODX)

GoodHaven Fund (GOODX) was launched in April 2011 by Larry Pitkowsky and Keith Trauner, two former associates of the iconoclastic Bruce Berkowitz, who manages Fairholme Fund. The fund had two good years, then a long stretch of lean ones. In 2020, they took a long hard look in the mirror and concluded that it wasn’t working. They concluded that they had been undercutting their own success, and their investors, with a series of misjudgments and rolled out a series of changes in late 2020. Manager Pitkowsky focuses more on quality than statistical value, on investing in “special situations” only when they were special, and exercising greater patience with good companies.

By Morningstar’s assessment, GoodHaven’s portfolio is characterized by dramatically higher quality names with higher growth prospects than its peers. That has corresponded with a period of dramatic outperformance in terms of total returns, downside management, and risk-adjusted returns.

Comparison of 1-Year Performance, 1/2023 – 12/2023

Name 2023 Return Maximum drawdown Downside deviation Ulcer
Index
Sharpe
Ratio
Sortino
Ratio
Martin
Ratio
GoodHaven 34.1 -6.7 5.8 2.3 1.92 5.00 12.6
Multi-cap value peers 12.7 -9.4 9.2 4.5 0.47 0.90 1.96

Defensive Rookie of the Year

Criteria: eligible rookie funds placed in the lowest tier for 2023 maximum drawdown while scoring total returns of average to above. Among eligible funds, we looked for the highest return relative to peers.

Winner: Distillate Small/Mid Cash Flow ETF (DSMC)

Distillate Small/Mid Cash Flow ETF launched in October 2022. DSMC is an actively managed exchange-traded fund that invests in small- and mid-capitalization companies. It is designed to offer investors exposure to an attractively valued portfolio of approximately 150 U.S. small- and mid-cap stocks that meet specific parameters involving reported and expected free cash flow and balance sheet quality.

The goal, akin to Goodhaven’s, is to live in the interest of quality and value. The managers argue that accounting rules have not kept up with the evolution of the global economy, “rendering many traditional measures of value, quality, and risk unhelpful.” In response they developed customized measures of value and quality and, to an extent, reconsidered the nature of “risk.”

Managers Jay Beidle and Matthew Swanson, founding partners of Distillate, previously worked for 10 and 18 years, respectively, as analysts and managers at Institutional Capital, LLC (ICAP), a Chicago-based value investment boutique.

This small core fund returned 29.4%, besting its average peer by 13.5%. More importantly, its maximum 2023 drawdown was -10.8%, while its average peer dropped 14.3% in the same period. Distillate has gathered $48 million in assets. The fund posted a smaller downside (that is, “bad”) deviation and had a lower Ulcer Index than its peers, though its standard (that is, day-to-day) deviation was about two points higher. Its risk-adjusted metrics (Sharpe, Martin, and Sortino ratios) were three to four times greater than its peers.

Comparison of 1-Year Performance, 1/2023 – 12/2023

Name 2023 Return Maximum drawdown Downside deviation Ulcer
Index
Sharpe
Ratio
Sortino
Ratio
Martin
Ratio
Distillate Small/Mid 29.4 -10.8 9.9 5.2 1.02 2.46 4.69
Small-cap core peers 16.0 -14.2 12.2 6.9 0.48 0.93 1.73

Offensive Player of the Year

Criteria: eligible funds placed in the highest tier for 2023 total returns while having a maximum drawdown no greater than average. Among eligible funds, we looked for the highest return relative to peers.

Winner: Value Line Larger Companies Focused (VALLX)

Value Line Larger Companies Focused launched in 1972. The manager invests in 25-50 large-cap ($10 billion and up) stocks. The distinguishing characteristic of the strategy is its use of the venerable Value Line Timeliness Ranking System to assist in selecting securities for purchase. The manager is “assisting by” but not “bound by” that system, so the highest-rated stocks might be excluded for other reasons.

Manager Cindy Starke has been with the firm since May 2014 and is one of the longest-tenured managers in the fund’s history. Ms. Starke began her investment career as a portfolio manager for U.S. Trust Company. She moved on with that investment team to become a founding portfolio manager at NewBridge Partners, which was acquired by Victory Capital Management in 2003 where she was a co-portfolio manager of the Victory Focused Growth Mutual Fund.

Value Line’s 59% return, which placed it in the top 2% of its Morningstar peers, bested its peers by 2700 basis points with no greater volatility. The fund’s risk-adjusted return ratings – Sharpe, Sortino, Martin – are a multiple of its peers.

Comparison of 1-Year Performance, 1/2023 – 12/2023

Name 2023 Return Maximum drawdown Downside deviation Ulcer
Index
Sharpe
Ratio
Sortino
Ratio
Martin
Ratio
Value Line Larger Companies Focused 59.1 -11.7 9.2 4.2 2.17 5.88 12.9
Multi-cap growth peers 32.4 -11.7 9.6 4.5 0.48 3.02 6.68

Offensive Rookie of the Year

Criteria: eligible rookie funds placed in the highest tier for 2023 total returns while having a maximum drawdown no greater than average. Among eligible funds, we looked for the highest return relative to peers.

Winner: American Funds Capital Group US Value ETF (CGDV)

American Funds Capital Group US Value ETF is an actively managed ETF that invests in dividend-paying stocks of larger established U.S. companies. One goal is to produce more income than its large-cap benchmark index. The portfolio currently holds about 50% with about 15% of the portfolio in small- to mid-cap stocks and 6% in international stocks.

The portfolio is focused on dividend-paying stocks but, in particular, on the stock of American companies “whose debt securities are rated at least investment grade … or unrated but determined to be of equivalent quality by the fund’s investment adviser.” That then serves as a marker of “established.”

The fund is managed, in the American Funds tradition, by a risk-conscious team of five who also share responsibility for some of American’s largest equity funds.

This equity income fund returned 28.8%, besting its average peer by 1,760 basis points. Its maximum drawdown was -7.35%, 21o bps better than its peers, and its Sharpe ratio was four times higher. The fund had lower risk scores (standard deviation, downside deviation, Ulcer Index and higher risk-adjusted returns (Sharpe ratio, Sortino ratio, Martin ratio) than its peers. The fund has not gone unnoticed, drawing $5.9 billion in assets since its February 2022 launch.

Comparison of 1-Year Performance, 1/2023 – 12/2023

Name 2023 Return Maximum drawdown Downside deviation Ulcer
Index
Sharpe
Ratio
Sortino
Ratio
Martin
Ratio
American Funds Capital Group US Value ETF 28.8 -7.4 6.0 2.8 1.70 3.94 8.44
Equity income peers 11.2 -9.5 9.1 4.6 0.40 0.78 1.81

Most Valuable Fund

Criteria: eligible funds are those that simultaneously appeared in the top tier for total returns and the top tier for the lowest maximum drawdown. Among eligible funds, we looked for the highest Sharpe ratio.

Winner: Jackson Square Large-Cap Growth (JSPJX)

Jackson Square Large-Cap Growth launched in 1993 as Delaware US Growth. Jackson Square acquired the fund’s assets in April 2021. The fund invests in companies with an equity capitalization of more than $3 billion and describes itself as benchmark agnostic, holding a concentrated, conviction-weighted portfolio. That last part (“conviction weighted”) is significant in light of a recent Morningstar study that says most active managers fail, not because they can’t select good equities but because they cannot weigh in the portfolio in a way that allows the whole to make sense. They currently hold 26 stocks.

The Jackson Square team aspires to “a concentrated portfolio of companies that have superior business models, strong cash flows, and the opportunity to generate consistent, long-term growth of intrinsic business value.”

The fund is managed by William “Billy” Montana and Brian Tolles. Mr. Montana joined Jackson Square Partners as an analyst in September 2014. Mr. Tolles joined as an analyst in February 2016 and was promoted to portfolio manager in January 2019. The fund’s longer-term record is muddied by turnover in management; Mr. Montana was one member of a five-person team in 2020, four of whom have now left the fund. Mr. Tolles, contrarily, has been on board for half a year.

Jackson Squares’ splendid 2023 performance is reflected in 51.5% return, which exceeds its peers by 1000 basis points, but more importantly by the refusal of the fund to decline in value. Their maximum drawdown of 2% is one-quarter of what their peers experience and their Ulcer Index (a measure of how far a fund falls and how long it takes to recover) is on par with a short-term bond fund’s.

Here’s the flag: This performance is out of line with the fund’s long-term record. That improvement might have been attributable to Mr. Tolles’ arrival, which would make the improvement sustainable. Alternately, the driver of the fund’s win might have been “in the third quarter of 2023 the Jackson Square Large Cap Growth fund received proceeds from a class-action settlement from a company that it no longer owns. This settlement had a material impact on the fund’s investment performance. This is a one-time event that is not likely to be repeated.” How substantially? On September 8, the fund’s NAV was $17.45. It opened on 9/11 at $18.62, a 6.7% gain at a time when peers were largely flat.

Here’s what that looked like, in comparison to Fidelity Contrafund.

Comparison of 1-Year Performance (Since 202301)

Name 2023 Return Maximum drawdown Downside deviation Ulcer
Index
Sharpe
Ratio
Sortino
Ratio
Martin
Ratio
Jackson Square Large-Cap Growth 51.5 -2.1 2.8 0.8 3.14 16.7 57.9
Large-cap growth peers 41.2 -8.1 7.3 3.1 2.06 5.04 12.1

The fund edged out a cohort of stars for the award, it was followed in the rankings by seven T. Rowe Price and Fidelity funds including TRP Blue Chip Growth ETF and Fidelity Contrafund. If you’re looking for an MVP with a better chance of repeating the feat, you should investigate runner-up T Rowe Price Blue Chip Growth ETF (TCHP).

Name 2023 Return Maximum drawdown Downside deviation Ulcer
Index
Sharpe
Ratio
Sortino
Ratio
Martin
Ratio
Jackson Square Large-Cap Growth 51.5 -2.1 2.8 0.8 3.14 16.7 57.9
T Rowe Price Blue Chip Growth ETF 50.1 -6.3 6.4 2.5 2.62 6.98 17.8
Large-cap growth peers 41.2 -8.1 7.3 3.1 2.06 5.04 12.1

TCHP is a non-transparent, active ETF run by the same manager, Paul Greene, responsible for the Blue Chip Growth Fund.

The Rookie All-Pro Team: The Top Rookie Equity and Allocation Funds of 2023

Finally, we searched MFO Premium for the complete roster of rookie stand-outs. Rookie funds are those with more than one year but less than two years in the league. We screened for rookies who earned their spot on the roster by combining top-tier risk-adjusted returns as well as peer-beating absolute returns. For the sake of simplicity, we separated equity from income funds.

Selection criteria: Rookie All-Pro funds had to finish in the top tier MFO Rating (“MFO Rating is the principal performance ranking metric used in the MFO rating system and found across most of the MFO Premium pages. It ranks a fund’s performance based on risk-adjusted return, specifically Martin Ratio, relative to other funds in the same investment category over the same evaluation period”) and Sharpe Ratio Rating. The All-Pro starters also had to score in the lowest tier of Ulcer Ratings; that signaled that they were best at (a) limiting downside and (b) recovering quickly from it.

ETFs have three- or four-character symbols, open-ended funds have five characters ending with “X”.

Symbol Name Lipper Category 2023 return APR vs Peer Ulcer Rating
WCFEX WCM Focused Emerging Markets ex China Emerging Markets 28.7 18.9 1
WXCIX William Blair Emerging Markets ex China Growth Emerging Markets 23.7 13.9 1
JHFEX John Hancock Fundamental Equity Income Equity Income 20.2 10.7 2
STXD Strive 1000 Dividend Growth Equity Income 15 5.4 1
PBDC Putnam BDC Income Financial Services 30.1 19.8 1
BKGI BNY Mellon Global Infrastructure Income Global Infrastructure 9.8 6.1 2
VMAT V-Shares MSCI World ESG Materiality and Carbon Transition Global Multi-Cap Core 28.8 12.6 2
TRFK Pacer Data and Digital Revolution Global Science / Technology 67 22.5 1
MEDI Harbor Health Care Health / Biotechnology 24.9 21.8 1
HAPI Harbor Human Capital Factor US Large Cap Large-Cap Core 30.3 7.3 2
PJFG Prudential PGIM Jennison Focused Growth Large-Cap Growth 54.1 14.1 1
QGRW WisdomTree US Quality Growth Large-Cap Growth 56 16 4
PFPGX Parnassus Growth Equity Large-Cap Growth 42.6 2.5 1
PJFV Prudential PGIM Jennison Focused Value Large-Cap Value 18.5 5.8 1
HSMNX Horizon Multi-Factor Small/Mid Cap Mid-Cap Core 23.4 9.8 1
FDLS Inspire Fidelis Multi Factor Mid-Cap Core 21.4 7.8 2
AMID Argent Mid Cap Mid-Cap Growth 31.1 11.2 1
WGUSX Wasatch US Select Mid-Cap Growth 30.9 10.9 2
WCMAX WCM Mid Cap Quality Value Mid-Cap Growth 28.7 8.7 1
RVRB Reverb Multi-Cap Core 26.8 7.3 2
DSMC Distillate Small/Mid Cash Flow Small-Cap Core 29.5 14.8 1
GSBGX GMO Small Cap Quality Small-Cap Core 32.5 17.8 1

The Rookie All-Pro Team: The Top Rookie Income and Alternatives Funds of 2023

Our last roster is the Income and Alts Rookie squad. Rookie funds are those with more than one year but less than two years in the league. We screened for rookies who earned their spot on the roster by combining top-tier risk-adjusted returns as well as peer-beating absolute returns. For the sake of simplicity, we separated equity from income funds

Selection criteria: Rookie All-Pro funds had to finish in the top tier MFO Rating (“MFO Rating is the principal performance ranking metric used in the MFO rating system and found across most of the MFO Premium pages. It ranks a fund’s performance based on risk-adjusted return, specifically Martin Ratio, relative to other funds in the same investment category over the same evaluation period”) and Sharpe Ratio Rating. The All-Pro starters also had to score in the lowest tier of Ulcer Ratings; that signaled that they were best at (a) limiting downside and (b) recovering quickly from it.

Symbol Name Lipper Category 2023 return APR vs Peer Ulcer Rating
SPCZ RiverNorth Enhanced Pre-Merger SPAC Alternative Event Driven 6.4 4.1 2
COIDX IDX Commodity Opportunities Commodities -4.5 3.4 1
PIT VanEck Commodity Strategy Commodities -3.4 4.5 1
AGRH BlackRock iShares Interest Rate Hedged US Aggregate Bond Core Bond 6.5 1.6 1
TTRBX Ambrus Core Bond Core Bond 5.8 0.9 1
ACSIX Arena Strategic Income High Yield 15.3 4.8 1
PBKIX Polen Bank Loan High Yield 14.5 4.1 1
HYGI BlackRock iShares Inflation Hedged High Yield Bond Inflation Protected Bond 11.8 9.3 2
BRLN BlackRock Floating Rate Loan Loan Participation 12.3 1.6 2
LONZ Allianz PIMCO Senior Loan Active Loan Participation 12.6 1.9 2
CGMS American Funds Capital Group U.S. Multi-Sector Income Multi-Sector Income 11.6 5.9 2
CGMU American Funds Capital Group Municipal Income Municipal General & Insured Debt 7 1.9 1
BUFQ First Trust FT CBOE Vest of Nasdaq-100 Buffer s Options Arbitrage / Strategies 35.4 18.3 1
UYLD Angel Oak UltraShort Income Short IG Grade Debt 7 2.1 1
CSHI NEOS Enhanced Income Cash Alternative Specialty Fixed Income 6.2 -13 1
CARY Angel Oak Income U.S. Mortgage 8.9 4.4 1
HIGH Simplify Enhanced Income U.S. Treasury General 7.6 4.3 1
BOXX Alpha Architect 1-3 Month Box U.S. Treasury Short 5.1 0.9 3
TBIL F/m US Treasury 3 Month Bill U.S. Treasury Short 5.1 0.9 3
TUSI Touchstone Ultra Short Income Ultra-Short Obligations 6.5 1.3 2
YEAR AllianceBernstein AB Ultra Short Income Ultra-Short Obligations 6 0.9 2

Devesh, “My friends think I’m (a little) crazy” 2023 portfolio review

By Devesh Shah

In this article, I would like to talk about how I am allocating my portfolio. I want to note that every single fund I have positively highlighted in my MFO articles is also one of my portfolio holdings. My money is where my mouth is, and you, the reader, get the good with the bad. Take what’s useful to you and throw away the rest.

Market background in Q4 2023

For 18 months, from Feb 2022 and Oct 2023, it was uniformly hard to own any major asset class. Then, on a given afternoon in October, the switch flipped. If investors squinted enough, we had gotten to a point where bonds had sold off enough to get to 5% yields, the S&P had gotten to a 15 multiple on earnings, and overall risk sentiment was sour. When the tide turned, the speed and breadth of US equities rallying in Q4 was too quick for most to adjust. I didn’t expect the turnaround. I was sure things would get worse.

Fortunately, the discipline of holding enough stocks despite my damp views, bailed me out. 2023 was looking bleak in August/September and ended great by the last week of December.

I made some changes to the portfolio at the beginning of December.

Equity Allocation:

Recognizing my own skepticism and that of others, I forced myself to increase my equity allocation to 65%. What did I buy?

I constantly compare Berkshire Hathaway, the S&P 500, and Fidelity Contrafund as the three solid assets to choose from at any point in time. Berkshire had done me well in most of 2022-2023 but solidly underperformed in Q4 2023.

I’ve written about Berkshire before, so I won’t elaborate this time. But my analysis left me with a strong conviction that Charlie Munger’s passing away and Buffett’s charitable giving of Berkshire stock were weighing down the stock.

Faced with underperformance from Berkshire, I decided in December to add to the stock as a way to get long the US equity market. Most of my US Equity allocation today is in Berkshire. I wrote about this in my January column as well. We shall see how it goes.

Outside the US Equity bucket, all of my International Developed Markets and Emerging Market Equities are Actively Managed.

In International Equities, I hold:

MOWIX: Moerus Worldwide Value Institutional: The team at Moerus, led by Amit Wadhwaney, is unapologetically value-focused and has done a fantastic job over the last few years. They have a global mandate but are mostly invested outside the US which fits my book for diversification.

SIVLX: Seafarer Overseas Value: Under Paul Espinosa, this fund is a slow and steady horse. It needs a better value climate to fully flourish.

In Emerging Market Equities, I hold:

India Private and Hedge funds: Through my friends at Mumbai-based, ChrysCapital Private Equity, and Singapore-based Duro India Opportunities Fund, India continues to be a substantial equity holding for me. However large sections of Indian equities look frothy and even pricier than US stocks. A new investor in India must wait for an external shock now and buy on corrections. Local money is captive and is gushing into stocks, and one needs to be very careful buying India here. If holding for 10 years, it’s ok, but people always have a long-term view and panic in the short run. Instead, wait for the panic to buy/add.

(Goldman Sachs)

In addition, I hold three mutual funds:

  1. APDYX: Artisan Developing World Advisor
  2. PZIEX: Pzena Emerging Market Value
  3. SIGIX: Seafarer Overseas Growth and Income

I consider Lewis Kaufman at Artisan to be a consummate Growth Equity investor. Rakesh Bordia at Pzena and Andrew Foster at Seafarer are the steady Value hands. Seafarer needs a wave of good luck. Andrew is one of the most even-keeled EM investors I’ve met. He will have his day in the sun soon. A balance of two growth and two value EM managers would be perfect. I need to look into and find an opportunity to add to GQGIX (GQG Partners Emerging Market Equities). Rajiv Jain is running the finest equity shop these days. This would be the 2nd of the growth managers I’d add.

I recently read in a Morningstar column by Adam Sabban, “It’s Official: Passive funds Overtake Active Funds”, that International Passive funds have now taken over International Active funds in AUM. That’s a mistake. International Passive is a dog with fleece. I was wrong 2-years ago when I thought Passive was the way to go everywhere. Passive is still ok in the US but a real problem in EM and internationally.

Small Cap Value:

I am not a good small-cap investor. I don’t understand how the market values very small companies. Everything looks tasty in small caps. I have no idea how to distinguish between two tar sands companies in Canada or coal producers in Indiana. Fortunately, I have Scott Barbee and Justin Harrison at Aegis Value (AVALX). I went to meet them in McLean, Virginia last November and was treated to a very nice Turkish lunch. We talked about Scott’s bullish views on commodities, his views on how ESG and woke investors have destroyed investor capital into tar sands and coal at the risk of energy independence for the world’s population, and why many companies in those sectors have free cash flow to mature their debt and buyback shares. All we need is for Oil prices not to collapse. They don’t have to go up; it’s enough if they stop going down. 

Aegis has been investing since 1998 and they’ve made a handsome return in small-cap value stocks. Being in small caps, the fund sometimes gets volatile and has drawdowns to match. One has to decide the right allocation and hold on to the fund for the long run.

I added Aegis under EM and International given its holdings are concentrated in Commodity stocks right now. I tend to think of commodities as an alternative to the US Dollar.

What I don’t own

Before I go into Fixed Income, I’d like to mention what I don’t own. I own no allocation-based funds and no funds with Options embedded in them (buffers, dividend income…). I do not own Crypto. I don’t own any leveraged or inverse funds of any kind. I don’t own any TIPS, any long-duration bonds, or any closed-end funds. Some of these I don’t own because I am trying to avoid them. For some others, I don’t know the products very deeply yet (Closed end).

I had a teacher in high school, a Sir Vadavkar, who used to tell us, THE MORE I KNOW THE MORE I KNOW THAT I DON’T KNOW.

I’ve come to respect his wisdom with age, and I want to keep things simple in my portfolio.

Fixed Income Allocation

Municipal Bonds: As a New York City resident taxpayer, I’ve had to deeply think about how I want to receive my income. (Just as an aside, I like Berkshire Hathaway not paying me dividends and distributions. If the company can find a way to use the cash wisely, it saves me a tax burden for now.)

My bond broker from Raymond James has stitched together a thoughtful portfolio of the most highly rated NY municipal bonds. The interest from them is triple tax exempt. Municipal bonds do not behave like US Government bonds. In a recession, when Treasuries rally, I do not expect Munis to rally. Muni bonds are like rental income from houses. The payments are safe and there is no tax due. About 15% of my assets are in Muni bonds.

Treasury Bills: I hold about 2 years of household expenses in Treasury Bills. I know I am conservative, but I prefer it that way. Most people hold about 3-6 months of expenses in T-Bills, but I have a huge preference for liquidity having spent too many years where there wasn’t any cash in the bank. About 10% of my wealth is in T-Bills.

Bond Funds: I hold 4 bond funds for 10% of my portfolio. All of them are known to the MFO community.

  1. CBLDX: CrossingBridge Low Duration High Yield Fund
  2. RSIIX: RiverPark Strategic Income
  3. APFOX: Artisan Emerging Market Debt Opportunities
  4. OSTIX: Osterweis Strategic Income

I like the low duration, high-quality managers, and high coupons from these funds. If I was a non-taxable entity, I would hold a lot more of my wealth in these funds. As a NY resident, ordinary income from these funds is punitive. Ordinary income is taxed at high rates and increases my tax brackets. A certain fund manager I’ve interviewed before likes to make fun of me for trying to manage my tax bill. Be patient, my friend. I have young kids who need new shoes all the time. I need a few more years.

If I could add in one place, where would I add?

I find commodity stocks cheap. I’ve seen them much cheaper and much more expensive than their current price. But I feel that the combination is different this time. They are working off debt and buying back stock and have a large free cash flow. Unfortunately, I don’t have the confidence to buy commodity stocks like Buffett has confidence in buying Occidental. There are days when I do thank myself for knowing I am stupid and not going with my instincts. But I can do better, and more research is called for.

What do my friends say I am doing wrong? What are my friends doing that’s different?

“All of it”. “It’s not enough that I win, my friend must fail 😊”…they say

Some of my friends think that my equity exposure, especially US equity exposure is too high. They find Berkshire Hathaway too complicated to analyze. They are ambivalent about the mutual funds.

They find US stocks prohibitively expensive. They like international stocks. “Find my names that don’t report their annual statements in English.” They like Japan, especially corporate restructuring, and value Japan. They like Mexico.

Within the US, they like Russell 2000, which has been on the short side of the Tech-small cap long-short hedge fund trade. They believe if the equity market continues to hold up, the Russell has to start playing.

That’s all folks!

Happy portfolios are all alike; every unhappy portfolio is unhappy in its own way.

Briefly Noted . . .

By TheShadow

Updates

Vanguard is introducing new and enhanced intergenerational wealth and legacy planning capabilities through a partnership with Vanilla, an innovative provider of digital estate planning tools and solutions. The offer was successfully piloted to a small group of eligible advised clients in Vanguard Personal Advisor Wealth Management over the past year and will scale to provide ultra-high-net-worth Vanguard investors with a powerful visualized approach to help manage and achieve their current and future estate planning objectives.

Eligible Vanguard Personal Advisor Wealth Management clients will work directly with their advisors to leverage Vanilla to build integrated visualizations of their net worth, powerful asset transfer diagrams, estimated tax calculations, ongoing estate monitoring, and the ability to model the impact of further estate planning scenarios.

Matthews Asia Funds revolving door of managers continues. Poster ProtonAnalyst33 noted that Sharat Shroff left the Matthews Pacific Tiger and India funds.  Other Matthews Asia managers, including John Paul Lech (EM Equity and Emerging Markets ex China Active ETF) and Taizo Ishida (Growth, Innovators, and Japan) left on the same day, 19 December 2023. Citing “a transforming strategy roster, personnel turnover, and a big decline in assets,” Morningstar has downgraded Matthews from being an Above Average advisor down to merely an Average one. For the sake of all involved, we hope 2014, The Year of the Dragon, is a prosperous one for a once-storied franchise.

SMALL WINS FOR INVESTORS

Hartford International Equity Fund will reopen to new investors on March 20. The fund is rated three stars by Morningstar.

JP Morgan Equity Income Fund reopened to new investors on January 15. The fund is rated three stars by Morningstar.

On January 30, 2024, Vanguard launched Vanguard Intermediate-Term Tax-Exempt Bond ETF (VTEI) and Vanguard California Tax-Exempt Bond ETF (VTEC), two index municipal bond ETFs managed by Vanguard Fixed Income Group. Each ETF charges 8 basis points (0.08%) for its services which Vanguard calculates to be less than one-third of “the average expense ratio for competing funds.”

CLOSINGS (and related inconveniences)

Invesco Small Cap Value will close to new investors on April 1, 2024.

OLD WINE, NEW BOTTLES

The Macquarie Group is rebranding the name of numerous Delaware equity and bond funds. The name Delaware will be removed for numerous funds being rebranded with the name of Macquarie. The name change will take effect on December 31, 2024.

Neuberger Berman U.S. Equity Index PutWrite Strategy Fund has been converted into an ETF.

OFF TO THE DUSTBIN OF HISTORY

AlphaCentric SWBC Municipal Opportunities Fund will be liquidated on or about February 27.

Cohen & Steers Alternative Income Fund will complete liquidation on or about February 26, 2024

Global X is liquidating a bucketload of ETFs:

  1. Global X MSCI China Industrials ETF
  2. Global X MSCI China Communication Services ETF
  3. Global X MSCI China Financials ETF
  4. Global X MSCI China Energy ETF
  5. Global X MSCI China Materials ETF
  6. Global X MSCI Next Emerging & Frontier ETF
  7. Global X MSCI Portugal ETF
  8. Global X MSCI Pakistan ETF
  9. Global X MSCI China Consumer Staples ETF
  10. Global X MSCI China Health Care ETF
  11. Global X MSCI China Information Technology ETF
  12. Global X MSCI China Utilities ETF
  13. Global X MSCI China Real Estate ETF
  14. Global X Carbon Credits Strategy ETF
  15. Global X Health & Wellness ETF
  16. Global X Green Building ETF
  17. Global X China Biotech Innovation ETF
  18. Global X Cannabis ETF
  19. Global X Metaverse ETF

Global X also withdrew its application for a spot bitcoin ETF on 30 January 2024. A dozen other advisers launched such funds in January, with BlackRock’s iShares Bitcoin Trust reaching $2.7 billion in AUM by month’s end.

Notwithstanding the buzz of ETFs for the rescue, the price of Bitcoin fell in January and fell substantially (by about $5,000 per coin) from the day that the funds launched.

North Square Advisory Research Small Cap Growth Fund will be liquidating its assets with the goal of completing such process by the close of business on February 12, 2024.

The Rice Hall James Small Cap Fund is expected to cease operations and liquidate on or about February 29, 2024. 

The Rondure Overseas Fund will be liquidated on or about February 8.  Assets under management have declined over the years making it not beneficial to operate the fund.

“As of the close of business on January 31, 2024, the Upright Assets Allocation Fund, Upright Growth Fund, and Upright Growth & Income Fund will close to new investments.” While the announcement doesn’t say “in advance of euthanasia,” between them the three funds have $23 million in assets and four stars.