Monthly Archives: December 2021

December 1, 2021

By David Snowball

Dear friends,

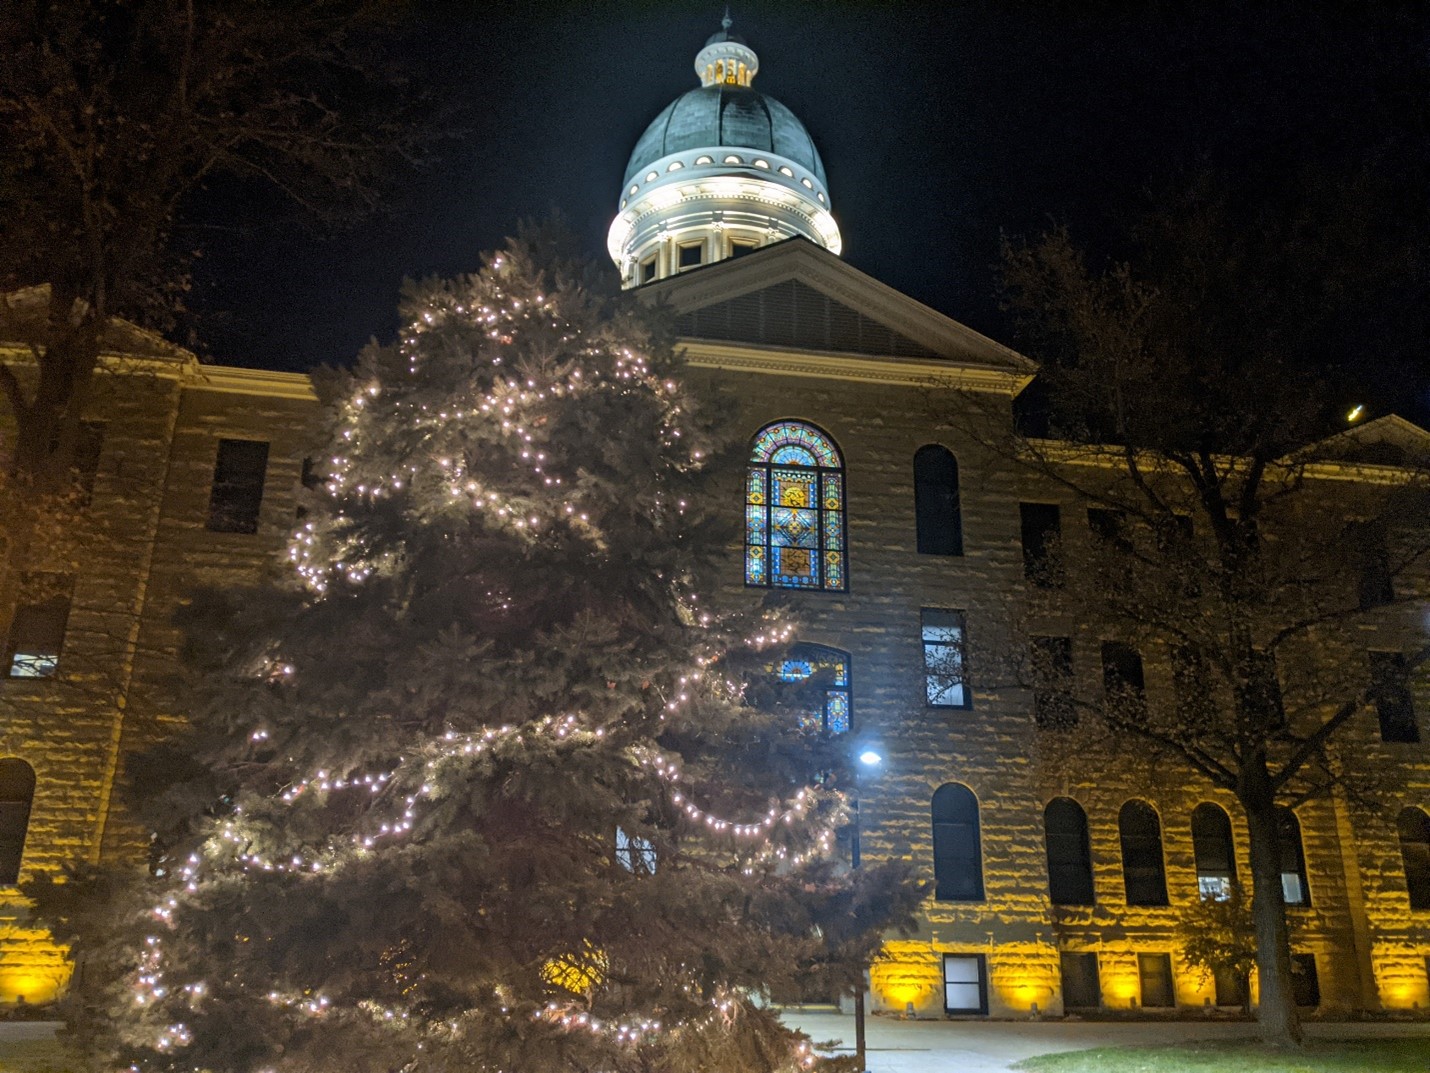
It’s December and Augustana’s Christmas tree is newly lit. Like the college, the tree is pretty humble but still a source of light and comfort at a time when both are welcome.

In memoriam: Nicholas F. Burnett (1956-2021)

This letter is rather shorter than usual. I learned this morning that my best friend of nearly 50 years, Nicholas Burnett, professor emeritus at Sacramento State, was being removed from life support. A young man (well, my age), Nick was admitted to the hospital on the day before Thanksgiving. His body was worn and failing. His wife, Debbi, assured me this morning, “he knows. He’s ready to go.” They were surely among the hardest words she’s spoken, and the saddest I’ve heard. An hour later Debbi held his hand and his sojourn here ended.

And my brain was scrambled.

I’ll always remember his passion for educating, his restless and often undisciplined intellect, and his booming greeting (he routinely boomed), “Snowbeast!” I’ll remember the morning in our grad school apartment – we lived above an abandoned gas station in Belchertown, Massachusetts – when he (in a booming voice) threatened to defecate on my pillow if I ever woke him so rudely again. (Bach at 8:00 a.m. was involved.) And I’ll always regret the miles and the pandemic that kept us apart in recent years.

The lesson, I suppose, is this: don’t hesitate. Don’t hesitate to say, “I love you.” Don’t hesitate to pick up the phone. Don’t hesitate to tell someone what a difference they’ve made. Don’t hesitate to find time for each other, for you never know when that time will be ended.

In memoriam: Samuel S. Stewart Jr. (1942 – 2021)

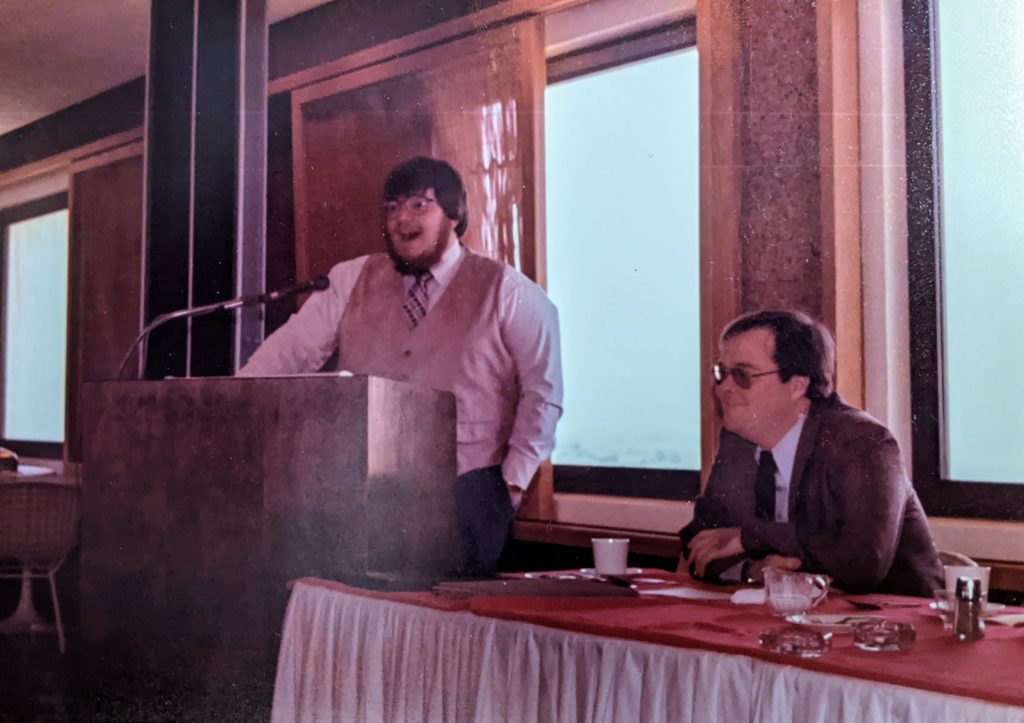
Sam Stewart died at his desk on November 23, 2021.

Mr. Stewart founded the Wasatch Funds in 1975. When Mr. Stewart turned 75, he reached an agreement with Wasatch which allowed him to take two of their funds (he managed Strategic Income (WASIX), he and son Josh Stewart co-managed World Innovators (WAGTX)) with him. Seven Canyons was founded in 2017 by Spencer Stewart, another of Mr. Stewart’s sons who was previously a portfolio manager of Grandeur Peak Emerging Markets Opportunities Fund (GPEOX). In announcing Spencer Stewart’s departure, Grandeur Peak’s CEO Blake Walker reported that “Spencer Stewart has decided to follow his heart and pursue a new path.”

Utah is now home to 34 mutual funds from five families: Wasatch (1975), Summit Global / SGI (2010), Grandeur Peak (2011), Rondure Global (2016), and Seven Canyons (2017). All of those, except for Summit, grow from Mr. Stewart’s work. Thirty-two of those folks and four of those families, owe their existence to his decision to hire, mentor, empower and teach young professionals.

More than just “a financial wizard” (though that, too), he was sire to “a large, rowdy, and loving family,” an advocate for the arts, a philanthropist, and a professor. Stewart is survived by his wife, Diane; his brother, seven children, two stepchildren, and 11 grandchildren. Rowdy and loving, indeed.

We’re grateful for all he’s done, and we wish his family great peace.

Thanks

To our 2,078,884th reader. You know who you are, and you’re entirely welcome. We hope you stay a while, kick back, maybe chat with folks on the board.

To David Sherman and the folks at Cook & Bynum for the start of my winter reading pile. I’m hopeful of being snowed in and settling in to learn more about China and dark arts. (Umm, those are separate books.)

Thanks to our faithful contributors this month: Kevin, Binod (it’s good to know you’re here), the folks at S&F Investment Advisors (serious about the fund profile offer, really), Wilson, Thomas from San Francisco, Radley, the Lees, Rae, the Buttons, Paul, and John H. And, most especially, to our subscribers: Gregory, William, Brian, David, William, and Doug.

MFO’s next chapter

I announced in May my intention to step aside, at year’s end, from my role as MFO publisher. I had hoped to find a partner who would continue MFO’s mission as a non-profit, non-commercial champion for small investors and small investment managers. I have had hours of conversations with journalists, fund trusts, bloggers, managers, business schools, and journalism programs, but have not yet succeeded.

So here’s the plan: we will publish our January 2022 issue, as usual, then the Observer will go on hiatus.

What does that mean? Good question!

  1. MFO will remain live, open, and free. We have a modest financial reserve that will cover the costs of servers, security, and so on. That means all 10+ years of content remains available. In addition, I aspire to post the occasional new piece. When I do, we’ll share word via Twitter and our email list.
  2. Our discussion board will remain alive and vibrant. There are a lot of smart and snarky people there.

You should join them. I’ll continue to moderate and, as often as I can, contribute.

  1. MFO Premium will grow even stronger. MFO Premium already offers three huge advantages over (not to mention names) Morningstar. 
    3.1 It seamlessly integrates comparisons of open-end funds, ETFs, closed-end funds, and other securities in the same screener. The web version of Morningstar separates funds from ETFs, and the ETF screener is pretty sorrowful.
    3.2 It is ridiculously cheap. A seat at Morningstar Direct costs about what a small car does. MFO Premium is $120.
    3.3 It is hugely responsive to reader needs and interests. Can you imagine the response you’d get if you called Morningstar and asked Joe to rewrite the screener to incorporate something intriguing to you? Charles does that very thing regularly. We will continue to offer monthly improvements.

Joyeux noel, we’ll see you again soon!

david's signature

A Fine Kettle of Fish

By Edward A. Studzinski

“There is no such thing as a former KGB man.”

          Vladimir Putin, 2004

Another month passes and we make the discovery that our current bout of inflation is not going to be as transitory as the Administration and the Federal Reserve were telling people at the beginning of summer. Paying $45 to fill up the car with gas or a turkey that costs 50% more than it did a year past was hard to ignore. Some commentators, me included, think that this will go on for at least fifteen to eighteen months. An issue that impacts adjusting

“We tend to use [ transitory] to mean that it won’t leave a permanent mark in the form of higher inflation. I think it’s probably a good time to retire that word and try to explain more clearly what we mean.” Jerome Powell, 11/29/2021

to it is that those under forty have not seen anything like this before and have been conditioned to believe a smiling face standing behind a podium and giving a press briefing. I however can remember an IRA investment in the early ’80s that was paying a 12% interest rate (which compounded would double the investment over six years).

In the background, one hears the gentle beating of war drums, as hints of an armed conflict with China over a potential invasion of Taiwan keep surfacing in the mainstream press. It matters not that in every wargaming scenario that has been played out at places like the Naval War College, such a conflict has resulted in disaster for United States forces. Given that the Chinese always take the long view of things, with time as one of their main allies, I am in the camp that thinks that such a conflict would not be an armed conflict, but rather an economic one. China continues to be a large purchaser of gold bullion every year. At this point, they are thought to have accumulated somewhere between 20,000 – 40,000 tons of gold. Our holdings in Fort Knox are thought to be somewhere between 8,000 – 9,000 tons of gold. Can we maintain our status as a reserve currency if China decides to back its currency with gold? For those countries not believers in modern monetary theory it will present an interesting question.

And then there is the question of energy. Germany shuts down all its nuclear power generating stations as France embarks on a building campaign to increase its dependency on nuclear power. Germany looks to replace nuclear with Russian gas coming through a pipeline, no mind the political risk thereof. Nuclear power is in many respects the green solution to global warming except for a bias against nuclear power. How to reconcile that dichotomy?

The United States has gone in a little more than a year from being a major exporter of oil and liquified natural gas, to needing to import energy. The solution – release petroleum from our strategic energy reserve. A release is announced, in conjunction with the actions of several of our allies to also release petroleum. We released an amount equal to two days of our oil consumption in this country. OPEC, rather than increasing production will keep it flat. Ergo, the release of our strategic reserves is at best a political gesture having the equivalent effect of a fart in a windstorm. Add to that a Federal Reserve Chair who finds his voice and starts to speak about the need for a continued tapering of bond purchases (read as – “rates must go up”) and it becomes apparent that cash is in, equities and bonds are not.

The New Variant

Our hope is that Omicron does not prove to be the genesis of coal in everyone’s stocking this Christmas. And one hopes that the message that can be imparted will be based on science AND a correct exposition of the statistics involved. We now have vaccines developed with multiple methodologies of acting and producing an immune response to the Covid virus. We are also seeing new therapeutics. One hopes that the New Year brings an appreciation of how best to live with this virus, as with other viruses, over the long term. Roosevelt was prescient and did speak for the ages when he said, “There is nothing to fear but fear itself.”

Building a Multi-Strategy Portfolio – Fidelity Traditional IRA

By Charles Lynn Bolin

I love reading the monthly discussions from Mr. Bolin. He is providing very useful information month after month. They’re always so insightful and analytical, yet it can be difficult to construct a portfolio because each month brings some new funds and different analyses. It would be very useful if he would have some specific portfolios and update recommended changes when he thinks it’s necessary. This month’s catastrophe portfolio is compelling, and one I may invest in for the long term. As a retiree of many years, it’s just what I want.

– MFO Discussion Board by golub1

I share a personal traditional IRA at Fidelity that I have constructed following Fidelity’s business cycle approach heavily influenced by the risk management philosophy from Mutual Fund Observer. Each investor’s needs are different, and this portfolio is part of a bucket approach as I near retirement with pensions. My Safety Bucket has three years of living expenses, followed by Buckets of conservative Traditional IRAs where taxes will have to be paid, a Bucket for a more aggressive Roth IRA managed by Fidelity where taxes have already been paid, and an after-tax account still in planning.

My strategy is to keep income low after retirement and prior to having to draw required minimum distributions in order to convert a portion of the traditional IRAs to Roth IRAs. After the Closing is a list of articles and references about the funds covered in this article.

1.     Reminder of the Long Term Historical Performance

With valuations relatively high, “less than transitionary” inflation, the Federal Reserve tapering QE, and the potential for bond rates to rise, returns are likely to be lower over the next decade similar to the two twenty year time periods where the Dow Jones Industrials was essentially flat as shown in Figure #1. The economy grew, but valuations declined.

Figure #1: Dow Jones Performance Fifty-Year Performance from the 1960s

2.   Fidelity’s View of the Business Cycle

Earnings growth seems to have peaked for this cycle, and forward valuations are coming down as well. This is a typical transition in the cycle, which suggests that the rapid ascent of stock prices slows from here…

Fidelity

The following chart from Mid-Cycle Inflection Point by Jurrien Timmer at Fidelity shows typical patterns when the business cycle enters the middle stage of the business cycle. Earnings continue to grow at a slower rate, valuation multiples compress, and volatility increases. Mr. Timmer goes on to point out that tapering bond purchases could result in bond rates rising which would favor value over growth.

Figure #2: Mid-Cycle Performance

Source: Fidelity

The Middle Stage of the business cycle is typically the longest. Consumer staples, health care, and utilities typically do well in the middle and late stages of the business cycle.

3.    Universe of Funds

For this Fidelity Traditional IRA portfolio, I created a Watch List in Mutual Fund Observer Multi-Search Tool of one hundred funds available no-load and with no transaction fees available at Fidelity. They represent 68 different Lipper Categories. Fifty-nine of the funds carry the MFO Great Owl classification. There are 28 Fidelity mutual funds, 40 exchange-traded funds, with the remainder being mutual funds from other fund families. To select the funds, I used the Fidelity Fund Pick List, MFO Risk, MFO APR, MFO Rating, Lipper Preservation, Ferguson Mega Ratio, and Reamer Ratings as shown in the table below.

Table #1: Fidelity 100 Watchlist Metrics

Rating (Best=5) MFO Risk APR Rating MFO Rating Lipper Preservation Lipper Consistency Ferguson Mega Ratio Reamer
1 13 2 1 0 4 3 3
2 24 9 1 7 10 11 4
3 12 18 16 9 10 13 5
4 45 44 44 37 26 30 16
5 6 27 38 44 47 32 30

Source: Created by the Author using MFO Premium screener and data

The Reamer Rating is the quintile ranking of the percentage that a fund’s 3-year rolling returns beat the rolling returns of its category peers over the past 10 years. It is named after Brian Reamer, a Wisconsin-based financial adviser, who uses it to help assess fund performance consistency. The Ferguson Mega Ratio is named after Brad Ferguson of Halter Ferguson Financial, a fee-only independent financial adviser based in Indianapolis, and measures consistency, risk, and expense-adjusted outperformance. Lipper Preservation rating reflects a fund’s historical loss avoidance relative to other funds within the same asset class.

I estimated the typical returns of the funds over the next four years based on average returns by business cycle stage since 1998 if there are two years of mid-cycle performance, one year of late-stage performance followed by a bear market. Core funds (“Steady Eddy”) are funds that I expect to do relatively well over the completion of the business cycle with low drawdown. “Core with a Tilt” funds (such as sectors) are also funds that I would be willing to hold through a bear market, but would probably adjust allocations down. “Rotation funds” are typical late-stage funds (mostly bonds) where investors begin cutting back on risk assets. I include some “Defensive but Not Bearish” Funds that I would consider owning as a recession appears more certain. Finally, there are funds that do well during a recovery but may be highly valued at this time as shown by the returns over the past two years.

Table #2: Fidelity 100 Watchlist By Fund Role

Purpose Description Count Mid thru Bear Cycle COVID Bear 2020 Return Two Year Price / Book
Core Hold through a bear market 17 8.9 -9.9 15.5 7.0
Core with Tilt Hold through a bear market but tilt allocations (ie sector funds) 16 11.5 -17.9 18.6 7.5
Rotation Late stage rotation to lower risk funds 37 6.3 -7.4 5.5 4.2
Defensive Defensive but not bearish funds 8   0.0 14.4  
Recovery Funds with inflated values best owned in the recovery stage 22 15.1 -17.1 31.7 10.8

Source: Created by the Author using MFO Premium screener and data

4.   Overview of Selected Funds

Table #3 contains the funds in my Fidelity Traditional IRA. The majority of the funds are “buy and hold” (Core), with five funds that I may rotate over time. Standpoint Multi-Asset Fund (REMIX) is less than two years old, so I will monitor it. The symbols shaded blue have the MFO Great Owl classification. All funds are rated four star or higher by Morningstar except REMIX (Not Rated), CRAAX (3 Stars), and FSRRX (2 Stars).

Table #3: Fidelity Traditional IRA Fund List

Source: Created by the Author using MFO Premium screener and data

For the middle stage of the business cycle, I am interested in funds that have higher risk-adjusted returns with some momentum. Trend EMA 10 Month shows how the funds are performing relative to their 10-month exponential moving average. They are sorted from highest to lowest. We are now in an inflationary environment and some funds will perform differently as measured by the Percent of the S&P 500 captured. The funds are rated Conservative (MFO = 2) to Moderately Aggressive (MFO Risk = 4). A final check is how the fund has done over the past several years to determine if there is still room to grow. Fidelity Select Medical Technology and Devices (FSMEX) has risen substantially over the past three years which is of concern. T. Rowe Price Multi-Strategy Total Return Fund has low returns year to date, but I hold it for the downside protection.

Table #4: Fund Metrics and Ratings – Life of Fund

Source: Created by the Author Using Mutual Fund Observer

To be diversified, an investor needs to own, not just more funds, but funds that are not correlated. Table #5 shows that FMSDX, FFFDX, FSRRX, TRRIX, NWFFX and FLPSX are more correlated to one another while CTFAX, TMSRX, REMIX, FSMEX, CRAAX, and EAPCX are less so.

Table #5: Correlations – 1.8 Years

Source: Created by the Author using Portfolio Visualizer

5.    Fidelity Traditional IRA

The Portfolio is 33% domestic stocks, 17% international stocks, 40% bonds, 6% short-term investments (cash), and 4% other (commodities). Columbia Thermostat (CTFAX) is currently 90% bonds and will increase allocations to stocks in a bear market. Fidelity Target Retirement 2020 will become more conservative over time.

I used Portfolio Visualizer to compare this portfolio to one that maximizes return at 10% volatility, one that maximizes the Sharpe Ratio, and Fidelity Asset Manager 60% stock. In general, the Portfolios have lower drawdown and slightly higher returns than the Fidelity Asset Manager 60% Fund. The advantage is that there are funds that will have lower drawdowns during bear markets when I have to start taking required minimum distributions. Funds that have a large drawdown during the next few years represent an opportunity to convert to a Roth IRA. The link to Portfolio Visualizer is here. Note that this Portfolio is more aggressive than I would have held two years ago. At that time, with falling interest rates, I preferred bonds.

Figure #3: Portfolio Growth

Source: Created by the Author using Portfolio Visualizer

Investors who want to be more aggressive than I am may choose to allocate more to those funds in the Maximum Return at 10% Volatility Portfolio, while those who want to be more conservative may choose allocations closer to the Maximize Sharpe Ratio Portfolio.

Table #6: Fidelity IRA Allocations and Performance Metrics

Symbol Name Alloca-tion Maximum Return at 10% Volatility Maximum Sharpe Ratio Weights Fidelity Asset Manager 60%
FMSDX Fidelity Multi-Asset Income 18% 20% 20%  
CTFAX Columbia Thermostat A 10% 15% 15%  
FFFDX Fidelity Freedom 2020 10% 15%    
FSRRX Fidelity Strategic Real Return 10%      
TMSRX T. Rowe Price Multi-Strtgy Ttl Ret 11% 15% 15%  
TRRIX T. Rowe Price Retirement Balanced 10%   15%  
REMIX Standpoint Multi-Asset Investor 9% 10% 10%  
FSMEX Fidelity Medical Tech and Devcs 5% 5% 5%  
NWFFX American Funds New World F1 5% 5%    
FLPSX Fidelity Low-Priced Stock 5%      
CRAAX Columbia Adaptive Risk Allocation 4% 5% 10%  
EAPCX Parametric Commodity Strategy Investor 3% 10% 10%  
  RETURNS
  3 Month 0.3% 0.4% 0.7% -0.2%
  YTD 10.0% 10.3% 10.3% 7.8%
  1 year 20.6% 20.8% 19.7% 19.3%
  Annualized Return (CAGR) 15.6% 16.8% 16.0% 15.1%
  METRICS
  Standard Deviation 10.6% 10.0% 9.1% 13.9%
  Max. Drawdown -10.5% -9.1% -8.0% -14.2%
  Sharpe Ratio 1.4 1.6 1.7 1.1
  Sortino Ratio 2.5 3.1 3.3 1.7

Source: Created by the Author using Portfolio Visualizer

6. Closing

I have simplified my Vanguard Traditional IRA with a “buy and hold” strategy with a few funds for rotation with the business cycle. The Fidelity Traditional IRA described in this article consists of funds that are managed more tactically to let the fund managers do the heavy lifting for me. I can download the Fidelity Watchlist of one hundred funds from Mutual Fund Observer and rank them in a matter of minutes.

Laissez les bons temps rouler!

Let the Good Times Roll!

7.  Additional Information Resources

The following table contains articles describing the funds in the Fidelity Traditional IRA Portfolio. The funds were selected based on my belief that they will perform well going forward.

Table #7: Articles about Funds

Symbol References
FMSDX Comparing Fidelity Strategic and Multi-Asset Income Funds (FMSDX, FSRRX)
CTFAX Tactical Sleeve for the Conservative Minded
FFFDX Retrospection is a Hard Metric to Match Target Retirement Section
FSRRX Comparing Fidelity Strategic and Multi-Asset Income Funds (FMSDX, FSRRX)
TMSRX T. Rowe Price Multi-Strategy Total Return (TMSRX)
TRRIX One Stop Shop Mutual Fund Options With Good Multi-Year Metrics
REMIX Standpoint Multi-Asset Fund: Forcing Me to Reconsider
FSMEX Fidelity
NWFFX Morningstar
FLPSX Fidelity
CRAAX Uncorrelated Funds for Building a Low Risk Portfolio
EAPCX Best No-Load Mutual Funds Available At Fidelity

Source: Created by the Author


Osterweis Growth and Income Fund (formerly Osterweis Strategic Investment Fund), (OSTVX)

By David Snowball

At the time of publication, this fund was named  Osterweis Strategic Investment Fund.

Objective and strategy

The fund pursues the reassuring objective of long-term total returns and capital preservation. Osterweis starts with a strategic allocation that’s 50% equities and 50% bonds. In bull markets, they can increase the equity exposure to as high as 75%. In bear markets, they can drop it to as low as 25%. Their argument is that “Over long periods of time, we believe a static balanced allocation of 50% equities and 50% fixed income has the potential to provide investors with returns rivaling an equity-only portfolio but with less principal risk, lower volatility, and greater income” achieved through the compounding of reasonable gains and the avoidance of major losses.

Both equity and debt are largely unconstrained, that is, the managers can buy pretty much anything, anywhere. That means that the fixed-income portfolio might at one point contain a large exposure to high-yield securities and, at another, to Treasuries. The equity portfolio is composed of companies with sustainable competitive advantages, particularly those likely to deliver consistent dividend growth, whose stocks are undervalued or out-of-favor.

Because they don’t like playing by other people’s rules, the Osterweis team does not automatically favor intermediate-term, investment-grade bonds in the portfolio.

Since 2017, the fund’s equity exposure has ranged from about 60-70%. They currently hold 40 stocks, the vast majority of which Morningstar recognizes as having a defensible economic “moat.”

Adviser

Osterweis Capital Management. Osterweis Capital Management was founded in 1983 by John Osterweis to manage money for high-net-worth individuals, foundations, and endowments. The firm has 58 employees and $7.7 billion in assets under management in 2021. They manage both individually managed portfolios and five mutual funds. Osterweis once managed hedge funds but concluded that such vehicles served their investors poorly and so wound them down in 2012. The firm is privately held, mostly by its employees.

Managers

The fund is managed by a team of five portfolio managers.  Founder John Osterweis and co-CIO Carl Kaufman remain from the team of eight portfolio managers that launched the fund. Eddy Vataru joined Osterweis in 2016 and is an investment-grade fixed-income specialist. Larry Cordisco and Jim Callinan are both equity guys with distinguished careers at other shops. Mr. Cordisco was a co-manager for Meridian Contrarian Fund (2012-18) and, for almost a decade before that, one of the fund’s equity analysts. Mr. Callinan has one of the longest and most distinguished records of any active small growth manager. He was a cover-story manager when he was at Putnam OTC Emerging Growth Fund (1994-96), then Morningstar domestic equity Manager of the Year during his years with Robertson Stephens Emerging Growth and its RS-branded successor funds (1996-2010).

Management’s stake in the fund

Two of the five team members, Messrs. Osterweis and Kaufman, had investments in excess of $1 million in the fund. Mr. Cordisco has a modest investment, while the remaining managers have not chosen to invest in the fund. On whole, seven of Osterweis’s 11 managers have made personal investments in the fund.  As of the latest Statement of Additional Information, none of the fund’s independent trustees (who are very modestly compensated for their work) had an investment in the fund. Two of the five had no investment in any of the Osterweis funds they oversee.

Opening date

August 31, 2010

Minimum investment

$5000 for regular accounts, $1500 for IRAs, and other tax-advantaged accounts.

Expense ratio

0.97% on assets of $167 million (as of 7/18/23).

Comments

For many of us, there is a time in life when investing is a game and we approach it with all of the intensity and seriousness of fantasy football. A little shibu inu today along with a slice of the VIX, some cloud computing tomorrow plus three irresistible GameStop trades. Maybe short Cathie Woods and long Elon Musk next week and … hey, what’s this “fractional ownership of fine art” thing about?

Osterweis Growth & Income is a fund for people who’ve gotten over “the stock market as a game” fantasy and want to get on with their lives while entrusting their money to managers who don’t flirt with NFTs. Its aim is to be a more flexible alternative to the rigid 60% large caps / 40% investment-grade bonds that doesn’t lose sight of the fact that you’ve entrusted part of your financial future to them. They take that trust very seriously.

Why consider Osterweis Growth and Income?

There are two reasons. First, Osterweis makes sense in an uncertain world. Osterweis Growth & Income is essentially the marriage of the flagship Osterweis Fund (OSTFX) and Osterweis Strategic Income (OSTIX) with a twist. OSTFX is primarily a stock fund, but the managers have the freedom to move decisively into bonds and cash if need be. In the last 10 years, the fund’s lowest stock allocation was 60% and its highest was 96%, but it tends to have a neutral position in the upper-80s. Management has used that flexibility to deliver solid long-term returns (13% over the past decade) with 13% less volatility than the stock market’s. The equity selection in the Growth and Income Fund is born from the same investment philosophy and process as the Osterweis Fund, but with a greater emphasis on stocks that can deliver long-term dividend growth. Mr. Cordisco describes it as “quality at a reasonable price, with a dividend growth focus.” Their hope is that they select corporations whose dividends grow steadily by the high single digits. Osterweis Strategic Income (OSTIX) plays the same game within the bond universe, moving between bonds, convertibles and loans, investment grade and junk, domestic and dollar-denominated foreign. This plays hob with its long-term rankings at Morningstar, which has placed it in three very different categories (convertibles, multi-sector income, and high-yield bonds) over the past 12 years but now benchmarks all of its trailing returns as if it had been a high-yield bond fund all along.

Second, Osterweis Growth & Income has done a remarkably good job for a long while. The managers have resumes that date back 20 to almost 40 years. They’ve managed through a vast array of economic conditions and market states. They come across as smart, thoughtful, and disciplined, which has allowed them to succeed across market cycles and which gives investors some confidence that they can continue doing it.

Below is a quick snapshot of the judgments reflected by the three major fund analysts: MFO, Morningstar, and Lipper. In each of the first eight rows, funds are rated on a five-point scale with five being the highest. The last two rows are text-based.

The record reveals a consistent and important pattern. Osterweis Growth and Income is consistently a top-tier fund, in both its Morningstar and Lipper peer groups, dating back to its launch 11 years ago. It produces strong absolute returns and top-tier risk-adjusted returns across all three periods.

At the same time, it is not a timid fund. The managers seek to accept rational risk, often by embracing investments at precisely the moment that other investors flee. That creates long-term opportunities, though at the price of short-term volatility.

The 0.94% ratio (as of the most recent prospectus) has been dropping steadily and is at the lower end for an active allocation fund, strikingly so for a small one.

Bottom Line

If you believe that the market, like the global climate, seems to be increasingly unstable and inhospitable, it might make sense to invest with folks who are neither dogmatic nor still learning on the job. The team at Osterweis qualifies. “The opportunity set in fixed income is,” Mr. Cordisco notes, “not as robust.” A positive view of the US economy (“no major headwinds, no energy shortages, no mortgage crisis”) had led the team to cautiously overweight equities while at the same time recognizing that investors “should probably think about playing a little more defense. March/April 2020 was time for aggression. It’s a bit too manic now.” They’re finding “a lot of opportunities underneath the indices” in quality firms (think “Visa”) that have gotten pummeled. Still, they’re vigilant of “pockets of mania.”

It is easy to dismiss Osterweis Growth and Income Fund because it refuses to play by other people’s rules; it rejects the formulaic 60/40 split, it refuses to maintain a blind commitment to investment-grade bonds, its stock sector-, size- and country-weightings are all uncommon. Because rating systems value herd-like behavior and stolid consistency, independent funds may sometimes look bad. And yet, over time, Osterweis gets it right far more often than not. Osterweis Strategic Income has the highest Sharpe ratio in its Lipper peer group over the past 15 years, Growth & Income has the seventh-highest in its peer group since inception and Osterweis Fund is in the top 20% of its Lipper peer group over the past 15 years. The fund’s fixed-income portfolio, embodied by the Osterweis Strategic Income Fund, has managed a negative down-market capture over the past 15 years; that is, it rises when the bond market falls, then rises some more when the bond market rises. That’s doing business differently … and well. Given reasonable expenses, outstanding management, and a long, solid track record, Osterweis Growth and Income warrants a place on any grown-up investor’s due-diligence shortlist.

Fund website

Osterweis Growth & Income Fund, whose homepage links to their quarterly webinar and most recent video interviews.  Folks trying to gain a broader understanding of the firm’s approach might be interesting in their most recent investment outlook or the Insights page to read perspectives from all of their portfolio management teams.

© Mutual Fund Observer, 2021. All rights reserved. The information here reflects publicly available information current at the time of publication. For reprint/e-rights contact us.


Early Cycle Metrics and Expanded MultiSearch Headers

By Charles Boccadoro

One of the earliest articles in my tenure with MFO was entitled “Ten Market Cycles.” It characterized the risk and return metrics of the S&P500 during full market cycles (comprising bear and bull markets) beginning in the mid-1950s. This piece evolved through the years using month-ending instead of day-ending prices, making it a little easier to see the big picture, and adding new cycles. The series, if you will, is summarized here:

When this series began, we were about fives years into the bull market that emerged from the Great Financial Crisis [GFC]. It began in March of 2009. Most of us were still smarting from the 50% market drawdown of the GFC, as well as reminded of a similar drawdown caused by the Tech Bubble just a decade earlier. These two drawdowns book-ended the 2000’s and gave rise to the decade’s pejorative adjective: “lost.”

The metrics only dated back to the mid-1950s. I rationalized it represented more modern market history. Also, Lipper’s database only dates back to 1960. The U.S. Securities and Exchange Commission [SEC] was established in 1934, the aftermath of the Wall Street Crash of 1929, and is intended to help prevent market manipulation. Similarly, the Investment Company Act of 1940 enables federal regulation of investment trusts and counselors to help protect investors.

There have been subsequent measures: the Sarbanes-Oxley [SOX] Act to improve the accuracy and reliability of corporate disclosures, helping protect investors against fraud, like the Enron scandal. The Dodd-Frank Wall Street Reform and Consumer Protection Act, which imposed a sweeping overhaul of the United States financial regulatory system in response to the 2008 GFC.

Despite these well-intended “safe-guards,” there is no guarantee the S&P500 will not one day fall greater than 50%, even to levels not seen since the Great Depression. Here are two related pieces that touch on such occurrences: 

The last piece reminds readers that the NASDAQ drew down a bit more than 80% in 2002, about the same as the S&P500 did in 1932. For a brief but terrifying time in March 2020, it certainly felt like the potential drawdown knew no bounds. In some asset classes, like real-estate and transportation, it was true. At that time, I promised to incorporate the early cycle data into MultiSearch.

Many of the tools and analytics on the MFO Premium site were motivated to examine, based on historical returns only, just how bad things can get. These moments are lost frankly in the geometric returns of the S&P500 this past century … and impressive 10.5% per year, fortunately for investors in the US market. And while our database prior to 1960 includes only indices for the S&P500, Long US Government Bond, and 3-Month T-Bill, the tools reveal max drawdown, best and worst rolling averages, deviations, and correlations, which are key to setting expectations going forward. 

“Early” here refers to the three US equity market cycles occurring before those published in previous studies. They are nicknamed: E1) Great Depression [192909 To 194605], E2) Post WWII [194606 To 196112], and E3) JFK-LBJ [196201 To 196811].

Below are the Early Cycle Returns for the Preset Mixed Allocation SP500/LGovBnd indices. These are in units of annualized percent return unless the period is less than 1 year; in which case, as with Post WWII and JFK-LBJ bear markets, the table shows absolute percent return.

MultiSearch now includes dozens of Display (evaluation) periods, which are described in the Definitions page. They are also described in the expanded MutliSearch page (click on circled + sign) or by hovering over column headers.

To help make the identification easier, we expanded the headers with more descriptive titles. We’ve also organized the return period columns as follows: Calendar Year, Monthly, Yearly, Decadal, Market Cycles, Unique Period, Calendar Decade, Early Market Cycles. You can select any or all via the Groups button on the MultiSeach Results table.

Please enjoy the latest data and features!

Launch Alert: Brown Advisory Sustainable Small-Cap Core (BIAYX)

By David Snowball

On September 30, 2021, Brown Advisory launched their Sustainable Small-Cap Core Fund which is based on their Sustainable Small-Cap Core Strategy, which targets high-net-worth individuals and institutions, launched in July 2017. The goal is long-term capital appreciation. The strategy is to create a concentrated, ESG-screened “best ideas” portfolio populated by small-cap growth and value stocks.

Brown Advisory describes the strategy this way:

The fund’s investing approach seeks outperformance through a concentrated, low-turnover portfolio of companies with:

      • Best-in-breed business models
      • Attractive valuations
      • Strong or improving sustainable opportunities, stemming from underlying Sustainable Drivers from a company’s products, services, or operations

Sustainable Drivers are characteristics that we believe have potential to drive tangible positive outcomes, in terms of financial performance and environmental and social impact. We believe that our integration of fundamental and ESG research adds an informational edge to our investment process that helps us identify high-quality investments.

Brown has a 30-year record in sustainable investing which is far more than just “green” investing. Questions of board diversity, shareholder rights and business ethics, data security, human capital, and equity & inclusion enter into the equation.

The fund is managed by Timothy Hathaway and Emily Dwyer, with Kenneth Coe III, serving as an associate portfolio manager. Mr. Hathaway helped manage the Small Cap Growth strategy for nine years before being promoted to having responsibility for “equity and fixed income research, portfolio management, and institutional sales and service.” (At least we think that’s a promotion. As a former administrator, Snowball is slightly dubious.) Ms. Dwyer is a senior ESG equity research analyst responsible for ESG integration across Brown Advisory’s institutional equity strategies. Her previous gigs included time at Parnassus Investments, Sustainalytics, and the UN Environmental Programme Finance Initiative. She appears to be a rising star. Mr. Coe, the associate manager, appears to be a very nice person.

To be clear: I’m really excited about the prospects for this fund.  

There are two primary drivers of that enthusiasm. Its elder sibling, Brown Advisory Sustainable Growth (BIAWX), kicks butt. The fund has returned 21.5% annually over the past nine years – 370 bps better than its peers – and has the highest Sharpe rating and lowest Ulcer Index of any fund in its 152-member multi-cap growth peer group over that period. It is among the five best funds in risk management: downside deviation, down market deviation, bear market deviation, and maximum drawdown. As part of MFO’s endorsement of sustainable investing, I bought shares of BIAWX in my personal portfolio and it has been my top-performing fund.

– and –

Its doppelganger, Brown Advisory Sustainable Small-Cap Core Strategy, kicks butt. The strategy composite has returned 19.8% annually since inception, 500 bps per year better than its peers, which places it in the top 10% performance of small-core performers. It has an attractive risk profile with a beta of 0.80, a downside capture ratio of 90% paired with an upside capture of 105%, and a smaller maximum drawdown. As befitting a sustainable approach, it sports a vastly smaller portfolio carbon footprint than its peers.

The Investor share class of the fund has a minimum initial investment of $100, and the opening expense ratio is capped at 1.09%. The Institutional share class has marginally lower expenses and a vastly higher minimum. The fund’s webpage is understandably lean, but the strategy’s website offers a fair richness of data and insights.

Launch Alert: T. Rowe Price Total Return ETF (TOTR)

By David Snowball

On September 30, 2021, T. Rowe Price launched the T. Rowe Price Total Return ETF. The fund is a not-quite-clone of the successful T. Rowe Price Total Return Fund (PTTFX). The strategy behind the fund and ETF start with the same two assumptions:

  1. U.S. core fixed income allocations remain a building block of a diversified portfolio for many investors. Traditionally a low-to-negative correlation with the equity market made bonds an automatic volatility buffer, and they kick off a reliable stream of income that retired investors need.
  2. The Bloomberg U.S. Aggregate Bond Index is defective, and those defects then carry over into the $ 1.2 trillion of fund and ETF assets linked to it. Those linkages can be direct (an index fund that tracks The Agg) or indirect (an active bond fund that is benchmarked to The Agg).

What problems? The Agg, by design, tracks (1) investment grade, (2) taxable, (3) US, (4) fixed-rate bonds. This would be great … if this were 1964 because that collection of requirements defined a vibrant portfolio that broadly reflected the ancient fixed income universe. That’s no longer the case, with The Agg excluding huge swaths of assets (floating rate, asset-backed, non-IG, non-dollar denominated) that might be fundamentally more useful than an index trapped in the highest-quality (70% AAA-rated) but lowest yield (exposure to ultra-safe US Treasuries has doubled from 20% of the index before 2008 to 40% now, with yields of 1.45 – 1.8% for the 10- and 30-year bonds) corner of the market. Finally, only very large issues – generally a minimum issuance of $1 billion – is required for inclusion.

T. Rowe Price tries to address those problems by creating a strategy that consciously balances the virtues of a high-quality investment-grade portfolio with the opportunities offered by gaining access to smaller, more challenging but potentially more profitable fare.

T. Rowe Price’s latest portfolio review gives a snapshot of where The Agg invests and where, contrarily, they’re finding opportunities.

So, far lower exposure to US Treasuries and investment-grade corporates, comparable exposure to mortgage-backed securities and significant exposure to bank loans, high yield bonds, mortgage-backed securities not issued by government bodies, EM corporations, and collateralized loan obligations.

That exposure is dynamic rather than static. Depending on market conditions, the managers could eliminate their substantial exposure to bank loans or double their EM corporate exposure. All investing involves risk, with unconstrained investing involving some risks that other strategies don’t entail. The two keys to judging whether the risks of the fund are acceptable, come down to understanding the managers and their records.

The fund is managed by Chris Brown and Anna Dreyer. He’s head of securitized product investing, she’s head of risk and portfolio construction research for Price. Between them, they have 33 years of experience, and they’re supported by nine other fixed-income managers on the fund’s advisory committee. In addition, they co-managed the T. Rowe Price Total Return Fund, the open-end fund from which this ETF was cloned.

Their record is solid. Here’s a snip of the fund’s basic information since inception.

Higher total returns than its core-bond peers (0.5% per year higher) and substantially higher than its benchmark (1.2% per year higher). The decision to overweight risk assets is reflected in higher volatility (maximum drawdown, standard deviation, downside deviation, MFO Risk) but you’ve been compensated for that volatility. T. Rowe Price outperforms both its peers and its benchmark when you look at risk-return metrics such as the Sharpe ratio (where higher is better) and Ulcer Index (a measure of how far an investment falls and how long it takes to recover, where a lower score is better).

In short, bold-but-cautious management, first-rate adviser, decent income (2.4%), strong record. It’s especially reassuring that the fund’s strongest outperformance came in the two years, 2018 and 2021 YTD, when its benchmark and peer group posted losses while this fund posted gains.

Fund or ETF? The ETF is marginally less expensive than the fund – about 15 bps – though the ETF currently sells at a small premium to its NAV. The ETF might be more tax-efficient and allows you to skip the minimum initial investment. The differences are marginal but might favor the new T. Rowe Price Total Return ETF (TOTR).

The ETF’s homepage is understandably a bit thin on content, which the mutual fund is pretty rich. 

Emerging Markets Without China

By David Snowball

China has long been the driver of returns in the emerging markets, both because it is the largest emerging market and because the fortunes of other emerging economies are inextricably linked to China through trade, investment, and direct competition.

After a substantial correction which, at its worst, wiped $1.5 trillion in market cap off the books, China’s cheerleaders are speaking up. In August, BlackRock argued that China wasn’t really emerging and that investors should triple their exposure to Chinese equities. They then launched a mutual fund for Chinese investors, which drew $1 billion in its first week. Sadly, though, domestic investors have committed only $10 billion to BlackRock’s China funds:

In case you weren’t paying attention, in late November, BlackRock upgraded Chinese stocks, saying “the time to position in China is now.”

Fidelity echoes BlackRock’s enthusiasm. “China’s recent commotion is just business as usual,” they aver. Xiaoting Zhao, portfolio manager of Fidelity Emerging Asia Fund, allows that “some of the[reform] measures and execution of the regulation may be a bit rough in the beginning, but I believe they will improve in the medium term.” Perhaps not coincidentally, Fidelity was the second foreign firm – behind only BlackRock – to be permitted to open a mutual fund for Chinese investors.

Vanguard has filed to launch a new fund, Vanguard Select China Stock Fund. The plan is to split the assets between Baillie Gifford and Wellington Management. The fund will charge a relatively hefty 0.83%. Polen China Growth, also in the pipeline, will have competent and shareholder-oriented management teams.

What’s not to love?

The enthusiasm for China investing is driven by one economic reality (there’s a huge amount of money to be made there, if only by the fund companies) and two articles of faith:

  1. China is a “normal” country, nice people whose highest goal is economic security, transparent financial markets, and consumer celebration.
  2. Chinese officials will quietly manage away any challenges in their evolution toward normality.

To be clear, the case of investing in China becomes tenuous if either of those happy assumptions is disproven. The most prominent voice challenging them is George Soros.

At the heart of this conflict is the reality that the two nations represent systems of governance that are diametrically opposed. The U.S. stands for a democratic, open society in which the role of the government is to protect the freedom of the individual. Mr. Xi believes Mao Zedong invented a superior form of organization, which he is carrying on: a totalitarian closed society in which the individual is subordinated to the one-party state. It is superior, in this view, because it is more disciplined, stronger and therefore bound to prevail in a contest.

Relations between China and the U.S. are rapidly deteriorating and may lead to war. Mr. Xi has made clear that he intends to take possession of Taiwan within the next decade, and he is increasing China’s military capacity accordingly.

He also faces an important domestic hurdle in 2022, when he intends to break the established system of succession to remain president for life. He feels that he needs at least another decade to concentrate the power of the one-party state and its military in his own hands. He knows that his plan has many enemies, and he wants to make sure they won’t have the ability to resist him.  (“Xi’s Dictatorship Threatens the Chinese State,” Wall Street Journal, 8/14/2021)

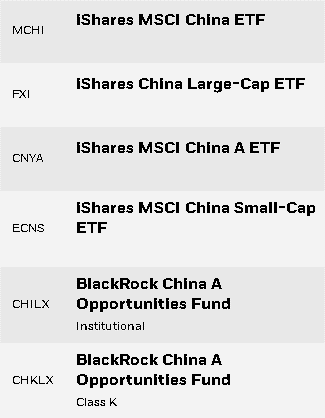
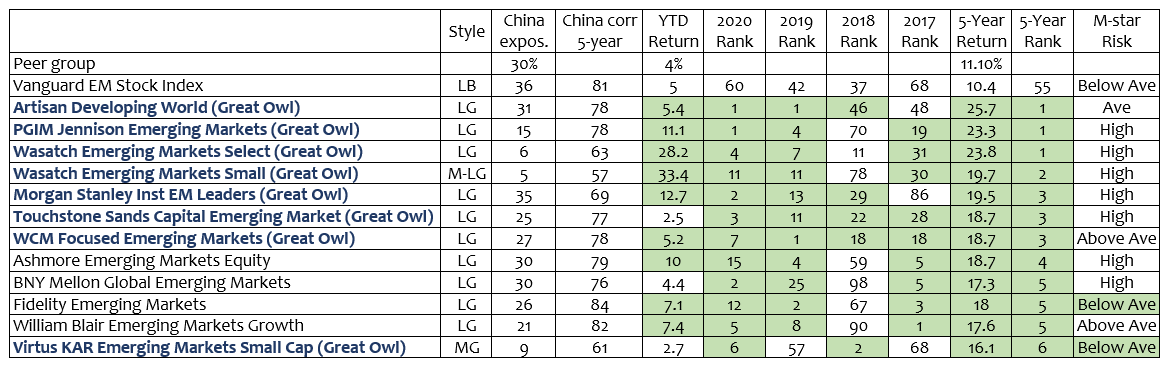
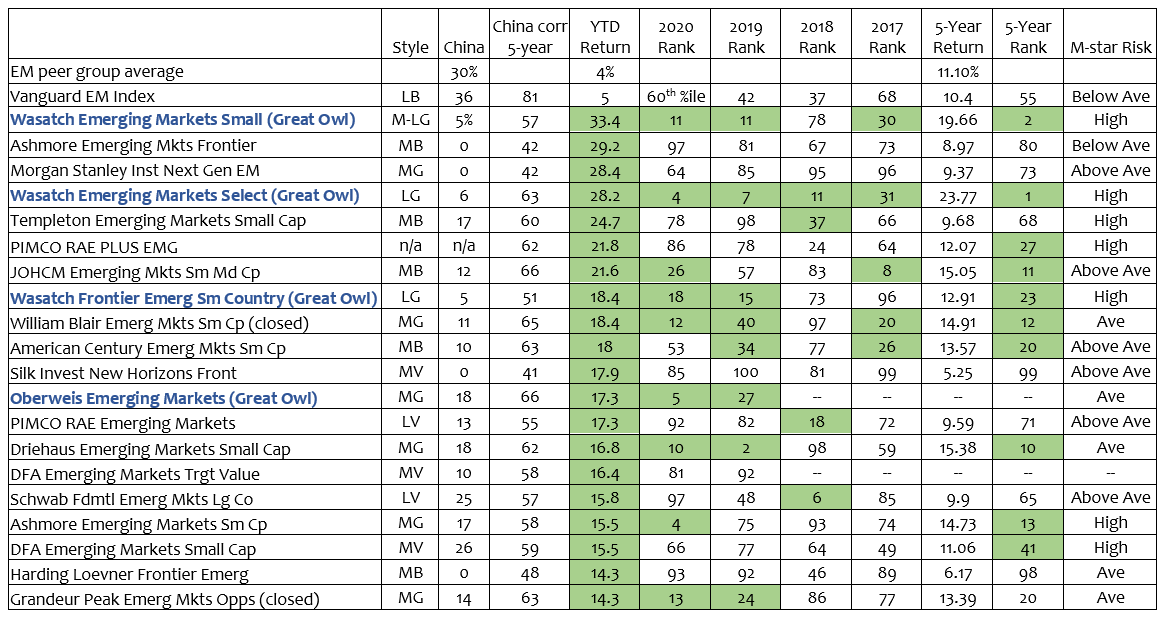
Google “Xi Jinping power” and you’ll find some reputable people (and a bunch of idiots) who work with the same set of concerns: President Xi has amassed more power than any Chinese leader since Mao (who was, one notes, responsible for the deaths of 65 million Chinese in his own drive for national power and purity), is intent on gathering more and is not driven by the desire to be a normal, market-oriented, middle-class country.

In general, the combination of unchecked power and a messianic vision has ended poorly. It does not require “evil genius” to send nations off a cliff, simple boneheadedness is generally enough. Barbara Tuchman’s The March of Folly: From Troy to Vietnam (1984) is not her best book but it’s a fairly sobering discussion of two questions, “Why do holders of high office so often act contrary to the way reason points and enlightened self-interest suggests? Why does intelligent mental process seem so often not to function?”

While the word “Soros” appears nowhere on the BlackRock website (feel free to search it), they did offer two responses to Mr. Soros. First, on CNBC a BlackRock spokesman assured viewers that “Through our investment activity, US-based asset managers and other financial institutions contribute to the economic interconnectedness of the world’s two largest economies” (“BlackRock responds to George Soros’ criticism over China investments,” CNBC, 8/8/2021). And, second, they launched a billion-dollar fund, adding that “it believes it can help China to address its growing retirement crisis by providing retirement system expertise, products, and services” (CNBC).

That’s in line with an observation made by the Wall Street Journal in 2020: “China Has One Powerful Friend Left in the U.S.: Wall Street” (it’s a fascinating article, for those with paid access, authored by Lingling Wei, Bob Davis, and Dawn Lim, 2/2/2020). Not everyone in the financial community shares the general gluttonous commitment to China and more China. In summer we noted Andrew Foster’s incredibly thoughtful reflections on China’s divergence from the path to normalcy. We noted last month, Robert Gardiner of Grandeur Peak shared a cautious, “keeping our eyes on the exit” perspective. This month, Laura Geritz of Rondure Global Advisors notes that

We believe the world is witnessing the emergence of a new political chapter in China’s history …. Xi has positioned himself to rule unbound by the reform minded restraints of the past 40 years. What will he do with the power? We are beginning to see. (“Chinese Dreams, American Dreams and Pure Fantasia,” 3Q21)

Where do that leave emerging markets investors?

Excellent question!

The most successful EM funds of the past decade share two distinguishing characteristics: (1) a focus on large-cap growth stocks and (2) substantial exposure to China. The table below shows the 12 highest-return diversified EM funds and ETFs of the past five years, through mid-November 2021.

It illustrates four clusters of values: (1) investment style – mostly Large Growth with one fund at the edge of Midcap Growth and Large Growth; (2) exposure to China, as measured by both direct investments in China and by the fund’s correlation to a pure China ETF; (3) the fund’s performance in absolute and relative terms and (4) Morningstar’s assessment of their relative riskiness. The Lipper EM equity peer group and Vanguard’s venerable EM index fund are included as benchmarks.

Any cell with above-average performance is shaded in green.

Funds designated “Great Owl funds” by MFO are those that have posted consistently top quintile risk-adjusted returns for all measurement periods longer than one year. They highlight funds that have shown strong risk-adjusted returns and have done so consistently.

Contrarily, the most successful EM funds of 2021 share two distinguishing characteristics: (1) a decisive share away from Large and Growth and (2) vastly reduced exposure to China. The table below shows the 25 best EM funds of the past five years, through mid-November 2021.

Bottom line

Investing is an inherently risky activity. The key to success is to understand and calibrate the risks you’re taking. We suspect that overweighting investments in an increasingly megalomaniacal regime might incur rather more risk than BlackRock and other apologists admit to. Similarly, an exclusive commitment to large + growth might be akin to skating to where the puck was, rather than to where it’s going to be.

Fortunately, a China-light portfolio is not inconsistent with double-digit long-term returns. If you share Mr. Soros’ concerns, your due-diligence list might incorporate the funds – especially the Great Owls – highlighted above.

Elevator Talk: Scott Gates, Friess Small Cap Growth Fund (SCGNX)

By David Snowball

Since the number of funds we can cover in-depth is smaller than the number of funds worthy of in-depth coverage, we’ve decided to offer one or two managers each month the opportunity to make a 300-word pitch to you. That’s about the number of words a slightly-manic elevator companion could share in a minute and a half. In each case, I’ve promised to offer a quick capsule of the fund and a link back to the fund’s site. Other than that, they’ve got 200 words and precisely as much of your time and attention as you’re willing to share. These aren’t endorsements; they’re opportunities to learn more. 

In the Days of the Giants, funds felt no need for names that laid out their strategy in numbing detail. No Deutsche X-trackers MSCI Emerging Markets High Dividend Yield Hedged Equity ETF. Certainly not VegTech Environmental Impact and Plant-Based Innovation ETF. No. One word would say it all, evoking strength, resolution, and history. Acorn. Oakmark. Sequoia. Magellan. Pioneer, Wellington.

And Brandywine. Foster Friess, acclaimed “one of the century’s great investors” by CNBC, founded Friess Associates in 1974, launched the Brandywine Fund in 1985, grew the firm to $16 billion in AUM, then sold the firm to AMG in 2001 and retired. The firm’s professionals bought the firm back in 2013, but Brandywine Fund merged into the AMG Managers Brandywine Fund at that time. In March 2021, AMG made a strategic decision to no longer utilize non-affiliated sub-advisors and terminated Friess Associates as Brandywine’s sub-advisor (they also dispatched DoubleLine Capital, Fairpointe Capital, and Loomis Sayles in the same purge). AMG swiftly renamed Brandywine the AMG Boston Common Global Impact Fund under the management of a new affiliated sub-advisor offering a new investment strategy.

Quite apart from all of that drama, Friess was investing in small, fast-growing companies on behalf of high-net-worth individuals and institutions. Those investments were driven jointly by the insanely research-intensive approach that’s at the core of the Friess strategy and by the work of manager Scott Gates.

Friess Small Cap Growth Fund started life as the Friess Small Cap Trust in August 2002. The Trust was moderately successful, returning 8.7% annually from 2002-2017, while its benchmark Russell 2000 Growth index returned 10.7%. It converted to a mutual fund on June 1, 2017. Mr. Gates took responsibility for the trust in 2012 and the mutual fund in 2017.

Mr. Gates joined Friess in 2003 after stints as an options trader (1989-1991), currency trader (1991-96), then equity analyst at Gardner Lewis (1997-2003). He’s now the firm’s Chief Investment Officer. He argues that those earlier roles, which were much more about risk management than return management, shape his work today.

My leadership perspective was shaped over decades in a range of roles, from foreign currency trading to hedge fund portfolio management to the kind of fundamentals-driven stock selection process that I oversee today. While Friess Associates is an established firm, we adopted an employee-ownership structure in 2013 to inspire a start-up mentality and encourage teammates to embrace each client’s success as a personal obligation.

It would be easy to look at Morningstar’s three-star / negative rating for Friess Small Cap Growth, shrug, and say “nothing to see here, move along.” It would also be unwise to do so. Two things occur to us about the fund. First, its investments are very, very different from its presumed peers’. The fund currently has a 51% stake in microcap stocks, while its Morningstar peers risk just 3% there. At the other extreme, it has only 6% in midcaps while its peers have 28%. In consequence, its average market cap ($1.5 billion) is only one-fourth of its peers. Its stocks trade at far lower valuations and the fund has an extraordinarily high active share (a statistical measure of independence from its benchmark) of 97. In short, Morningstar might be comparing a microcap core fund with a nearly midcap growth group.

Second, the performance of Friess Small Cap Growth matches or exceeds the performance of some awfully distinguished peers. Over the past four years (technically the fund is just over four years old), the fund has returned 20.9% annually, placing it just ahead of Baron Small Cap, Fidelity Small Cap Growth, William Blair Small Cap Growth, Virtus KAR, Vanguard Explorer and other first-tier funds. All are being outpaced by a market that rewards risky, lower-quality stocks. On whole, earning 21% annually for a relatively rational portfolio feels like rather more than a three-star performer.

Rather than guess about what Mr. Gates is thinking, we posed the same question to him that we do to all managers: “before you launched SCGNX, we already had 250 small-cap growth funds on the market, many with a record of more than a half-century. Why on earth do we need one more?” Here are Mr. Gates’ 300 or so words, explaining his rationale.

Let’s get it out of the way upfront: Friess Small Cap Growth Fund will underperform. The market moves for all kinds of reasons, and we don’t change our approach to suit them. That means the Fund is unlikely to lead the next speculative charge or sidestep the next sweeping downturn.

We’re comfortable accepting that our investment strategy can be out of step at times because we’ve tested the underlying premise behind it for the better part of five decades. While broad factors move “the market” for fleeting periods, investors always return to evaluating each company on its individual merits over the long haul.

Public companies are in business to make money for their shareholders. That’s why we value earnings performance as the ultimate measure of a company’s success. We capitalize on the relationship between earnings and stock prices by isolating rapidly growing companies with good prospects to exceed consensus earnings expectations.

The small-cap category is one of our most fruitful hunting grounds because the core of our strategy is developing an information edge through exhaustive research legwork. In general, smaller companies aren’t as closely followed as companies higher up the market-cap ladder. That means the grassroots insights we gather on trends in a company’s operational “food chain” can be especially valuable in assessing a stock’s potential.

We manage Friess Small Cap Growth Fund to be true to its name. The portfolio’s current-year average earnings growth rate is 80 percent higher than the Russell 2000 Growth Index’s average growth rate (as of September 30). In terms of market cap, micro- and small-cap companies represent more than 93% of assets, versus less than 70% for the Morningstar Small Growth Fund Category average.

Plus, with an active share of 97%, we build the portfolio to hold the best companies we can find without regard to the makeup of market indexes. We manage Friess Small Cap Growth Fund to outperform the indexes, not mimic them.

Friess Small Cap Growth (SCGNX) has a $2,000 minimum initial investment. The fund charges 1.45%. The Friess Small Cap Growth website is reasonably rich with direct and linked information (and a cool picture). The Insights page offers both a nice philosophical piece (“Stock Picking Requires Perpetual Curiosity”) and a video interview with Mr. Gates.

© Mutual Fund Observer, 2021. All rights reserved. The information here reflects publicly available information current at the time of publication. For reprint/e-rights contact us.

The Briefly Noted Omnibus

By David Snowball

Artisan Partners has filed to launch two new funds: Artisan Emerging Markets Debt Opportunities Fund and Artisan Global Unconstrained Fund. Artisan routinely interviews 10-20 management teams a year, folks interested in becoming partners. Their rule has always been, “only hire category-killers.” In this case, the assassins (or defectors, according to a colleague) in question, formerly managed Eaton Vance Global Macro Absolute Return Fund. That fund, curiously, didn’t appear to be killing anything but Artisan has to be given the benefit of the doubt, given a nearly unblemished record.

Arrow DWA Tactical: Income Fund will be liquidated (in an orderly manner, we’re promised) on or about December 23, 2021.

On December 8, 2021, AQR Core Plus Bond Fund will be liquidated.

Some time in the first quarter of 2022, Convergence Long/Short Equity Fund will become Convergence Long/Short Equity ETF. It’s a pretty solid fund with no worse than average expenses and a long-tenured team. It’s returned 13% annually over the past decade, which places it in the top 1% of long/short funds. We’d celebrate the conversion if expenses were also being reduced, but there’s no evidence of that. One unambiguous gain is the elimination of the fund’s $15,000 minimum initial investment requirement.

On December 17, 2021, at precisely 4:00 pm Eastern Time, Diamond Hill Global Fund will be liquidated. It’s a tiny, one-star fund.

Father Time wins again. Fidelity has announced that Joel Tillinghast (b. 1958) will retire from the management of Fidelity Low-Priced Stock Fund in 2023. Mr. T. manages $70 billion in assets for Fidelity. A protégé of Peter Lynch, he convinced Fidelity to launch the Low-Priced Stock Fund based on his research showing that stocks selling for under $2 / share were persistently mispriced. He was right, and he made a ton of money for his investors (and, presumably, himself). $10,000 entrusted to Mr. Tillinghast on the day he launched FLPSX would have grown to $550,000 today.

The single best piece of advice I’ve ever offered anyone was this: “Never bet against Mr. Tillinghast.”

Mr. Tillinghast is endlessly private, a member of Boston MENSA and has received every possible accolade (from “one of the world’s greatest investors” and “greatest investor you’ve never heard of” to “genius” and “virtuoso”). His announcement spurred a long and thoughtful discussion on the MFO Discussion Board.

On January 14, 2022, Harbor Funds will permanently retire the Target Retirement series of funds:  Harbor Target Retirement Income Fund, Harbor Target Retirement 2020 Fund, Harbor Target Retirement 2025 Fund, Harbor Target Retirement 2030 Fund, Harbor Target Retirement 2035 Fund, Harbor Target Retirement 2040 Fund, Harbor Target Retirement 2045 Fund, Harbor Target Retirement 2050 Fund, Harbor Target Retirement 2055 Fund, and Harbor Target Retirement 2060 Fund.

In January 2022, North Square Advisory Research All Cap Value Fund will become North Square Advisory Research Small Cap Value Fund. Uh-huh. By Morningstar’s calculation. 7% of the fund’s current assets are in small value stocks. 20% is in large-cap growth which signals a sort of rough transition ahead. Three or four other North Square funds will undergo similar rebirths, including a fund that has 63% large-cap growth stocks reborn as a small-cap fund.

Effective January 28, 2022, the Seven Canyons Strategic Income Fund will change its name to the Seven Canyons Strategic Global Fund.

In January 2022, the TCM Small Cap Growth Fund becomes Voya Small Cap Growth Fund. Net expenses might be down a bit but, otherwise, it will be the same fund.

Mark Oelschlager’s Towpath Focus Fund is rolling smartly along: up 19% in each of its first two years, well above its large-cap value peers. No real surprise there. As we noted at the launch of Towpath Technology Fund in December 2020, “exceptionally talented, albeit low-key, manager” with a remarkable record at the Oak Associates funds. There’s an old joke about an efficient market economist walking down the street with a friend when the friend spots a hundred-dollar bill lying on the sidewalk. The economist steps over the bill and keeps walking. His bewildered friend asks, “why didn’t you stop and pick up that bill? It was free money!” The economist shook his head pityingly and replied, “No. It wasn’t actually there. If it had been there, someone would have picked it up by now.” Mark’s November shareholder letter begs to differ. In “See a Penny (or a Million of Them) – Pick it Up,” he recounts Google’s curious decision to give free (and risk-free) pennies to investors holding their “C” class shares. He obligingly picked them up, to the benefit of his fund’s shareholders.

The $7 million Virtus AllianzGI Emerging Markets Consumer Fund will be liquidated on or about December 7, 2021 (a date that will live in infamy … wait, no, it probably won’t).