By Charles Boccadoro
During our annual (sometimes bi-annual) excursion to Chicago this past month, I was reminded of the old adage:
“We see things not as they are but as we are–that is, we see the world not as it is, but as molded by the individual peculiarities of our minds.”
Quickly followed by:
“It’s better to be uninformed than misinformed.”
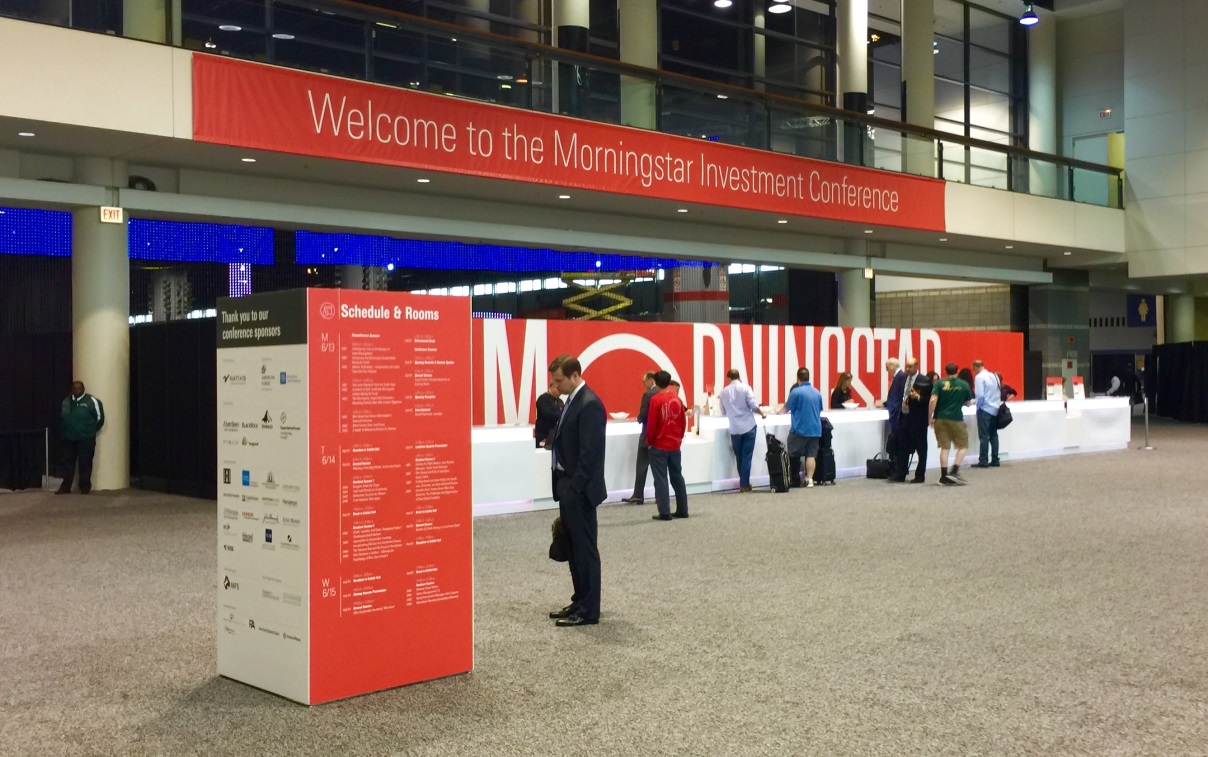
Company President Kunal Kapoor started the first day general session by showing Morningstar’s Market Fair Value metric … “It says the US market is fair valued.”
Gold-star fund manager Michael Hasenstab of Templeton Global Bond (TPINX) stated that “we are at a pretty rare point in markets where you have huge dislocations … unprecedented and untested monetary policy experiments creating tremendous amount of volatility.” The Fed will inevitably be raising rates, due to inflation and a labor market with little or no excess capacity. He is negative US Treasuries (“valuations nowhere near justified”), but sees “real upside opportunities in select emerging markets … the most unloved asset class.”
Later the same day, famed author and investing advisor Bill Bernstein stated that “I do find foreign equities valuations more attractive. Of course, there is good reason for that. Stocks don’t get cheap without good reason.”
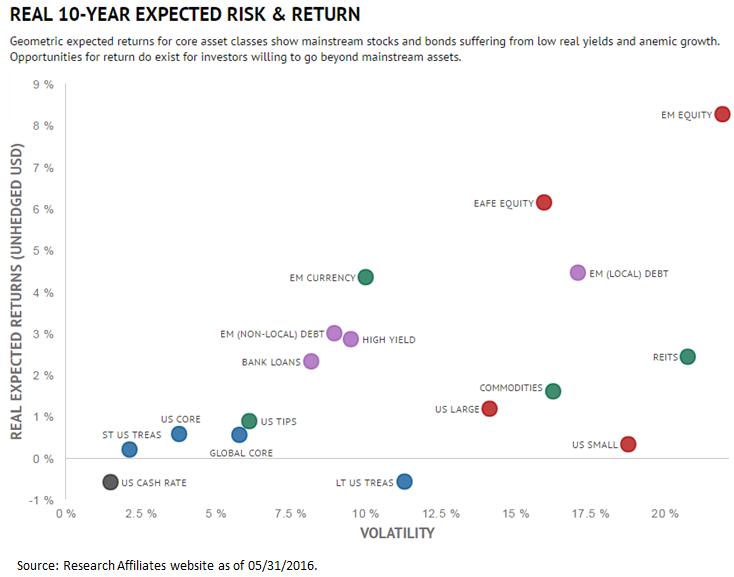
The day two general session featured a polite debate called “Meeting of the (Big) Minds: Arnott and Asness.” Mr. Arnott’s firm Research Affiliates maintains an Asset Allocation site that provides 10-year Expected Returns across various securities and asset classes. The bottom-line: near zero real return expected for traditional asset classes. “Valuations matter,” he explains. He sides with Professor Shiller that US equities based on historical norms are currently overvalued.
During a sidebar with Tadas Viskanta, founder and editor of Abnormal Returns, he offered his impression of the conference: “Grasping at straws…”
Our colleague Ed Studzinski later added: “Half the people in this room will not be here five years from now.”
How many people were there? 2016, including 831 paid advisors, 581 exhibitors, and 43 speakers.

Why might Ed think the attendance will be under pressure? I’ll offer two reasons: The Department of Labor’s (DOL’s) Fiduciary Rule and Vanguard; basically, the two elephants at the conference.
As background, please reference:
- Fact Sheet – DOL Finalizes Rule To Address Conflicts of Interest In Retirement Advice, Saving Middle-Class Families Billions of Dollars Every Year.
- “Why Vanguard Will Take Over the World,” by our colleague Sam Lee from October 2015 commentary.
The new fiduciary rule requires investment professionals, consultants, brokers, insurance agents and other advisers “to abide by a fiduciary standard—putting their clients’ best interest before their own profits.”
Patrick Clary, Chief Compliance Officer at AlphaArchitect (former USMC Captain, a Harvard MBA, ops/complinance ninja) puts the meaning of fiduciary in proper perspective in the insightful March 2015 post “Distribution Economics – Understanding Wall Street’s Conflict of Interest Problem”:
Fiduciary responsibility matters in financial services more than in any other product category outside of urgent medical care. Shouldn’t this fiduciary have your best interests at heart? Just as you don’t want your doctor to receive kickbacks from Pfizer for overdosing you on Oxycodone, why would you want your financial advisor–or their institution–to receive kickbacks for overdosing you on inefficient, overpriced, investment product that probably won’t help you achieve your investment goals?
HBO’s John Oliver recently gave a more humorous but no less accurate account (click on image to play YouTube video):

In the same session where Bill Bernstein spoke, Morningstar’s Don Phillips warned the fiduciary rule will usher in an “era of blame … litigation heaven.” And in fact, several groups have filed suit against implementation, which is scheduled to become effective initially April 2017, with final compliance required by 1 January 2018.
During the conference break-out session “The Fiduciary Rule and the Future of the Industry,” analyst Michael Wong presented an assessment of impact of rule on financial industry:
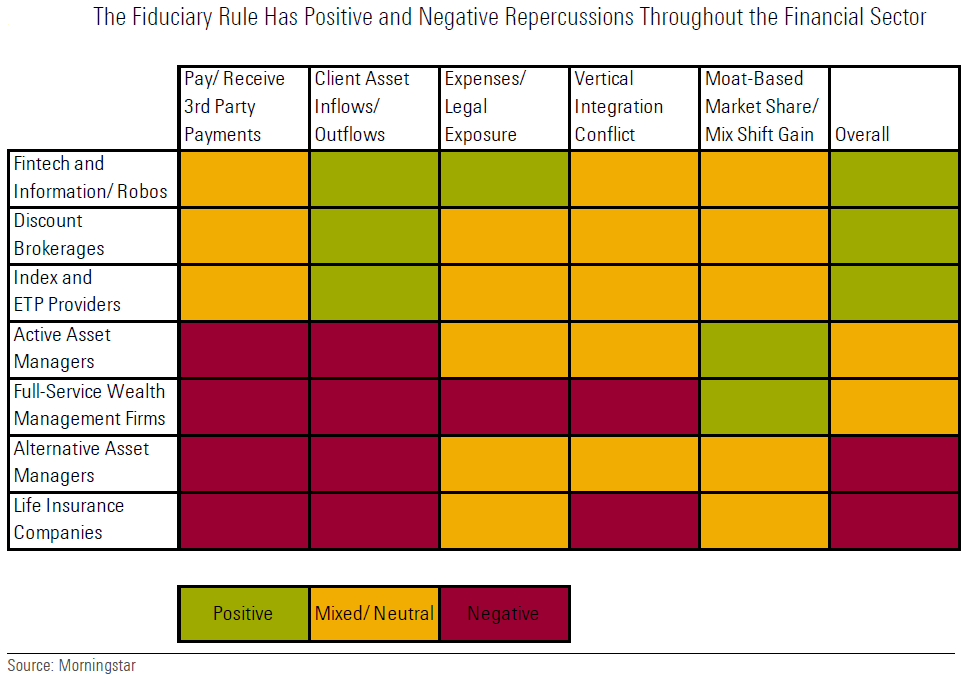
He predicts three main trends:
- The movement to fee-based from commission-based full-service wealth management accounts.
- Adoption of robo-advisors and digital advice solutions.
- Shift to relatively lower-cost passive investment products from actively managed.
Morningstar was kind enough to share the session’s presentation charts, here.
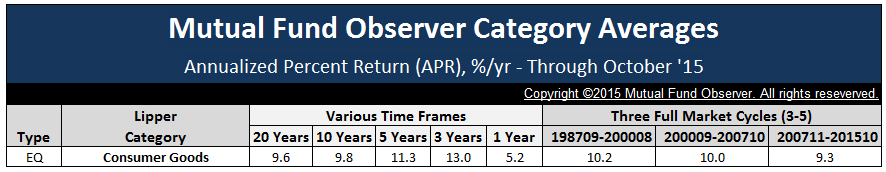
Here is a telling example of landscape investors face today. Lipper identifies 42 funds in the category “S&P500 Index,” oldest share class only, at least three months old, as of May 2015. The expense ratios range from less than 20 basis points for funds offered by Vanguard, State Street, Schwab, Northern Funds, Fidelity, Blackrock, and DFA to nearly 60 basis points and higher for funds offered by Legg Mason, Great-West, and Nuveen.
Hard to see how any advisor “acting as a fiduciary” could recommend the funds with the substantially higher expense ratios.
Lipper shows 693 US large cap equity funds, but exclude the S&P Index and other index funds, the number is 532. There are more actively managed large-cap funds than stocks traded in the S&P500! Some industry experts believe the fiduciary rule will help flush out “closet indexers.”
Similarly, Lipper shows 2,447 US Equity funds, which is nearly as many funds as there are equities in the Russell 3000 Index, representing 98% of the US public equity market. How can that be? David is fond of enlightening us: “… 80% of all funds, active and passive, could vanish without any loss to anyone other than their sponsors.”
Maybe Ed has underestimated.
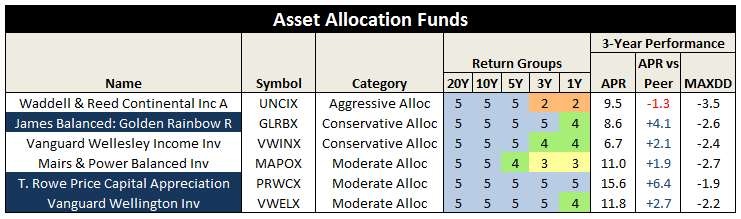
Michael Wong reports: “We’ve already seen the exit of several foreign banks (Barclays, Credit Suisse, Deutsche Bank) from the U.S. wealth management landscape, sale of life insurance retail advisory businesses (AIG, MetLife), and restructuring of wealth management platforms (LPL Financial, RCS Capital, Waddell & Reed) in anticipation of the rule.”
At the same session, Morningstar Australia’s Anthony Serhan stated that the rule, which effectively imposes “fiduciary” criteria in place of “suitability” criteria currently practiced, will help force brokers and fund companies to unbundle their proprietary products from financial advice. The rule will bring more transparency … like turning on a light in a dark room. Serhan warns: “Put decent value on table or be challenged.”
One fund manager speculated that brokers will likely switch to using Morningstar ratings instead of their own “Select Lists” or “Preferred Lists” currently practiced.
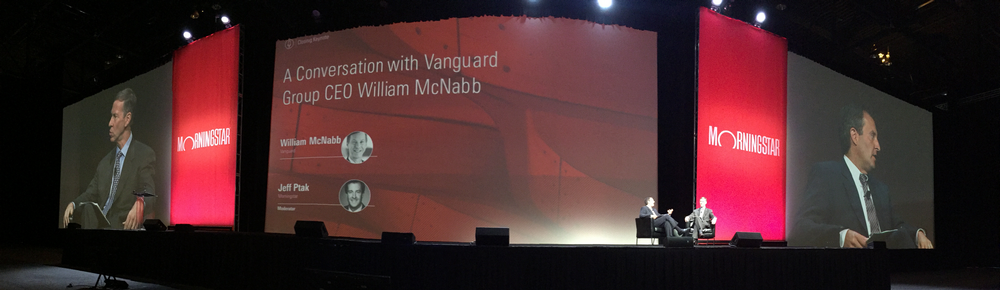
On day three general session, Vanguard CEO Bill McNabb encouraged advisors not put off implementation of DOL’s fiduciary rule because of current lawsuits … will take 12-18 months to implement required processes so “prepare as if court cases will not be successful.”
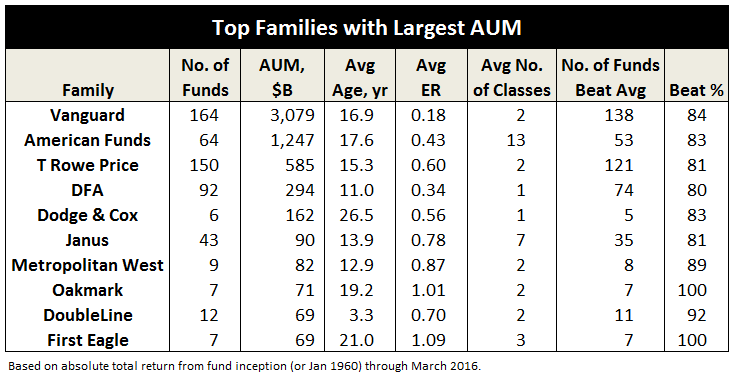
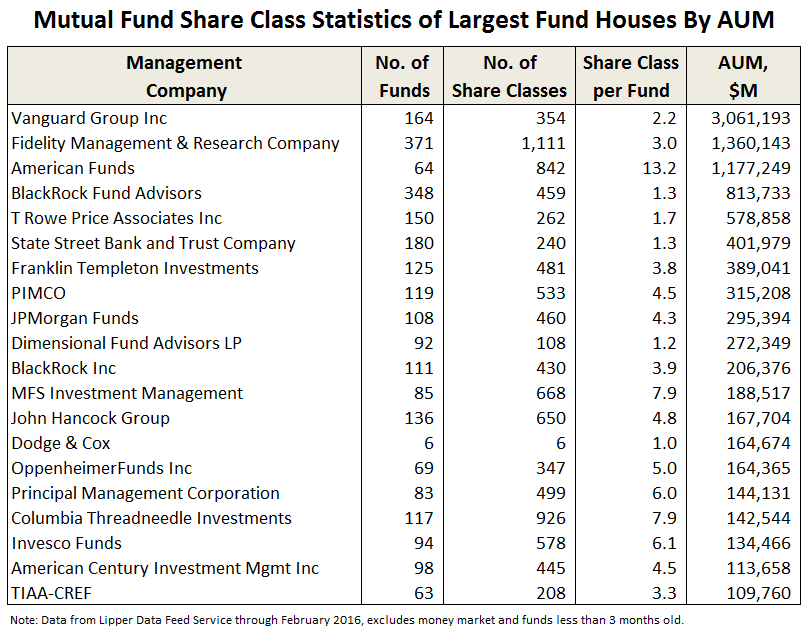
The new fiduciary rule will only help to advance Vanguard’s already dominant position. Of the 9,360 US mutual funds through May, excluding money market and funds less than 3 months old, Vanguard has five of the top six funds by assets under management (AUM):
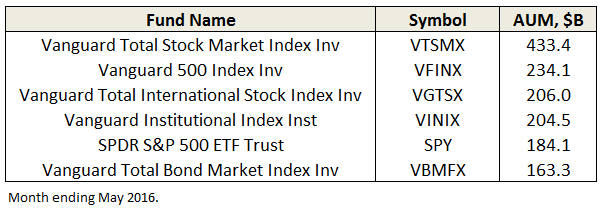
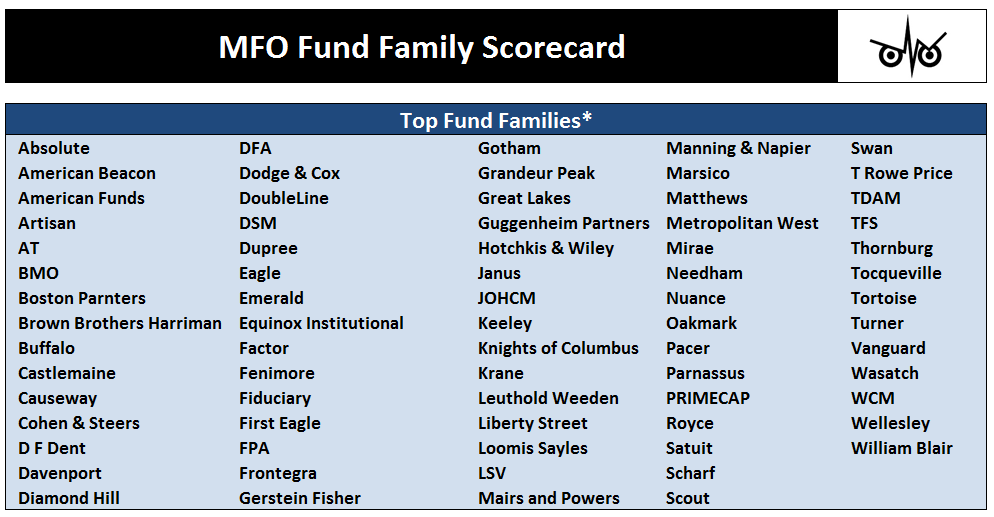
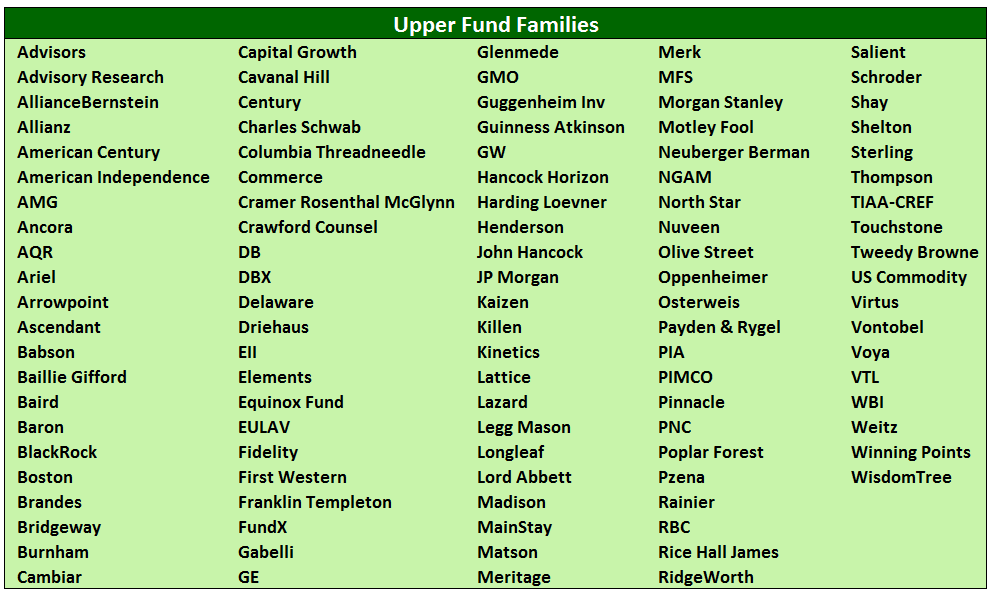
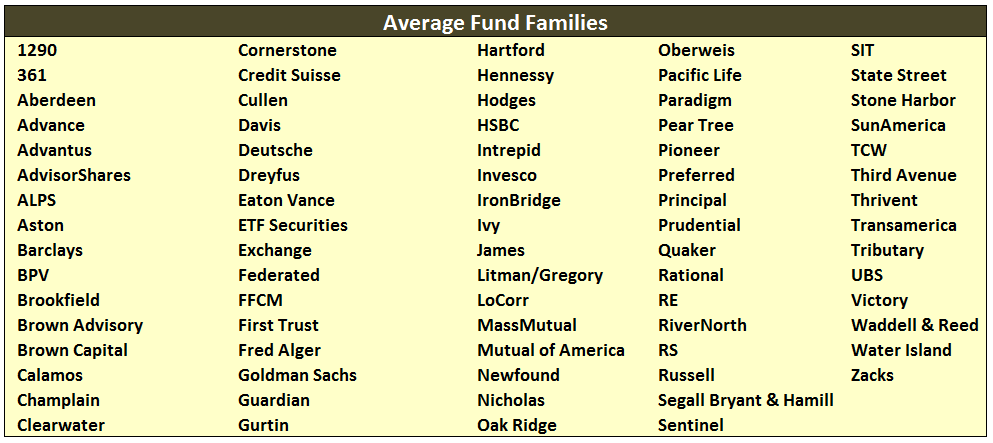
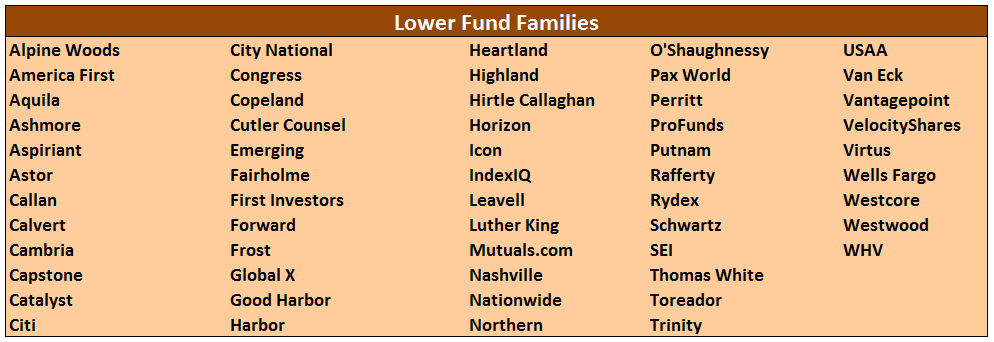
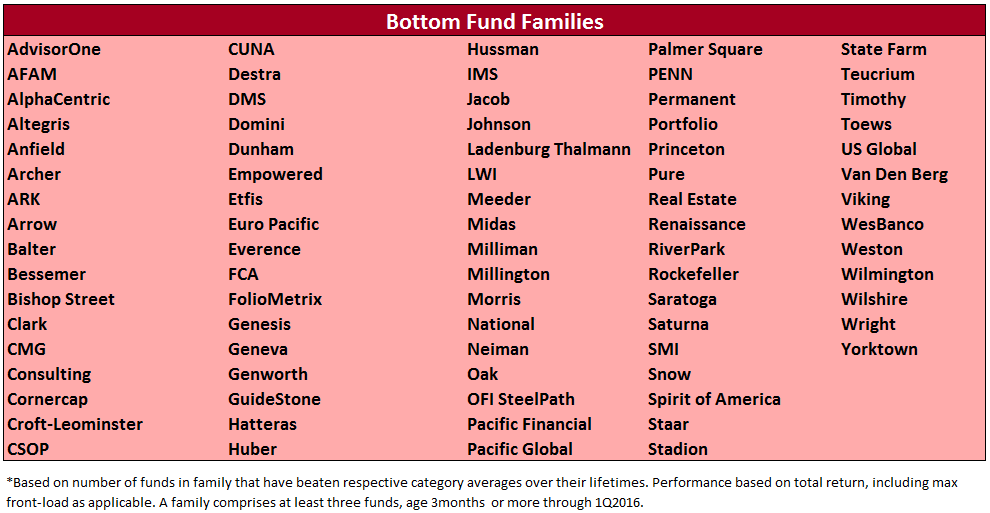
It has 36 funds in the top 100. It has $3.4T in AUM. Our MFO Fund Family Scorecard shows 76% of Vanguard’s 164 funds have beaten their peers since inception.
Its fees are amongst the lowest in industry. Its robo-advisor, Vanguard Personal Advisor Services VPAS, has quickly gained $40B in AUM mostly from existing Vanguard customers.
Mr. McNabb stated VPAS targets accounts between $50 – 200K and charges 30 bps points versus the 1% charged by most advisors. His advice to other advisors: “Go lower, or do more.”
Going forward McNabb’s vision for Vanguard in 2026 “will be a far more global firm … where we really run all of our investments on a global basis.” Only $300B of its AUM is from non-US clients. He sees tremendous demand for Vanguard products globally and meeting that demand will be “the most profound change in Vanguard over the next decade.”
On the product side, he sees making more tools available to advisor community, particularly to help manage the “drawdown phase” facing retired baby boomers. And also sees simplification of services … vibrant applications for mobile and a move away from PC-based tools.
While enjoying deep dish pizza after the conference at the famed Giordano’s and then stroll afterward to walk it off up Michigan Avenue to Chicago’s magnificent Millennium Park, our colleague Sam Lee pondered that scandal would be the only threat to Vanguard’s continued dominance.